Ten years ago a coach walked into a locker room with a gut feel that a player was run down. He had no clear data, only experience and a hunch. Today that same coach can open an app fed by GPS, HRV, sleep, and motion sensors to see a clear risk trend.
This review combines evidence from 68 studies (2015–2024) and field-tested platforms like WHOOP, Catapult, Polar, and Oura Ring to show how wearables plus machine learning flag emerging injuries and guide training choices.
We focus on real outcomes: earlier detection of overuse patterns, personalized workload control, and readiness scores that improve performance and health. Edge and cloud pipelines enable fast alerts while teams weigh latency, privacy, and model explainability.
The list that follows is evidence-aware. It explains sensors used, model classes (CNN, RNN/LSTM), validation metrics, and practical adoption by coaches and medical staff across U.S. programs and global research.
Key Takeaways
- Top platforms pair GPS, HR/HRV, IMUs, and sleep data to guide training and recovery.
- Machine learning (CNN, RNN/LSTM) enables real-time risk detection and personalized insight.
- Evidence from 68 studies supports better injury prevention and performance optimization.
- Edge vs. cloud processing balances speed and reliability for timely alerts.
- Practical thresholds and readiness scores translate signals into coaching actions.
Why AI injury prediction and IoT in Sports matter right now
Wearable sensors and live analytics are changing how teams spot early warning signs and guard athlete health.
Modern devices collect heart rate, HRV, sleep, temperature, movement, and EMG and stream that data over BLE, ANT+, or Wi‑Fi to apps and cloud services. Continuous signals let models detect subtle trends tied to fatigue, workload spikes, and rising injury risk.
That flow enables real-time coaching adjustments and faster clinical escalation when thresholds trigger. Longitudinal records create baselines so deviations stand out early — a key factor for prevention and better performance over a season.
Teams now pair machine learning with clear care pathways so detected risks route to clinicians for timely action. Still, sensor variability and model generalizability demand calibration, transparent reporting, and quality controls.
Research from 2015–2024 shows validated models moving from labs to practice. The result is a shift from reactive treatment to measurable prevention, extending athlete careers and improving sports medicine outcomes.
How we selected the Top Sports Injury Prediction Systems
Selection began with a systematic literature sweep and practical deployment checks. We ran Boolean searches across PubMed, Google Scholar, IEEE Xplore, and ScienceDirect (2015–Apr 2024). Screening followed a simplified PRISMA flow: 472 records → 111 full texts → 68 included studies.
Evidence grading prioritized randomized trials and large cohorts. We flagged RCTs (12 ▲), cohort/observational studies (31 ■), and narrative syntheses (25 ●). Validation metrics focused on AUC and accuracy across soccer, basketball, running, rugby, and cycling datasets.
Evidence-backed criteria: sensors, models, validation, and real-world use
Core criteria included sensor breadth (GPS, HR/HRV, IMU, EMG, temperature, sleep), data quality controls, and pipelines for ingestion and preprocessing.
Model standards favored architectures matched to signals: CNN for spatial patterns, RNN/LSTM for time series, and baseline classifiers like logistic regression or SVM. We required clear validation splits and reported AUC/accuracy.
Grading rigor: RCTs, cohort data, and narrative synthesis
External validity and operationalization were essential. Systems with deployment in elite teams, collegiate runners, or rehab clinics scored higher. Transparency and explainability also influenced ranking for clinician and coach adoption.
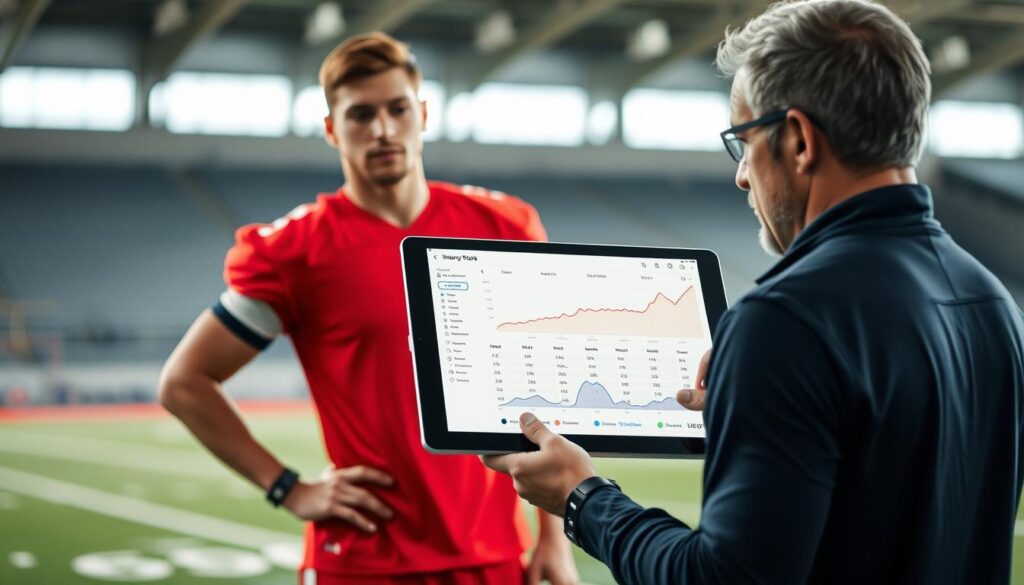
Data governance and manufacturer support were part of the evaluation. We checked for privacy, consent, ownership clauses, and ongoing recalibration resources.
| Criterion | What we checked | Why it matters |
|---|---|---|
| Sensor stack | GPS, HR/HRV, IMU, EMG, temp, sleep | Captures workload, physiology, and movement signals |
| Model validation | AUC, accuracy, clear splits | Shows generalizability and performance |
| Study design | RCTs, cohorts, narratives | Signals evidence strength and bias risk |
| Operational fit | Real-world use, explainability, coach workflows | Enables practical adoption and trust |
- Preference for devices with documented metrics (HRV, ACWR, gait asymmetry) and clear action thresholds.
- Cross-sport generalizability was evaluated to limit overfitting to a single team or season.
- Ongoing research and vendor support raised a product’s grade for long-term deployment.
Catapult Sports: GPS-driven load monitoring with machine learning insights
Catapult’s platform turns GPS and load metrics into coach-ready alerts that guide daily training choices. The system combines external movement measures with internal responses to give a complete picture of team workload and readiness.
Sensor stack and operational metrics
GPS, accelerometers, HR/HRV, movement load
Catapult captures distance, high-speed running, and accelerations alongside heart-rate and HRV. These signals quantify external and internal stress for each athlete.
AI approaches
Random forest ensembles detect multivariate risk patterns across GPS and HR features. RNNs model time-dependent load trends tied to soft-tissue events.
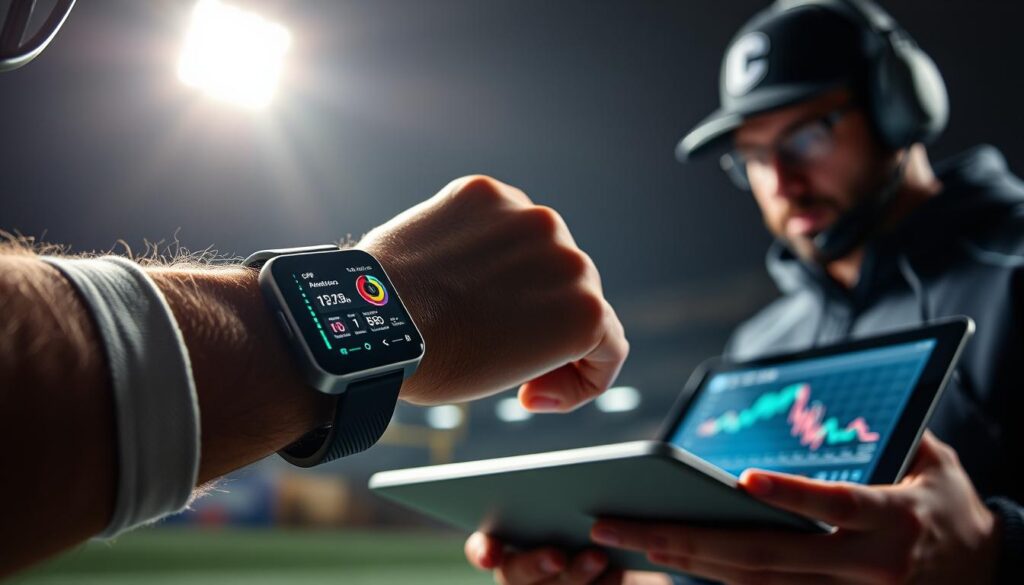
Key metrics include ACWR, intensity zones, and acute workload spikes that correlate with elevated risk. Elite soccer cohorts show AUC values up to 0.87 for soft-tissue event forecasting in controlled trials.
- Live session dashboards and coach alerts for tapering and periodization.
- Post-session analysis for trend review and return-to-play notes.
- Seasonal retraining to keep models calibrated as team dynamics change.
| Feature | What it measures | Why coaches use it | Limitations |
|---|---|---|---|
| GPS & accelerometer | Distance, sprints, accelerations | Quantifies external load | Placement and signal loss affect accuracy |
| HR / HRV | Physiological load, recovery | Tracks internal stress and readiness | Artifact cleaning needed for quality |
| ML models | Multivariate risk patterns, time-series trends | Predicts elevated risk for overshoot events | Needs retraining and transparent thresholds |
| Workflows | Live monitoring and post-session reports | Supports coaching decisions and clinician notes | High-volume setups need robust pipelines |
Catapult is best for elite team environments that need scalable monitoring, clear dashboards, and evidence-backed analytics. Transparent thresholds and medical interoperability build trust, while consistent sensor placement and device calibration remain key for reliable outcomes.
WHOOP: HRV-centered recovery scoring for injury risk modulation
Daily readiness scores from WHOOP translate physiology into clear cues for workload and recovery. The platform measures HRV, strain, sleep staging, and skin temperature to generate a recovery index used by coaches and clinicians.
Physiology first: HRV, sleep staging, skin temperature
WHOOP focuses on internal load via morning HRV and detailed sleep metrics. Drops in HRV often signal parasympathetic fatigue and rising risk of adverse outcomes.
![]()
Personalized thresholds: fatigue detection and ACWR alignment
The system builds tailored baselines so trends reflect a tailored individual profile. Strain scores align with ACWR concepts to guide conservative or aggressive training choices.
- Actionable threshold: reduce intensity when morning HRV falls >20% from baseline.
- Sleep rule: delay high-intensity sessions if sleep efficiency
- Skin temp shifts can indicate illness or maladaptation and prompt load cuts.
“Consistent wear and morning routines improve signal quality and the value of daily coaching cues.”
Integration and care: WHOOP’s app-driven feedback supports adherence and flags athletes for clinician review if recovery scores stay low despite reduced training. Attention to consistent wearing and artifact handling is essential for reliable data and better performance optimization and injury prevention.
Oura Ring: Sleep-readiness intelligence for return-to-train decisions
Nightly signals can change the next day’s training plan. The Oura Ring records sleep stages, sleep efficiency, resting pulse surrogates, and skin temperature to build a daily readiness trend. Teams and clinicians use that trend to decide whether to progress sessions or hold back for recovery.
Recovery markers and thresholds
The ring flags low sleep quality — often defined in the literature as sleep efficiency below 75% or total sleep under 6 hours — as a sign to reduce intensity or volume. Temperature deviations greater than 1.5°C from an athlete’s baseline warn of heat stress or possible illness and prompt conservative load cuts.
How to apply Oura readiness to training and rehab
- Readiness score: combines sleep quality, resting physiology, and temp deviation to guide daily return-to-train choices.
- Trend focus: multi-day declines matter more than single outliers for reliable decision-making.
- Field complement: pairs well with load monitoring tools by covering the recovery side of the load-recovery balance.
- Rehab use: readiness trends help stage progressions from low to moderate intensity during rehabilitation.
Best practices include consistent nighttime wear, morning check-ins, and matching objective scores with subjective wellness reports. Privacy matters: set clear, consensual data-sharing protocols for staff access.
“Component-level subscores reveal whether poor sleep, altered resting physiology, or temperature drove a readiness drop.”
Practical tip: integrate readiness into periodization during travel or congested schedules to reduce risk and protect performance and health.
Polar Training Analytics: Integrated HR and GPS for balanced workload
Polar links internal cardiac markers with external pace and distance to highlight when to ease or push training.
From session data to risk signals: HR, HRV, speed, distance
Polar combines HR and HRV with GPS-derived speed and distance to calculate session strain and cumulative workload.
That mix turns raw metrics into clear risk signals, flagging intensity spikes or short recovery windows that can raise the chance of injuries.
Coaching cues: tapering, intensity modulation, recovery windows
Practical cues include tapering before key events, lowering session intensity when HRV trends fall, and extending recovery windows after high-load blocks.
Dashboards visualize recovery status and performance metrics so staff and athletes see day-to-day guidance without custom modeling.
“Consistent HR/HRV measurement protocols are essential for reliable coaching cues and better health outcomes.”
- Combines internal load (HR/HRV) with external load (pace/distance) for session strain.
- Translates session data into simple alerts for overload and recovery needs.
- Works across pace-based sports and fits club or individual workflows.
AI-enhanced IMU platforms for runners: gait and cadence prediction models
Small, body-fixed sensors capture every step, letting coaches see how gait changes with fatigue. Foot pods and shoe-mounted IMUs record cadence, contact time, and left-right asymmetry on every run.
Models in action
CNNs extract features from raw gyroscope and accelerometer waveforms to spot subtle asymmetry and stride variability.
Logistic regression delivers an interpretable risk score that maps gait deviations to a simple alert for staff.
Use cases and evidence
Studies of collegiate runners using foot pods and gyros reported AUCs near 0.76 for forecasting biomechanical instability. That moderate performance supports practical screening and early-warning workflows.
Outputs translate into coaching actions: cadence tuning, footwear review, and targeted strength work to reduce asymmetry.
- Continuous monitoring catches fatigue-related drift late in sessions.
- Alerts trigger recovery-focused days when variability crosses thresholds.
- Integration with training logs links biomechanical shifts to volume or intensity changes.
- Proper sensor placement and periodic calibration minimize noise and keep results reproducible.
“Periodic model recalibration with fresh data keeps accuracy high across seasons.”
Basketball-specific monitoring suites: fatigue, balance, and overuse risk
On-court actions—rebounding, sprinting, and abrupt cuts—drive cumulative load that can erode resilience over a season.
Sensor fusion combines IMUs, indoor LPS/GPS substitutes, heart rate, and force plates to quantify jump load, deceleration stress, and lateral demands. These sensors collect continuous data and feed consolidated dashboards for coaching and medical staff.
Classifiers such as SVM and ANN have been applied to basketball cohorts to classify fatigue states and flag overuse risk. Observational research reports team-level accuracies near 81%, showing practical value for season-long monitoring.
In practice, the suite helps staff reduce jump volumes, manage back-to-back intensity, and add balance or landing drills. Individual baselines are essential to separate mid-season shifts from normal variability.
Continuous analysis lowers false alarms by adding context: travel, schedule density, and prior conditions. Integration with medical screens yields a fuller risk profile and targeted neuromuscular interventions.
- Mitigate indoor positioning limits with multi-sensor corroboration.
- Prioritize recovery modalities when fatigue flags persist across sessions.
“Sensor fusion paired with individualized baselines provides the clearest path to prevention and better performance.”
Rugby and multi-sport dashboards: deep learning for contact and noncontact injuries
Rugby and other team codes demand dashboards that translate complex time-series into clear daily actions. Coaches and clinicians now combine GPS, accelerometer, and gyroscope traces with heart metrics to get a fuller view of load and recovery.
Temporal dynamics: LSTM and deep nets for sequence data
LSTM and DNN architectures capture the sequence nature of matches and microcycles. They learn temporal patterns that single-shot classifiers miss, such as load accumulation after repeated collisions.
Controlled trials report AUCs up to 0.85 for squad-level risk stratification when models use labeled time-series and event annotations.
Operational outcomes: tapering guidance and RTS timing
Dashboards convert model probabilities into green/yellow/red statuses that guide tapering plans and return-to-sport milestones. Teams separate contact exposure from noncontact metrics by combining external exposure with internal response.
Practical workflows include rolling retraining windows to adapt to roster and style changes, strict event annotation for collisions, and edge processing to reduce stadium latency.
- Coordination: coaches and medical staff reconcile alerts with exams.
- Microcycle rule: reduce high-load drills for 48–72 hours after heavy contact matches to lower noncontact risks.
- Transparency: clear risk communication keeps athletes informed and consenting.
Sports Injury Prediction Systems buyer’s guide for 2025
This buyer’s guide helps teams, clinicians, and performance staff choose tools that map signals to clear actions.
Match your sport and risk profile: metrics that matter
Metric-to-action checklist:
- HRV drop >20% from baseline — reduce intensity that day.
- ACWR >1.5 — taper volume and add recovery days.
- SmO2 <50% at rest — avoid heavy eccentric loading.
- Gait asymmetry >10% — begin neuromuscular rehabilitation.
- Sleep efficiency <75% or <6 h — delay return-to-sport protocols.
- Temperature deviation >1.5°C — halt high-load work and assess.
Model transparency and explainability: trust and adoption
Pick vendors that document AUC and accuracy by cohort and publish evidence grades. Explainable models build staff trust and improve athlete adherence.
“Clear rationale for each alert is essential for clinician sign-off and coach buy-in.”
Integration and scalability: teams, clinicians, and data pipelines
Check compatibility with athlete management platforms, EHRs, and common connectivity (BLE, ANT+, Wi‑Fi). Assess onboarding, sensor replacement logistics, calibration workflows, and vendor support.
- Data governance: explicit consent, role-based access, and clear ownership terms.
- Tailored individual baselines adapt thresholds to each athlete over time.
- Plan a pilot with predefined success metrics and a clear total cost of ownership.
Inside the IoT in Sports stack: from sensors to real-time AI injury prediction
An end-to-end telemetry chain captures movement and physiology, then returns actionable guidance during sessions.
Wearables and sensors: GPS, HRV, EMG, IMUs, temperature
Multi-modal capture pairs GPS for external load with HR/HRV for autonomic state, IMUs for motion events, and EMG for muscle effort.
Sleep and skin temperature complete recovery context. Devices stream over BLE, ANT+, or Wi‑Fi for central processing.
Edge versus cloud inference: latency, bandwidth, and reliability
Edge inference runs simple models on-device for instant cues during training. Cloud analytics host heavier models and fleet retraining for cohort insights.
Resilience needs local buffering, integrity checks, and sync rules when connectivity drops to protect stored data.
Closed-loop feedback: alerts, training load tweaks, rehab progress
Closed loops turn model outputs into coach-facing alerts and automated session tweaks that enable prevention and staged rehab milestones.
- API-first design for integration with athlete management platforms.
- Encrypted transmission and role-based access secure sensitive data.
- Telemetry metadata (session type, surface, weather) ensures correct context for alerts.
“Clear thresholds and progressive milestones make remote rehab measurable and safe.”
Validation that counts: from AUC to return-to-sport decisions
Validation should translate numeric performance into safe, actionable clinical choices.
Model performance: RNN/LSTM, CNN, SVM, and ensemble methods
Why AUC and accuracy matter: AUC is preferred for imbalanced team datasets because it reflects ranking ability across thresholds. Accuracy can be misleading when events are rare.
Representative results show strong external validity: soccer random forest/RNN AUC = 0.87 (RCT), rugby DNN AUC = 0.85 (RCT), basketball SVM/ANN accuracy = 81% (observational), running CNN/logistic AUC = 0.76 (narrative synthesis).
Compare families: LSTM/RNN handle sequence trends, CNNs extract waveform features, SVM/logistic models are interpretable, and ensembles (e.g., XGBoost) excel on tabular stacks. Choose based on signal type and clinical need.
Actionable thresholds: HRV drops, ACWR > 1.5, SmO2, gait asymmetry
Convert probabilities into concrete steps: HRV drop >20% → reduce intensity that day. ACWR >1.5 → taper volume. SmO2 <50% → avoid heavy eccentric loading. Gait asymmetry >10% → start neuromuscular rehab.
Calibration and re-validation each season keep predicted probabilities aligned with observed rates. Blend model scores with clinician exams and athlete-reported symptoms for final RTS calls.
“Transparent confidence intervals, clear validation splits, and explainable feature importance are essential for trust.”
| Metric | Use | Study type |
|---|---|---|
| AUC | Ranking model ability on rare events | RCT reports (soccer, rugby) |
| Accuracy | Simple correctness for balanced labels | Observational cohorts (basketball) |
| Operational KPIs | Precision, recall, adherence, incidence reduction | Program monitoring across seasons |
- Require vendors to expose SHAP-style explanations for feature importance.
- Monitor alert precision and intervention adherence as primary outcomes.
- Recalibrate thresholds based on observed follow-up and confidence intervals.
Risks, ethics, and data quality in AI injury prediction
Advanced monitoring brings big benefits, but it also creates real operational and ethical challenges that teams must manage.
False positives and negatives can erode trust and disrupt training. A spurious alert may force unnecessary rest, altering periodization and athlete morale. Missed warnings let strain accumulate and delay care.
Sensor placement, signal noise, and cross-device variability degrade data quality. Poorly mounted units or differing firmware produce inconsistent measures that confuse models. Routine calibration and sensor QC protocols reduce drift and improve repeatability.
Generalizability and dataset limits
Many models train on small, sport-specific cohorts, which limits transfer to other teams or levels. Standardized data schemas and cross-validation across seasons and squads help close that gap.
Privacy, consent, and ownership
Explicit consent, data minimization, and clear ownership clauses protect athletes. Governance frameworks should spell out who can access raw measurements and for what purposes.
- Operational fixes: routine recalibration, rolling retraining, and season-level cross-validation.
- Security: de-identification, encryption, and access logs for all staff and vendors.
- Ethics: require explainability for any alert that affects workload or selection.
- Oversight: create an internal ethics board to review model updates and policy changes.
- Education: train athletes and staff on device limits, expected false alarm rates, and how to respond to alerts.
“Transparent governance and clear data quality processes are essential to ensure tools help rather than harm athlete care.”
Conclusion
Teams now get near-real-time alerts that convert physiologic and motion trends into guided recovery steps.
Wearables plus AI enable continuous monitoring and personalized insight tied to thresholds such as an HRV drop >20% or ACWR >1.5. These rules, backed by multi-sport evidence, translate data into daily coaching and rehabilitation choices.
Responsible deployment requires attention to data quality, consent, and clear model explainability. Balanced edge–cloud architectures keep alerts timely while preserving privacy and audit trails.
Pilot thoughtfully, measure outcomes, recalibrate models each season, and train staff and athletes. With better datasets and transparent validation, predictive tools will become standard care across US sports and beyond.
FAQ
What criteria did you use to select the top wearable and analytics platforms for 2025?
How do heart-rate variability and sleep metrics help reduce risk and optimize readiness?
Are GPS and accelerometer stacks reliable for workload monitoring during competition?
What machine learning approaches are most effective for time-series risk forecasting?
How should teams balance edge inference versus cloud processing for live alerts?
What common thresholds or markers trigger actionable interventions?
How do providers validate their tools to ensure clinical relevance?
What privacy and consent issues should organizations address when deploying monitoring tech?
Can recreational athletes benefit from these platforms, or are they only for elite teams?
How do clinicians and coaches ensure model outputs lead to better decisions, not confusion?
What are the main limitations and common failure modes of current platforms?
How important is integration with electronic medical records and performance software?
What should buyers prioritize in a purchasing decision for the coming season?
How can organizations reduce bias and improve model fairness across diverse athlete groups?
What role do rehabilitation metrics play in closed-loop systems?
Transform Your IoT Vision Into Reality.
Get free expert insights, architectures & cost breakdowns.
Drop your email to schedule free meeting.