Smart Retail shelf inventory mismatch detection to prevent lost sales

Lost sales in brick-and-mortar stores often happen quietly. A customer reaches for a product, but the shelf is empty. Your backend system says you have stock, but the physical reality tells a different story.

This gap between recorded inventory and actual stock levels is a critical challenge. It leads directly to missed revenue and frustrates shoppers. Modern operations need a way to see what’s happening at the point of sale in real time.

smart retail shelf inventory detection

Electronically connected shelving systems provide the answer. These intelligent units use IoT sensors and RFID tags to track product availability automatically. The global market for this technology is projected to reach $15.34 billion by 2030, highlighting its growing importance.

This guide will walk you through understanding the problem, exploring available technologies, and implementing a system step-by-step. It focuses on transforming inventory accuracy and operational efficiency for competitive stores. These systems bridge physical spaces with digital commerce expectations, preventing customer frustration.

Key Takeaways

  • Inventory mismatches between systems and shelves cause lost sales and customer frustration.
  • Real-time visibility at the point of sale is essential for modern retail operations.
  • Electronically connected shelving uses sensors and IoT to automatically track stock.
  • The market for intelligent shelving is growing rapidly, indicating its value.
  • Implementing these systems improves inventory accuracy and supports omnichannel strategies.
  • They help prevent out-of-stock situations and misplaced merchandise.
  • Accurate shelf data enables better replenishment and reduces revenue leakage.

Understanding the Importance of Accurate Inventory Management

The disparity between what a store’s system reports and what sits on its shelves is a primary profit leak. Precise inventory management is the foundation for operational efficiency and revenue protection in physical commerce.

When counts are wrong, every part of the business suffers.

Identifying the Causes of Inventory Mismatches

Several factors create this gap. Human error during manual counts is a major one. Theft, misplaced goods, and unreported damage also distort records.

A critical flaw is the lag between a sale at the register and the system update. This delay means data is always playing catch-up with reality.

causes of inventory mismatches

The Impact on Lost Sales and Customer Experience

Empty shelves mean lost sales. Shoppers will buy elsewhere or abandon their trip. This directly hits a location’s bottom line.

The shopping experience erodes when online promises don’t match in-store availability. Trust and brand loyalty fade. According to the National Retail Federation, in-store purchases can be more profitable, making shelf accuracy critical.

Real-time data from connected units minimizes out-of-stock scenarios. This leads to higher satisfaction and more return visits, securing future revenue.

Exploring the Technologies Behind Smart Shelves

A technological ecosystem of sensors, cameras, and digital labels turns ordinary shelving into a data hub. This combination provides the eyes and intelligence needed for accurate, real-time stock visibility.

Each component plays a distinct role in capturing and communicating inventory status.

Digital Shelf Labels and Their Multifunctional Roles

Electronic shelf labels (ESL) replace paper tags. These digital displays show pricing, promotions, and detailed product information instantly.

Advanced solutions like SOLUM Newton labels can show multiple pages of data. This helps with stocking tasks and attracts customer attention.

They integrate into central management systems. This allows for updates across all store locations from one platform.

technologies behind smart shelves

Shelf Sensors, Cameras, and RFID Integration

Weight sensors monitor shelf load continuously. They calculate removal and trigger restock alerts automatically.

IoT devices like motion sensors and cameras add another layer. Cameras use computer vision to spot empty spaces and track shopper engagement.

RFID tags enable item-level tracking. Radio frequency readers identify products from warehouse to shelf, improving accuracy.

Technology Primary Function Data Granularity Best Use Case
Digital Labels (ESL) Dynamic information display & price updates Shelf/Product SKU High-turnover items with frequent price changes
Weight Sensors Continuous load monitoring & removal detection Unit count by weight Bulk, uniform products like canned goods
RFID Tags Item identification & supply chain tracking Individual item level High-value goods, apparel, electronics

Choosing the right mix depends on product type and operational goals. Integration creates a powerful, unified system for inventory control.

Leveraging Smart Retail Shelf, Smart Retail Solution for Inventory Accuracy

Moving from traditional stock counting to automated, real-time tracking is a strategic project. It demands careful execution and a clear roadmap.

Retailers must begin with a thorough assessment. This includes auditing high-priority items and calculating the expected return on investment.

A phased rollout minimizes disruption. Start with a pilot program in one store section to test performance.

Step-by-Step Implementation Guide for Retailers

The first phase involves vendor selection and hardware procurement. Ensure new technology is compatible with your current systems.

Installation includes physical retrofitting of units and sensor mounting. Network infrastructure must support continuous data flow.

Comprehensive training for staff is critical. They need to learn new workflows and how to respond to restock alerts.

After deployment, a calibration phase fine-tunes the system. Validate sensor accuracy and refine alert thresholds.

Implementation Phase Key Activities Success Metric
Pre-Assessment Inventory audit, ROI calculation, pain point identification Clear business case defined
Pilot Deployment Limited section rollout, workflow refinement, integration testing Measurable accuracy improvement
Full Integration API connections to POS & ERP, staff training, network setup Unified operational intelligence
Optimization KPI tracking, threshold adjustment, continuous feedback Reduction in out-of-stock incidents

implementation guide for inventory accuracy

Integrating with Existing Systems and IoT Connectivity

Seamless connection to your existing tech stack is non-negotiable. API links to inventory management and point-of-sale platforms create a single source of truth.

The IoT architecture decides how data moves. Cloud-based options offer scalability, while edge computing reduces latency.

“Integration is where data turns into actionable insight. It bridges the gap between the physical shelf and the digital ledger.”

Strong cybersecurity measures protect this valuable data stream. This ensures business continuity and customer trust.

This holistic approach transforms operations. It turns real-time shelf data into a powerful tool for growth.

Utilizing Data Analytics and Insights to Enhance Retail Operations

Analytics platforms turn raw sensor data from store fixtures into strategic insights for boosting sales and service. This intelligence moves beyond simple stock counts.

It reveals detailed patterns in consumer behavior and product performance. Retailers gain a powerful tool for decision-making.

Tracking Customer Behavior and Optimizing Store Layouts

Heat maps show where shoppers linger and which items they pick up. Dwell time analysis indicates engagement levels.

This data directly informs planogram redesign. High-margin goods can be placed in premium, high-traffic zones.

Complementary product adjacencies are tested and refined. The result is a layout that guides the shopper journey and increases basket size.

data analytics retail operations

Improving Operational Efficiency with Real-Time Data

Live inventory feeds enable just-in-time restocking. This minimizes backroom stock and wasted labor.

Staff schedules align with predicted peak restocking needs. Automated alerts replace manual shelf checks.

This streamlines operations and cuts costs. Capital is not tied up in excess stock.

Dynamic Pricing and Promotional Strategies

Digital price tags can update instantly based on algorithms. Prices adjust for demand, time of day, or competitor actions.

Promotions are tested in real-time. Their effectiveness is measured by immediate sales velocity.

This agile approach maximizes revenue per product. It turns pricing into a dynamic brand strategy.

Conclusion

Forward-thinking retailers are turning to intelligent store fixtures to secure their future in a competitive market. This technology directly tackles the costly problem of inventory mismatches. It prevents lost sales and protects customer relationships.

Real-time monitoring eliminates stockouts and optimizes staff labor. Shoppers enjoy a better experience with consistent product availability. These multi-layered benefits create a strong value proposition for any store.

The move to data-driven operations is now a strategic necessity. Begin with a pilot program in a single location. Then, expand and optimize using advanced analytics.

Success requires commitment to training and system integration. Looking ahead, these connected smart shelves will evolve with AI and predictive tools. They form the foundation for a truly responsive retail environment.

FAQ

How does a Smart Retail Shelf solution directly prevent lost sales?

It prevents lost sales by providing real-time visibility into stock levels. When an item is out of place or low, the system instantly alerts staff for restocking. This ensures customers always find what they need, directly converting browsing into purchases and protecting revenue.

What are the core technologies powering these intelligent store displays?

The core technologies include weight sensors, RFID tags, and small cameras. RFID allows for precise, bulk item tracking without line-of-sight. Sensors detect when products are removed, while digital labels update prices instantly. This ecosystem works together to create a live view of merchandise.

Is implementing this technology disruptive to a store’s current operations?

Not typically. Modern solutions are designed for seamless integration. They connect with existing inventory management and point-of-sale systems. Implementation is often a phased process, starting with high-value aisles, minimizing downtime and allowing staff to adapt smoothly to the new workflow.

Beyond stock control, what other benefits do these systems offer?

They generate powerful analytics on consumer behavior. Retailers like Walmart gain insights into which items are frequently handled together or which displays attract attention. This data informs better store layouts, dynamic promotional strategies, and optimized product placements to boost overall performance.

How does this technology improve the shopper’s in-store experience?

It creates a frictionless journey. Accurate stock means no disappointment. Digital labels ensure correct pricing. For associates, the system frees them from manual counts, allowing more time for customer service. This leads to a more efficient, satisfying, and modern shopping trip.


How Iottive Delivers End-to-End Smart Retail Solutions

1. Retail Strategy & Solution Design

Iottive collaborates with retail leaders, digital heads, store operations teams, and supply chain stakeholders to understand customer journeys, inventory challenges, and growth objectives. This phase includes retail use-case validation, omnichannel architecture design, IoT device selection, AI personalization planning, and defining measurable KPIs such as promotion ROI, stock accuracy, and conversion rates.


2. Smart Systems Engineering & Retail Integration

Iottive engineers scalable Smart Retail solutions by integrating IoT sensors, RFID, smart shelves, digital mirrors, edge devices, and cloud platforms. We ensure seamless connectivity between POS systems, ERP, CRM, warehouse systems, and e-commerce platforms. The focus is on real-time visibility, secure data flow, and unified customer and inventory intelligence across stores and digital channels.


3. Pilot Deployment in Stores & Warehouses

Before enterprise rollout, Iottive deploys pilot solutions in selected retail stores, warehouses, or pharmacy locations. This includes testing AI-driven recommendations, smart inventory tracking, cold chain monitoring systems, and digital try-on experiences. Retailers can validate performance, customer engagement impact, and operational feasibility in live environments before scaling across locations.


4. Customer Experience & Retail Intelligence

Iottive builds intuitive dashboards and retail intelligence platforms that provide real-time insights into:

  • Customer behavior & segmentation
  • Promotion performance & ROI
  • Store-level inventory accuracy
  • Warehouse efficiency metrics
  • Cold chain compliance tracking
  • Online conversion and upsell analytics

Advanced analytics, alerts, and AI-driven insights empower retail teams to make faster, data-driven decisions that improve revenue, reduce losses, and enhance customer satisfaction.


5. Enterprise Rollout & Retail Scale-Up

From MVP to multi-location deployment, Iottive supports solution hardening, cloud scalability, cybersecurity, and long-term support. Smart Retail solutions are designed for:

  • Multi-store expansion
  • Omnichannel integration
  • Regional inventory balancing
  • Cross-border retail operations
  • Continuous optimization using AI insights

Our approach ensures measurable ROI through improved customer engagement, reduced shrinkage, better inventory control, and operational efficiency.


Why Retailers Choose Iottive

  • Proven expertise in Smart Retail & IoT-driven transformation
  • Deep understanding of store operations, warehousing, and pharmacy compliance
  • Seamless integration with POS, ERP, CRM, and e-commerce platforms
  • Secure, scalable, and production-ready retail architectures
  • Strong focus on measurable business outcomes — not just technology

📧 Contact Email: sales@iottive.com

Early detection of motor & bearing failures to avoid unplanned downtime

Sudden equipment breakdowns bring production lines to a halt. For manufacturing leaders, these events represent a major threat to profitability and operational stability. The financial impact is staggering. Unplanned downtime costs Fortune Global 500 companies an estimated 11% of their yearly turnover.

early detection of motor and bearing failures

Motor and bearing failures are a primary cause of these costly disruptions. Traditional maintenance schedules often miss subtle signs of wear. This leaves facilities vulnerable to sudden equipment failures.

Implementing an early detection strategy is the solution. By monitoring key indicators like vibration and temperature, plants can identify problems before they escalate. This proactive approach protects production continuity and saves significant resources.

This guide provides a clear framework for building a robust detection system. It empowers maintenance teams to move from reactive fixes to proactive prevention. The goal is to safeguard your operations and financial health.

Key Takeaways

  • Unplanned downtime has a massive financial impact on industrial operations.
  • Motor and bearing issues are leading causes of sudden production stoppages.
  • Traditional maintenance methods frequently fail to catch early warning signs.
  • Proactive monitoring of equipment health is essential for preventing failures.
  • Early detection systems help maintain consistent production schedules.
  • Investing in predictive strategies protects revenue and reduces operational costs.

Overview of Unplanned Downtime in Manufacturing

When equipment ceases functioning without warning, manufacturing output suffers dramatically. These unexpected interruptions disrupt carefully planned schedules and create immediate operational challenges. Understanding this phenomenon is essential for effective facility management.

Defining Unplanned Downtime

Unplanned downtime refers to sudden equipment stoppages without prior indication. These events force immediate maintenance response and disrupt scheduled operations.

Key metrics help quantify these incidents. Mean Time Between Failures (MTBF) measures average operational duration between breakdowns. Mean Time to Repair (MTTR) tracks how quickly teams restore normal operations.

manufacturing downtime overview

Common Causes in Modern Plants

Various factors contribute to operational stoppages in contemporary facilities. Mechanical component failures represent frequent triggers. Electrical and control system issues also create significant disruptions.

“The most costly production interruptions often stem from seemingly minor component degradations that go undetected until catastrophic failure occurs.”

Modern plants face diverse challenges. Equipment age, maintenance practices, and operator training levels all influence downtime frequency. Sophisticated monitoring systems can significantly reduce these incidents.

Cause Category Specific Examples Frequency Rating Impact Level
Mechanical Failures Motor breakdowns, bearing wear High Severe
Electrical Issues Drive malfunctions, power surges Medium Moderate
Control Systems Software crashes, controller errors Medium High
Human Factors Operator mistakes, setup errors Low Variable
Supply Chain Material shortages, vendor delays Low Significant

Tracking frequency and duration provides quantitative baselines for improvement. This data enables realistic reduction targets and measures intervention effectiveness.

The Impact of Downtime on Production and Costs

The economic toll of production interruptions extends far beyond the factory floor. These events create immediate financial consequences that ripple throughout organizations. Major industrial players face staggering losses from operational stoppages.

downtime impact on production costs

Financial Implications and Lost Productivity

Fortune Global 500 companies collectively lose approximately $1.5 trillion annually to equipment stoppages. This represents 11% of their total yearly turnover. The scale of this financial impact demands serious attention from business leaders.

Every minute of operational halt generates multiple cost streams. Wasted labor hours, material spoilage, and emergency repairs add up quickly. Interconnected production lines experience cascading inefficiencies that amplify losses.

Overall Equipment Effectiveness scores decline dramatically during these events. The availability component drops immediately when equipment stops unexpectedly. This pulls down composite efficiency metrics even after operations resume.

Customer relationships suffer measurable damage when delivery commitments fail. Contractual penalties and expedited shipping costs further increase financial burdens. The total cost must account for both direct expenses and indirect impacts on market competitiveness.

Understanding Critical Metrics: MTBF, MTTR, and OEE

Three fundamental indicators offer comprehensive insight into machinery reliability and plant productivity. These metrics transform subjective observations into objective data for maintenance teams.

Interpreting MTBF and MTTR

Mean Time Between Failures calculates average operational duration between breakdowns. Higher values indicate more reliable equipment requiring less frequent intervention.

Mean Time to Repair measures how quickly teams restore operations after failures occur. Shorter repair time reflects efficient maintenance processes and skilled personnel.

critical metrics MTBF MTTR OEE

Role of OEE in Performance Tracking

Overall Equipment Effectiveness combines availability, speed efficiency, and quality output into one percentage. This composite metric reveals true equipment performance beyond simple uptime measurements.

Modern monitoring systems automate OEE calculations through sensor integration. They eliminate manual errors and provide real-time visibility into improvement opportunities.

Metric Purpose Ideal Value Impact Area
MTBF Equipment reliability High Failure frequency
MTTR Repair efficiency Low Downtime duration
OEE Overall performance >85% Productivity quality

Tracking these metrics establishes baselines for continuous improvement. They help justify investments in predictive maintenance technologies.

Early Detection of Motor and Bearing Failures

Continuous data collection from rotating equipment provides unprecedented visibility into the health and performance of critical machinery. Modern monitoring systems capture subtle changes that signal developing problems.

Signs of Wear and Degradation

Effective failure prevention relies on identifying early warning signals. Multiple monitoring techniques work together to detect different types of equipment issues.

early detection of motor and bearing failures

Vibration analysis remains the most established method for detecting bearing wear. Healthy equipment shows consistent patterns while degrading components produce erratic signatures.

Temperature monitoring provides critical warnings for motor winding deterioration. Friction from worn surfaces generates measurable heat increases before visible damage occurs.

Acoustic emission sensors detect ultrasonic frequencies from material stress. This technology captures failure precursors invisible to conventional methods.

Monitoring Method Parameters Measured Early Detection Capability Primary Applications
Vibration Analysis Frequency patterns, amplitude Weeks to months Bearings, imbalance, misalignment
Temperature Monitoring Heat generation, thermal patterns Days to weeks Motor windings, lubrication issues
Acoustic Emissions Ultrasonic frequencies, sound waves Months in advance Material stress, friction events
Current Signature Electrical waveform distortions Weeks to months Motor winding imbalances, rotor defects
Lubrication Analysis Contaminants, viscosity changes Months in advance Bearing wear, system contamination

IoT-enabled systems continuously collect multi-parameter data from strategically positioned sensors. This comprehensive approach enables maintenance teams to address developing issues during planned service windows.

Avoid Unplanned Downtime with Smart Manufacturing

Modern industrial facilities are embracing intelligent technologies to transform their maintenance approaches. These advanced systems create a proactive environment where potential issues are identified long before they cause disruptions.

smart manufacturing systems

Connected sensor networks collect comprehensive operational data from equipment throughout the facility. Advanced analytics platforms process this information to detect subtle patterns indicating developing problems. This enables maintenance teams to schedule interventions during planned windows.

Digital twin technology creates virtual replicas of physical assets. Engineers can run simulations to understand how equipment behaves under different conditions. This predictive capability helps optimize operations and prevent unexpected failures.

Technology Component Primary Function Key Benefit
IoT Sensors Continuous equipment monitoring Real-time health assessment
Predictive Analytics Pattern recognition and forecasting Early failure detection
Digital Twins Virtual simulation and testing Risk-free scenario analysis
AI Diagnostics Automated problem identification Rapid response capability

Facilities implementing these integrated systems consistently report significant reductions in operational stoppages. The investment typically delivers measurable returns within months rather than years. This technological transformation represents a fundamental shift toward more reliable operations.

Root Cause Analysis Techniques for Failure Detection

Systematic investigation of equipment failures moves beyond simple repairs to address core problems. These analytical processes transform maintenance from reactive fixes to permanent solutions. They identify underlying causes that traditional methods often miss.

Effective analysis requires structured approaches and comprehensive data collection. Maintenance teams must document failure conditions, operating parameters, and historical patterns. This evidence-based methodology ensures accurate problem identification.

Using the 5 Whys Method

The 5 Whys technique employs iterative questioning to trace failures to their source. Teams ask “why” repeatedly until reaching fundamental issues. This simple yet powerful method reveals process gaps and system weaknesses.

For example, a bearing failure might trace back to inadequate lubrication procedures. The technique exposes hidden causes that enable failure sequences. It prevents temporary solutions that allow problems to recur.

Fishbone Diagrams and Pareto Analysis

Fishbone diagrams organize potential failure sources into categories like equipment, processes, and environment. This visual tool helps teams evaluate all contributing factors systematically. It pinpoints the most probable root causes efficiently.

Pareto analysis applies the 80/20 principle to failure data. It reveals that most production losses stem from a handful of critical issues. This prioritization helps focus resources on high-impact improvement strategies.

Analysis Technique Primary Focus Investigation Depth Team Collaboration
5 Whys Method Causal chain tracing Fundamental root causes Small team discussions
Fishbone Diagrams Category-based analysis Multiple factor evaluation Cross-functional teams
Pareto Analysis Impact prioritization Statistical pattern recognition Data analysis specialists

“Organizations that standardize root cause analysis build historical databases that reveal systemic improvement opportunities across multiple incidents.”

Implementing these techniques creates a culture of continuous improvement. Teams shift from addressing symptoms to eliminating fundamental issues. This progressive approach reduces operational disruptions significantly.

Implementing Predictive and Preventive Maintenance Strategies

Strategic maintenance planning combines traditional preventive methods with advanced predictive technologies for optimal results. These approaches work together to protect critical assets and maximize operational efficiency.

Benefits of Predictive Maintenance

Predictive maintenance represents a significant advancement over traditional approaches. It uses sensor data and analytics to forecast equipment issues before they cause disruptions.

This methodology reduces maintenance costs by eliminating unnecessary tasks. It also extends equipment lifespan through timely interventions. The system detects subtle changes in vibration, temperature, and performance patterns.

Scheduling Effective Preventive Tasks

Preventive maintenance establishes regular service schedules based on time or usage. These strategies perform routine inspections and component replacements before failures occur.

Computerized Maintenance Management Systems (CMMS) automate scheduling and tracking. They ensure technicians complete tasks on time and maintain proper documentation. This systematic approach prevents overlooked maintenance and improves accountability.

Hybrid strategies balance both methodologies for comprehensive coverage. They apply predictive monitoring to critical assets while maintaining cost-effective preventive schedules for secondary equipment.

Leveraging Data Analytics and IoT for Real-Time Monitoring

The convergence of data analytics and Internet of Things technologies creates unprecedented opportunities for continuous equipment surveillance. These advanced systems transform raw operational information into actionable intelligence for maintenance teams.

Integrating PLC, SCADA, and Sensor Data

Unified monitoring ecosystems combine information from multiple sources. Programmable Logic Controller readings provide machine control data. Supervisory Control and Data Acquisition outputs deliver process supervision details.

IoT sensor networks capture vibration, temperature, and electrical parameters continuously. This integration creates comprehensive equipment health profiles. It eliminates visibility gaps inherent in manual collection methods.

Predictive analytics algorithms process historical failure patterns alongside current conditions. They forecast equipment degradation trajectories with remarkable accuracy. This enables optimized maintenance scheduling and spare parts preparation.

Real-time monitoring capabilities detect developing problems within minutes. Automated alert systems notify personnel when parameters exceed normal ranges. Rapid response intercepts failure progressions before they escalate.

Manufacturing analytics dashboards aggregate diverse data streams into unified visual interfaces. They display real-time OEE metrics and equipment status indicators. Plant managers gain comprehensive operational awareness for informed decision-making.

Organizations report measurable improvements from these systems. They achieve significant reductions in maintenance costs and enhanced ability to meet production commitments. The investment typically delivers rapid returns through improved operational efficiency.

Digital Twins and Simulation for Equipment Reliability

Advanced digital modeling techniques provide unprecedented predictive capabilities for industrial equipment maintenance. These virtual systems create dynamic representations that mirror physical assets in real-time.

Digital twins integrate live sensor information and operational parameters to build accurate models. This enables comprehensive analysis without interrupting production workflows.

Virtual Replicas to Anticipate Failures

Virtual replicas simulate how equipment behaves under different operating conditions. Engineers run what-if scenarios to understand stress patterns and potential failures.

Continuous monitoring data feeds into these digital models, creating living simulations. This allows maintenance teams to test interventions virtually before implementation.

The technology projects equipment degradation based on current wear rates. It identifies optimal maintenance timing before actual failures occur on production machines.

Real-time monitoring integration creates feedback loops that refine model accuracy. Simulation predictions get validated against actual equipment behavior, improving forecast precision.

Manufacturers using digital twins report enhanced maintenance planning for critical machines. The virtual environment reduces trial-and-error experimentation with physical equipment.

Optimizing Inventory and Spare Parts Management

Strategic inventory control directly determines how quickly facilities can respond to unexpected equipment malfunctions. Proper spare parts availability prevents extended production halts caused by procurement delays.

Effective inventory management balances immediate availability against capital investment. This approach ensures critical components are ready when needed.

Vendor-Managed Inventory Solutions

Vendor-managed inventory programs transfer stock monitoring responsibilities to suppliers. Partners maintain agreed levels at customer facilities, reducing administrative burdens.

This collaboration ensures rapid part delivery during critical maintenance events. It streamlines the entire supply chain process.

Regular Audits to Ensure Readiness

Scheduled inventory audits verify physical stock matches system records. They assess part condition and validate shelf-life specifications.

Regular checks confirm proper organization for emergency retrieval. This systematic approach builds maintenance team confidence in parts availability.

Inventory Approach Primary Benefit Implementation Complexity Cost Impact
Vendor-Managed Reduced administrative burden Medium Lower carrying costs
Criticality-Based Focused resource allocation Low Optimized capital use
Predictive Integration Proactive part preparation High Reduced safety stock
Regular Audit System Accuracy verification Low Minimal additional cost

Plant managers report significant improvements from optimized spare parts strategies. These include reduced downtime delays and improved operational confidence.

Enhancing Workforce Training and Cross-Department Collaboration

Technical expertise and collaborative communication form the foundation of effective equipment management. A well-trained workforce represents the most valuable asset for maintaining operational continuity. Plant managers must ensure comprehensive skill development across all operational roles.

Improving Technical Skills and Communication

Targeted training programs build essential competencies for equipment operation and failure recognition. Maintenance teams gain the ability to identify developing issues during routine inspections. This knowledge empowers technicians to perform accurate first-level diagnostics.

Cross-functional collaboration breaks down organizational barriers that hinder rapid response. Establishing clear communication channels between departments improves coordination. These processes ensure critical equipment issues receive immediate attention.

Regular review meetings allow teams to analyze recent equipment events collectively. This collaborative approach enhances decision-making efficiency across the organization. Shared learning prevents recurrence of similar problems.

Investing in workforce development delivers measurable returns through improved response times. Enhanced technical skills reduce dependence on external specialists. Organizations fostering integrated teamwork achieve superior reliability outcomes.

Integrating Systems for Seamless Operations

Modern production facilities achieve peak operational efficiency through seamless integration of their core business systems. This connectivity transforms isolated software applications into unified digital ecosystems that drive continuous improvement.

Enterprise Resource Planning (ERP) and Enterprise Asset Management (EAM) platforms form the foundation of this integrated approach. When connected with monitoring software, they create automated workflows that enhance equipment reliability.

Connecting ERP, EAM, and Monitoring Platforms

These integrated systems automatically generate work orders when sensors detect abnormal equipment conditions. The software routes requests through approval workflows without manual intervention.

This connectivity provides real-time visibility across all departments. Maintenance teams receive immediate alerts when performance metrics deviate from normal ranges. The unified platform ensures everyone operates with current, consistent information.

Closed-loop feedback mechanisms capture repair details and completion times. This valuable data flows back to analytics modules for continuous learning. The integrated approach eliminates information silos that hinder effective maintenance.

Organizations report significant benefits from this connectivity. They achieve faster response times and reduced administrative burdens. The unified platform approach creates an environment where maintenance excellence becomes sustainable.

Conclusion

Forward-thinking organizations recognize that equipment reliability forms the cornerstone of sustainable production success. This strategic focus transforms maintenance from reactive fixes to proactive prevention.

The comprehensive approach integrates continuous monitoring, predictive analytics, and systematic maintenance processes. Cross-functional collaboration and workforce development strengthen this foundation.

Organizations implementing these strategies achieve measurable improvements in operational performance. They typically see significant gains in equipment effectiveness and production quality within months.

Building resilient operations requires persistent commitment to data-driven decisions and continuous improvement. This journey positions manufacturers for long-term competitiveness and growth.

FAQ

What is the primary goal of predictive maintenance in a manufacturing setting?

The main objective is to forecast equipment failures before they occur. This proactive approach uses data analytics and real-time monitoring to schedule maintenance. It directly prevents disruptive stoppages and protects production schedules.
 

How do metrics like OEE and MTTR help managers improve performance?

Overall Equipment Effectiveness (OEE) measures how well a machine operates during planned production time. Mean Time To Repair (MTTR) tracks the average duration of equipment fixes. Analyzing these metrics highlights inefficiencies and guides maintenance teams to boost productivity.
 

What role does sensor data play in avoiding machine breakdowns?

Sensors on critical equipment, like motors and bearings, continuously collect data on vibration, temperature, and performance. This information feeds into analytics platforms that detect early signs of wear. It allows for timely intervention, preventing minor issues from escalating into major failures.
 

Can integrating different software systems reduce operational downtime?

Yes. Connecting Enterprise Resource Planning (ERP) and Enterprise Asset Management (EAM) systems with monitoring platforms creates a unified view. This integration streamlines workflows, improves spare parts management, and enables faster, data-driven decisions to maintain seamless operations.


What is a digital twin and how does it enhance equipment reliability?

A digital twin is a virtual replica of a physical asset or process. It uses simulation and real-time data to model equipment behavior under various conditions. This allows manufacturers to anticipate failures, test solutions, and optimize maintenance strategies without risking actual production.


How Iottive Delivers End-to-End IIoT Solutions

1. Concept & Solution Design

Iottive works closely with plant teams, engineering leaders, and stakeholders to understand operational challenges, asset behavior, and production goals. This phase includes use-case validation, system architecture design, sensor selection, connectivity planning, and defining measurable business outcomes.


2. Engineering & System Integration

Iottive engineers industrial-grade IIoT solutions by integrating sensors, PLCs, SCADA systems, gateways, and industrial protocols such as OPC UA, Modbus, MQTT, and BLE. The focus is on reliable data acquisition, secure communication, and seamless integration with existing automation infrastructure.


3. Prototyping & Pilot Deployment

Rapid prototyping enables manufacturers to validate concepts on the shop floor before full-scale rollout. Iottive develops functional prototypes, edge analytics, dashboards, and mobile applications to test performance, data accuracy, and operational feasibility in real manufacturing environments.


4. Product Experience & Data Intelligence

Iottive designs intuitive web and mobile dashboards that provide real-time visibility into machine health, production metrics, and operational KPIs. Advanced analytics, alerts, and visualization tools empower plant teams to take proactive, data-driven decisions with minimal complexity.


5. Commercialization & Scale-Up

From MVP to enterprise deployment, Iottive supports product hardening, scalability, cloud or hybrid deployments, and long-term maintenance. Solutions are designed for multi-plant rollout, system expansion, and continuous optimization—ensuring measurable ROI and operational impact.


Why Manufacturers Choose Iottive

  • Proven experience in Industrial Automation & IIoT
  • Strong understanding of real shop-floor challenges
  • Seamless integration with existing PLC/SCADA systems
  • Scalable, secure, and production-ready architectures
  • Focus on business outcomes, not just technology

📧 Contact Email: sales@iottive.com

Detect Critical Asset Failures Early Using Condition-Based IoT Maintenance

Industrial machinery breakdowns strike without warning. This causes massive production halts and expensive repairs. Manual checks and scheduled upkeep often miss the subtle signs of a problem developing deep within a machine.

condition based maintenance IoT

Unplanned stoppages are a huge financial burden. A medium-sized operation can lose around $125,000 for every hour of downtime. For heavy industries, the yearly cost of unexpected outages reached a staggering $59 million in 2023. The losses from a single breakdown can be three to nine times higher than the repair bill itself.

There is a smarter way to manage machinery. A new approach uses networks of sensors to constantly watch over equipment. These sensors track things like vibration, heat, and power use. They send real-time information to central systems.

This data reveals hidden degradation patterns. It allows teams to spot abnormal behavior long before a complete breakdown happens. This shifts the strategy from reactive fixes to proactive health management. Critical issues can be identified weeks or even months in advance.

This guide explores how to implement these modern strategies. They help reduce unplanned stoppages, extend machine life, and make maintenance spending more efficient. Leading providers like Iottive deliver complete solutions that turn maintenance from a cost center into a strategic advantage.

Key Takeaways

  • Unplanned equipment downtime costs companies hundreds of thousands of dollars per hour, making early detection systems crucial.
  • Traditional time-based maintenance schedules often fail to catch early signs of internal machine degradation.
  • Modern sensor technology enables continuous, real-time monitoring of critical performance parameters.
  • Shifting from reactive repairs to proactive management allows issues to be identified weeks or months in advance.
  • This data-driven approach optimizes repair schedules, extends equipment lifespan, and reduces overall costs.
  • Industries with high-value machinery and significant downtime risks are rapidly adopting these solutions.
  • Implementing a strategic monitoring program can transform maintenance operations into a competitive advantage.

Introduction: The Future of Maintenance Strategies

Operational reliability has become the cornerstone of competitive manufacturing in today’s demanding industrial environment. Traditional approaches to equipment care are no longer sufficient for modern production requirements.

predictive maintenance

Industry Challenges and the Need for Proactive Solutions

Manufacturing facilities face unprecedented pressures. Aging infrastructure combines with skilled labor shortages and intensifying production targets. This creates critical reliability challenges that threaten operational continuity.

Unplanned downtime represents the single most expensive problem for industrial operations. The financial impact extends far beyond direct repair expenses. Lost production, damaged materials, and overtime premiums multiply the total cost burden.

How Predictive Maintenance Transforms Operations

This modern approach fundamentally changes the maintenance equation. Organizations can detect developing issues during the extended period between normal operation and complete breakdown. Intervention becomes possible when costs remain minimal and scheduling flexibility maximizes.

Companies implementing comprehensive programs report significant benefits. Maintenance cost reductions of 5-15% are typical. Downtime decreases of 30-50% demonstrate the powerful impact on operational efficiency. This represents not just technological upgrade but fundamental philosophy change.

Asset Failure Prediction, Condition Based Maintenance IoT

The evolution of industrial technology has enabled unprecedented visibility into equipment health and performance. Sophisticated monitoring systems now provide continuous insight into machinery operations.

predictive maintenance monitoring system

These intelligent networks embed sensors directly into critical machinery components. They measure vital parameters like temperature, vibration, and pressure in real time. This creates a comprehensive view of operational status.

The collected information flows through wireless networks to analytics platforms. These systems establish baseline performance patterns for each piece of equipment. They then identify deviations that signal potential issues.

Aspect Traditional Approach Modern Predictive System
Data Collection Manual, periodic checks Continuous, automated monitoring
Maintenance Trigger Fixed schedules or breakdowns Actual equipment condition data
Intervention Timing Reactive or predetermined Proactive based on early warnings
Cost Efficiency Higher waste and downtime Optimized spending and availability

When algorithms detect unusual patterns, maintenance teams receive specific alerts. This approach combines the reliability of preventive strategies with the efficiency of data-driven decisions. The result is maximum equipment availability with minimal spending.

Modern implementations use edge computing for local data processing. This reduces bandwidth needs while enabling immediate response to critical situations. The technology has become economically viable across various equipment types.

Understanding IoT Sensors and Their Role in Predictive Maintenance

Sophisticated detection devices form the backbone of modern equipment health monitoring strategies. These intelligent components continuously gather vital information about machinery operations.

iot sensors for equipment monitoring

Various sensing technologies work together to provide comprehensive oversight. Each type captures specific parameters that indicate potential issues.

Types of Sensors and Their Applications

Vibration sensors detect unusual movement patterns in rotating machinery. They identify imbalances, misalignments, and bearing wear through precise measurement.

Temperature monitoring devices track heat generation in critical components. Thermal sensors spot overheating from friction or electrical problems before damage occurs.

Pressure transducers monitor hydraulic and pneumatic systems for leaks or blockages. They ensure fluid systems operate within safe parameters.

Sensor Type Primary Measurement Key Applications
Vibration Sensors Oscillation patterns and frequency Rotating equipment, motors, pumps
Temperature Sensors Heat levels and thermal changes Bearings, electrical components, engines
Pressure Transducers Fluid and gas pressure levels Hydraulic systems, compressors, pipelines
Acoustic Sensors Sound frequency and amplitude Leak detection, mechanical wear

Current sensors measure electrical consumption patterns for motor health. Acoustic devices listen for abnormal sounds indicating mechanical problems.

These detection systems provide the foundation for informed decision-making. They transform random checks into systematic, data-driven oversight.

Leveraging Machine Learning and Real-Time Data Analytics

Advanced computational systems are revolutionizing how organizations process equipment information streams. These intelligent platforms transform raw measurements into actionable operational intelligence.

machine learning algorithms

Two primary analytical approaches dominate modern implementations. Rule-based systems establish clear threshold conditions derived from engineering specifications. Machine learning algorithms identify complex patterns that human analysis cannot detect.

AI and ML Algorithms Driving Predictive Models

Supervised learning models train on historical information showing equipment behavior before known issues. They learn to recognize degradation signatures that enable early intervention.

Unsupervised learning establishes normal operating patterns through analysis of healthy equipment data. This approach identifies anomalous conditions without requiring labeled examples.

Three distinct methodologies provide comprehensive oversight:

  • Indirect health estimation using known requirements and historical patterns
  • Anomaly detection identifying real-time deviations from normal conditions
  • Remaining useful life forecasting predicting time until intervention needed

Real-time data analytics platforms aggregate information from multiple sources. They combine continuous measurement streams with operational context for accurate forecasting.

Advanced implementations employ ensemble methods combining multiple algorithms. This leverages strengths of different approaches while compensating for individual limitations.

Continuous model refinement ensures predictive accuracy improves over time. Organizations report significant accuracy gains as algorithms learn equipment-specific patterns.

Integrating Predictive Maintenance into Management Systems

Connecting sensor intelligence with enterprise software creates a closed-loop system that transforms data into action. This seamless connection between detection technology and operational platforms represents the final step in digital transformation.

computerized maintenance management

Effective implementation requires careful planning around system integration and workflow automation. These elements ensure that insights become operational improvements.

Best Practices for Seamless CMMS Integration

Successful connection between predictive analytics and computerized maintenance management systems demands strategic planning. Establish clear data exchange protocols that enable bidirectional information flow.

These protocols allow predictive platforms to receive equipment specifications and operational context. In return, they deliver condition assessments and specific repair recommendations. This creates a comprehensive view across all management systems.

Enhancing Workflow Automation with IoT Data

Automated work orders generation represents the most significant operational improvement. When sensors detect abnormal patterns, the system automatically creates detailed repair tickets.

These intelligent work orders specify which components need attention and recommended actions. They also include required parts and optimal timing based on production schedules. This automation transforms upkeep from reactive troubleshooting to proactive execution.

The integration extends value through connections with inventory and production systems. This ensures parts availability and minimizes operational disruption during repairs.

Comparing Preventive, Predictive, and Condition-Based Maintenance Approaches

The landscape of industrial equipment care spans three distinct strategic pathways. Each methodology offers different benefits and suits specific operational needs. Understanding these differences helps organizations select the optimal strategy.

Preventive maintenance operates on fixed schedules. Teams perform inspections and replacements based on time intervals or usage metrics. This approach provides reliability but can waste resources on healthy equipment.

Key Differences and Strategic Implications

Predictive maintenance uses sensor data and analytics to forecast needs. It schedules work only when data indicates impending issues. This maximizes efficiency but requires advanced infrastructure.

Condition-based strategies trigger interventions when parameters exceed thresholds. They react to real-time measurements without forecasting capability. This eliminates unnecessary work while maintaining vigilance.

Strategy Trigger Mechanism Resource Efficiency Implementation Complexity
Preventive Fixed schedules Lower – may maintain healthy assets Basic – scheduling systems only
Condition-Based Real-time threshold alerts Medium – eliminates most unnecessary work Moderate – adds sensor networks
Predictive Analytical failure forecasts High – intervenes only when needed Advanced – requires full IoT and analytics

The strategic implications are profound. Organizations typically begin with preventive programs for non-critical equipment. They advance to condition-based monitoring for moderately critical assets. Predictive strategies deliver maximum value for high-cost downtime scenarios.

Implementation complexity escalates across this spectrum. Each approach represents a different maturity level in operational excellence. The choice depends on equipment criticality and organizational readiness.

Implementing Condition-Based Maintenance in Industrial Operations

Implementing modern oversight strategies requires careful planning and precise execution. Organizations must follow a structured approach to achieve maximum benefits from their investment.

The process begins with identifying machinery where breakdowns would cause significant disruption. Teams prioritize units based on safety impact, production importance, and repair complexity.

Establishing performance baselines forms the crucial foundation. This involves documenting normal operating parameters during healthy periods. These reference points enable accurate anomaly detection later.

Essential Sensor Technologies for Early Failure Detection

Selecting appropriate detection devices depends on equipment characteristics and dominant issues. Different technologies capture specific parameters that signal potential problems.

Vibration monitoring suits rotating machinery like motors and pumps. Thermal sensors track heat generation in electrical components. Pressure transducers monitor hydraulic systems for leaks or blockages.

Implementation Phase Primary Activities Key Outcomes
Foundation Building Asset prioritization, baseline establishment Clear focus areas, performance benchmarks
Technology Deployment Sensor selection, proper installation Continuous data collection capability
System Integration Dashboard setup, threshold configuration Real-time visibility, automated alerts

Real-Time Monitoring and Immediate Response

Modern systems provide instant visibility into machinery health through centralized dashboards. Teams can track multiple parameters simultaneously across different locations.

Setting appropriate thresholds defines when action becomes necessary. These boundaries separate normal operation from conditions requiring intervention. Proper configuration prevents unnecessary alerts while ensuring critical issues receive attention.

Immediate response protocols ensure rapid action when thresholds are exceeded. Automated alerts notify appropriate personnel with specific details. This enables quick decision-making and minimizes disruption.

Optimizing Equipment Reliability and Reducing Downtime

Real-world implementations showcase measurable gains in operational efficiency through advanced monitoring systems. Companies adopting these approaches report substantial improvements across multiple performance dimensions.

Case Studies: Cost Savings and Uptime Improvement

Documented results reveal consistent patterns of improvement. Organizations achieve downtime reductions of 30-50% through early detection capabilities. This prevents catastrophic breakdowns that disrupt production schedules.

Financial benefits extend beyond availability improvements. Companies report direct cost savings of 5-15% by eliminating unnecessary interventions. Emergency repairs typically cost two to three times more than planned work.

Benefit Category Typical Improvement Operational Impact
Equipment Availability 30-50% downtime reduction Increased production capacity
Cost Efficiency 5-15% direct savings Better budget allocation
Component Lifespan 20-40% extension Reduced replacement frequency
Labor Productivity 10-25% improvement More effective workforce

These comprehensive improvements transform operational performance. The approach delivers rapid return on investment while building sustainable competitive advantages.

Advanced Predictive Models: From Data Collection to Actionable Insights

Modern computational methods elevate continuous monitoring streams into strategic decision-making tools. These sophisticated approaches transform raw measurements into precise operational intelligence.

Time-series analysis tracks how operational parameters evolve across equipment usage cycles. This methodology identifies subtle degradation patterns by monitoring temperature trends, vibration changes, and power consumption shifts.

Probability-based models provide nuanced risk assessment for different operational scenarios. They enable planners to balance intervention costs against potential disruption impacts.

Data fusion techniques combine information from multiple sensor types monitoring the same machinery. This creates comprehensive condition assessments more accurate than any single measurement approach.

Cloud analytics platforms aggregate sensor streams with contextual information from enterprise systems. They incorporate operational history and production schedules into predictive models.

Scalable infrastructure handles massive volumes generated by continuous oversight across equipment populations. Specialized databases optimize storage and retrieval of measurement streams.

Validation methodologies ensure forecast accuracy through comparison against actual outcomes. Continuous refinement based on completed interventions improves model precision over time.

These advanced approaches generate clear maintenance recommendations specifying required actions and optimal timing. They transform complex analytical outputs into practical operational insights.

Best Practices for Sustainable Maintenance Management

Organizations must establish governance structures to ensure long-term success of their maintenance programs. Sustainable management requires clear frameworks defining roles and responsibilities.

Phased implementation helps manage initial investment effectively. Many companies begin with pilot programs monitoring 5-10 critical units. This approach proves value before expanding across broader equipment populations.

Future Trends in IoT and Predictive Analytics

Emerging technologies continue to transform maintenance strategies. Edge artificial intelligence enables sophisticated analysis directly on industrial gateways. Digital twin technology creates virtual models for scenario simulation.

Augmented reality systems overlay sensor data during repair execution. These innovations enhance technician effectiveness and decision-making capabilities.

Implementation Challenge Best Practice Solution Expected Outcome
Cultural resistance to change Transparent analytical methods and technician involvement Increased trust in data-driven predictions
Data quality concerns Regular calibration and validation procedures Consistent predictive accuracy
Cybersecurity risks Network segmentation and encrypted communications Protected industrial operations
Skills development needs Comprehensive training programs Effective alert interpretation

Change management addresses cultural resistance from teams accustomed to calendar schedules. Building trust in data-driven predictions requires transparency and early success celebrations.

Data quality assurance prevents sensor drift and measurement errors from compromising analytical outputs. Cybersecurity frameworks protect connected industrial networks from potential threats.

“The most successful maintenance programs balance technological innovation with organizational adaptation.”

Skills development ensures personnel can interpret predictive alerts effectively. Leadership teams must make strategic decisions based on condition data and risk assessments.

For organizations ready to implement comprehensive solutions, Iottive offers integrated platforms combining sensor technology and expert guidance.

Contact Us: sales@iottive.com or visit www.iottive.com to explore how advanced predictive maintenance can transform your operations.

Conclusion

Proactive equipment management has evolved from luxury to operational necessity. Organizations implementing predictive maintenance achieve dramatic improvements in uptime and cost control.

This approach prevents costly equipment failures by detecting issues weeks before breakdowns occur. The technology foundation has matured to deliver reliable results across industrial settings.

Success requires integrating advanced monitoring systems with organizational adaptation. Companies report 30-50% downtime reductions and significant equipment reliability gains.

The strategic choice between maintenance approaches depends on specific operational needs. Many organizations benefit from hybrid strategies tailored to their equipment portfolio.

To explore comprehensive solutions that transform your maintenance operations, Contact us for expert guidance can help implement effective predictive maintenance programs for your specific industrial applications.

FAQ

What is the primary advantage of condition-based maintenance over traditional preventive schedules?

The core benefit is intervention based on actual equipment health, not just time. This approach uses real-time data from IoT sensors to prevent unnecessary work and truly target impending issues, drastically cutting costs and unplanned downtime.

How do machine learning algorithms improve predictive models for industrial assets?

These learning algorithms analyze vast streams of data from monitoring systems, identifying subtle patterns that precede breakdowns. This allows for highly accurate forecasts of equipment failure, enabling proactive repairs before performance is impacted.

What role does vibration analysis play in modern maintenance management systems?

Vibration analysis is a critical diagnostic tool. By continuously monitoring vibration signatures, it detects anomalies like imbalance or bearing wear early. This data feeds into predictive models, triggering automated work orders to address faults before they cause major downtime.

Can predictive maintenance be integrated with existing computerized maintenance management software (CMMS)?

A> Absolutely. Seamless integration is a best practice. IoT sensor data and analytics insights can flow directly into platforms like IBM Maximo or SAP PM, automating alerts and work order creation for a unified, data-driven management system.

What is the key difference between preventive and predictive strategies in terms of cost?

Preventive maintenance operates on fixed schedules, often leading to parts being replaced while still functional—a hidden cost. Predictive methods, driven by actual condition monitoring, optimize part life and labor, delivering superior cost efficiency and asset reliability.
 

Contact Us: sales@iottive.com

Prevent Unplanned Machine Downtime Using IoT Predictive Maintenance

Unplanned machine downtime is a significant concern for manufacturers, with the potential to cost $260,000 for every hour of lost production, according to a report by Vanson Bourne. Moreover, a staggering 82% of manufacturers experience downtime at least once a year.

Machine downtime prediction, IoT predictive maintenance

The traditional preventive maintenance schedules often fail to detect real wear conditions, leading to unexpected failures. In contrast, IoT-based predictive maintenance integrates sensors with PLC and SCADA systems, enabling the continuous capture of critical data such as vibration, temperature, and current.

By leveraging advanced analytics, manufacturers can detect early failure patterns and receive alerts before breakdowns occur, ensuring a proactive approach to maintenance.

Key Takeaways

  • Unplanned machine downtime can cost manufacturers $260,000 per hour.
  • 82% of manufacturers experience machine downtime at least once a year.
  • IoT predictive maintenance offers a proactive approach to reducing downtime.
  • Advanced analytics enable early detection of potential failures.
  • Integration with PLC and SCADA systems enhances predictive maintenance capabilities.

The True Cost of Unplanned Machine Downtime in Manufacturing

The manufacturing sector faces substantial challenges due to unplanned machine downtime, affecting productivity and profitability. Unplanned downtime can lead to significant financial losses, not just from the immediate halt in production but also from the ripple effects it causes throughout the supply chain and the hidden costs associated with it.

Financial Impact on Production Facilities

Unplanned machine downtime directly impacts production facilities by halting or slowing down production lines. This results in lost production time, which can lead to missed delivery deadlines and lost revenue. The financial impact is immediate and can be substantial, affecting the overall efficiency and profitability of the facility.

unplanned machine downtime

Ripple Effects Throughout the Supply Chain

The effects of unplanned downtime extend beyond the production facility, causing ripple effects throughout the supply chain. Suppliers and customers can be impacted, leading to a cascade of delays and increased costs. This can strain relationships with partners and affect the overall resilience of the supply chain.

Hidden Costs Beyond Lost Production Time

Beyond the immediate loss of production, unplanned downtime incurs hidden costs such as increased maintenance costs, potential overtime to catch up on lost production, and the cost of expedited shipping to meet customer demands. Additionally, there are costs associated with the potential loss of customer trust and brand reputation.

IoT Predictive Maintenance: The Foundation of Industry 4.0

The advent of Industry 4.0 has revolutionized manufacturing processes, with IoT predictive maintenance at its core. This integration of smart technologies and data-driven decision-making is transforming the way manufacturers approach equipment maintenance.

From Reactive to Preventive to Predictive Approaches

Traditional maintenance strategies have evolved significantly over time. Initially, manufacturers relied on reactive maintenance, addressing equipment failures as they occurred. This was followed by preventive maintenance, which involved scheduled maintenance tasks to reduce the likelihood of failures. Predictive maintenance now takes this a step further by leveraging advanced analytics, sensors, and machine learning to forecast when equipment is likely to fail.

The benefits of this predictive approach include:

  • Reduced downtime
  • Lower maintenance costs
  • Improved product quality
  • Enhanced overall equipment effectiveness (OEE)

The Role of Industrial Internet of Things (IIoT)

The Industrial Internet of Things (IIoT) is the backbone of predictive maintenance. By connecting industrial equipment to the internet and enabling real-time data collection, IIoT facilitates the monitoring of equipment health and performance. Advanced sensors and data analytics tools process this information to predict potential failures.

IoT Predictive Maintenance

Key Components of a Smart Factory Maintenance System

A smart factory maintenance system comprises several key components:

  1. Advanced sensors for real-time monitoring
  2. Data analytics platforms for processing sensor data
  3. Machine learning algorithms for predicting equipment failures
  4. Integration with existing systems such as ERP and SCADA

These components work together to create a proactive maintenance strategy that minimizes downtime and optimizes production.

Essential Sensor Technologies for Machine Downtime Prediction

Predictive maintenance relies heavily on sensor technologies to forecast machine downtime. These technologies enable the real-time monitoring of critical machine health data, including vibration, temperature, and current consumption. By detecting early signs of equipment failure, sensor technologies allow for proactive maintenance, reducing the likelihood of unplanned downtime.

Vibration Monitoring Systems

Vibration monitoring is a crucial aspect of predictive maintenance. It involves using sensors to detect changes in the vibration patterns of machinery, which can indicate potential issues.

Detecting Early Bearing Failures

Bearing failures are a common cause of machine downtime. Vibration monitoring systems can detect early signs of bearing wear, allowing for maintenance before a failure occurs. As noted by industry experts, “early detection of bearing failures can significantly reduce maintenance costs and downtime.”

Frequency Analysis for Equipment Health

Frequency analysis is used to examine the vibration data collected by sensors. This analysis helps identify specific frequencies associated with different types of equipment issues, enabling targeted maintenance.

Temperature and Thermal Analysis Sensors

Temperature sensors monitor the thermal conditions of equipment, detecting abnormal temperature changes that could indicate potential problems. Thermal analysis helps in understanding the heat distribution and identifying hotspots that may lead to equipment failure.

Current and Power Consumption Sensors

Current and power consumption sensors measure the electrical load on machinery. Abnormal changes in current or power consumption can signal issues such as motor wear or electrical faults.

Acoustic and Ultrasonic Monitoring

Acoustic and ultrasonic monitoring involve listening to the sounds emitted by machinery. These sounds can indicate the presence of leaks, friction, or other issues that may lead to equipment failure. Ultrasonic monitoring, in particular, is useful for detecting high-frequency sounds that are beyond human hearing range.

By leveraging these sensor technologies, industries can significantly improve their predictive maintenance capabilities, reducing unplanned downtime and improving overall equipment effectiveness.

Data Collection and Processing Architecture

The backbone of any successful predictive maintenance program is a robust data collection and processing architecture. This architecture enables the efficient gathering, processing, and analysis of data from various IoT sensors and devices. By leveraging advanced technologies such as edge computing and cloud analytics, industries can significantly enhance their maintenance operations.

Edge Computing for Real-Time Analysis

Edge computing plays a critical role in IoT predictive maintenance by enabling real-time data analysis at the edge of the network, closer to where the data is generated. This reduces latency and allows for immediate action to be taken when potential issues are detected. Real-time analysis is crucial for preventing unexpected equipment failures.

Cloud Analytics for Pattern Recognition

Cloud analytics complements edge computing by providing a centralized platform for storing and analyzing large datasets. Advanced machine learning algorithms and statistical models can be applied to identify patterns and predict potential failures. Cloud analytics enables the detection of complex patterns that may not be apparent at the edge.

Industrial Networks and Communication Protocols

Industrial networks and communication protocols are vital for connecting IoT devices and enabling data exchange. Protocols such as OPC UA and Modbus facilitate secure and efficient data transmission between devices and systems. Secure data transmission is essential for maintaining the integrity of the predictive maintenance system.

OPC UA and Modbus Integration

OPC UA and Modbus are widely used protocols in industrial automation. OPC UA provides a secure and reliable means of data exchange, while Modbus is known for its simplicity and widespread adoption. Integrating these protocols ensures compatibility with a broad range of devices.

Secure Data Transmission Methods

Secure data transmission is critical for protecting sensitive information and preventing unauthorized access. Implementing encryption and authentication mechanisms ensures that data is transmitted securely.

“Security is not just a feature, it’s a necessity in IoT predictive maintenance.”

Advanced Analytics and AI Models for Failure Prediction

Advanced analytics and AI models are at the forefront of predictive maintenance, enabling proactive measures to prevent equipment failures. By leveraging complex algorithms and machine learning techniques, industries can analyze vast amounts of data generated by machinery, predicting when maintenance is required.

Machine Learning Algorithms for Anomaly Detection

Machine learning algorithms play a crucial role in detecting anomalies that may indicate potential equipment failures. These algorithms can be trained on historical data to recognize patterns that precede failures.

Supervised vs. Unsupervised Learning Approaches

Supervised learning involves training models on labeled data, where the algorithm learns to predict outcomes based on known failure patterns. Unsupervised learning, on the other hand, identifies anomalies in unlabeled data, detecting unusual patterns that may not be associated with known failures.

Training Models with Historical Failure Data

Training machine learning models with historical failure data is essential for accurate prediction. This data includes records of past failures, maintenance activities, and operational conditions, providing a comprehensive view of equipment performance over time.

Predictive Analytics for Remaining Useful Life Estimation

Predictive analytics enables the estimation of a component’s remaining useful life (RUL), allowing maintenance teams to plan interventions before a failure occurs. This involves analyzing data from sensors and other sources to model the degradation of equipment over time.

Digital Twins and Simulation Models

Digital twins are virtual replicas of physical equipment, used to simulate real-world conditions and predict how equipment will perform under various scenarios. This allows for the testing of maintenance strategies in a virtual environment before applying them in reality.

Technology Description Benefits
Machine Learning Analyzes data to detect anomalies and predict failures Reduces unplanned downtime, optimizes maintenance
Predictive Analytics Estimates remaining useful life of components Improves maintenance planning, reduces costs
Digital Twins Simulates equipment performance under various conditions Enhances predictive maintenance, reduces risk

Implementing IoT Predictive Maintenance in Your Facility

With the advent of IoT technologies, predictive maintenance is becoming a cornerstone for reducing downtime and enhancing productivity in manufacturing facilities. “The future of maintenance is predictive, and it’s being driven by data,” as noted by industry experts. Implementing IoT predictive maintenance requires a strategic approach that encompasses several key phases.

Assessment and Planning Phase

The first step in implementing IoT predictive maintenance is a thorough assessment and planning phase. This involves identifying critical equipment, assessing current maintenance practices, and determining the most suitable IoT technologies for your facility. A well-planned strategy ensures that the implementation process is smooth and effective.

Pilot Implementation Strategies

Starting with a pilot implementation allows facilities to test the waters, so to speak, before scaling up. This phase is crucial for identifying potential challenges, refining the maintenance strategy, and demonstrating the value of IoT predictive maintenance to stakeholders.

Integration with Existing Systems (SCADA, PLC, ERP)

Successful implementation of IoT predictive maintenance hinges on its ability to integrate with existing systems such as SCADA, PLC, and ERP. This integration ensures seamless data flow and maximizes the utility of the predictive maintenance solution. Seamless integration is key to avoiding data silos and ensuring that maintenance decisions are informed by comprehensive data analysis.

Scaling Across Production Lines

Once the pilot implementation has proven successful, the next step is scaling the IoT predictive maintenance solution across production lines. This involves prioritizing critical equipment and adopting a phased deployment approach to manage the rollout effectively.

Prioritizing Critical Equipment

Not all equipment is created equal. Prioritizing critical equipment ensures that the most impactful assets are maintained proactively, reducing the risk of unplanned downtime. This strategic focus maximizes the ROI of the predictive maintenance program.

Phased Deployment Approach

A phased deployment approach allows facilities to gradually scale their IoT predictive maintenance solution. This method helps manage the change effectively, train personnel, and address any technical issues that arise during the implementation process.

“Predictive maintenance is not just about predicting failures; it’s about creating a culture of proactive maintenance that enhances overall operational efficiency.”

— Industry Expert

By following these guidelines and leveraging IoT technologies, manufacturing facilities can significantly reduce unplanned machine downtime, improve productivity, and achieve substantial cost savings.

ROI and Business Benefits of Predictive Maintenance Solutions

Predictive maintenance, powered by IoT, is proving to be a game-changer for manufacturers, enhancing operational efficiency and reducing costs. By leveraging advanced analytics and machine learning algorithms, companies can now predict equipment failures, schedule maintenance, and optimize production processes.

Quantifiable Improvements in OEE and Uptime

The implementation of predictive maintenance solutions leads to significant improvements in Overall Equipment Effectiveness (OEE) and uptime. By minimizing unplanned downtime, manufacturers can achieve up to 20% increase in OEE and reduce production losses.

Maintenance Cost Reduction and Resource Optimization

Predictive maintenance enables companies to reduce maintenance costs by transitioning from a reactive to a proactive maintenance strategy. This approach allows for optimized resource allocation and reduced waste.

Spare Parts Inventory Management

With predictive maintenance, manufacturers can better manage their spare parts inventory. By knowing exactly when and where maintenance will be required, companies can reduce inventory costs by up to 15%.

Labor Allocation Efficiency

Labor resources can be allocated more efficiently with predictive maintenance. Maintenance personnel can be scheduled to perform tasks during planned downtime, reducing the impact on production and improving labor productivity.

Case Studies: Success Stories Across Industries

Numerous companies across various industries have achieved significant benefits from implementing predictive maintenance solutions. For instance, a leading manufacturer in the automotive sector reported a 25% reduction in maintenance costs within the first year of implementation.

Overcoming Challenges in Digital Transformation for Maintenance

Implementing digital transformation in maintenance requires navigating through data security concerns, technical integration issues, and organizational change. As industries adopt IoT predictive maintenance, they must address these challenges to ensure successful integration.

Data Security and Privacy Concerns

Data security is paramount in digital transformation. With the increased use of IoT devices, there’s a higher risk of cyber threats. Implementing robust security measures, such as encryption and secure data storage, is crucial to protect sensitive information.

Technical Integration Hurdles

Technical integration is another significant challenge. Legacy systems often need to be integrated with new technologies, which can be complex. Ensuring compatibility and seamless data exchange between different systems is vital for the success of predictive maintenance.

Organizational Change Management

Organizational change management is critical when adopting new maintenance strategies. It involves training maintenance teams and shifting from a reactive to a predictive culture.

Training Maintenance Teams

Training is essential to equip maintenance teams with the necessary skills to work with new technologies and data-driven insights.

Shifting from Reactive to Predictive Culture

Changing the organizational culture from reactive to predictive maintenance requires a fundamental shift in how maintenance is approached. It involves proactive planning and leveraging data analytics to predict and prevent equipment failures.

Challenge Solution
Data Security Concerns Implement robust security measures
Technical Integration Hurdles Ensure compatibility between systems
Organizational Change Management Train maintenance teams and shift to predictive culture

By addressing these challenges, organizations can successfully implement digital transformation in maintenance, leading to improved efficiency and reduced downtime.

Conclusion: The Future of Smart Manufacturing and Maintenance

The future of smart manufacturing and maintenance is predictive and proactive, leveraging IoT, AI, and advanced analytics to optimize equipment performance and reduce downtime. As we move further into Industry 4.0, the importance of predictive maintenance continues to grow, enabling manufacturers to stay ahead of the competition.

By adopting predictive maintenance strategies, manufacturers can significantly reduce unplanned downtime, improve overall equipment effectiveness, and lower maintenance costs. The integration of advanced technologies such as IoT sensors, machine learning algorithms, and data analytics is revolutionizing the way maintenance is performed, paving the way for a more efficient and productive future.

As the future of maintenance unfolds, it’s clear that the industry is shifting towards more proactive and predictive approaches. Manufacturers who embrace this change will be better positioned to respond to the demands of a rapidly changing market, ensuring they remain competitive and achieve operational excellence.

FAQ

What is IoT predictive maintenance, and how does it prevent unplanned machine downtime?

IoT predictive maintenance is a proactive approach that uses real-time data from industrial sensors and advanced analytics to predict potential equipment failures, enabling maintenance teams to take corrective action before downtime occurs.

How does predictive maintenance improve Overall Equipment Effectiveness (OEE)?

Predictive maintenance improves OEE by reducing unplanned downtime, optimizing maintenance schedules, and increasing production uptime, ultimately leading to improved manufacturing efficiency and productivity.

What are the key components of a smart factory maintenance system?

A smart factory maintenance system typically includes industrial sensors, edge computing, cloud analytics, and industrial networks and communication protocols, such as OPC UA and Modbus, to enable real-time monitoring and predictive maintenance.

How do vibration monitoring systems contribute to predictive maintenance?

Vibration monitoring systems detect anomalies in equipment vibration patterns, indicating potential issues such as bearing failure or misalignment, allowing maintenance teams to take corrective action before equipment failure occurs.

What is the role of edge computing in predictive maintenance?

Edge computing enables real-time analysis of industrial data at the edge of the network, reducing latency and improving response times, and allowing for more effective predictive maintenance and anomaly detection.

How can digital twins be used in predictive maintenance?

Digital twins are virtual replicas of physical equipment that can be used to simulate real-world conditions, predict potential failures, and optimize maintenance schedules, enabling more effective predictive maintenance and reducing downtime.

What are the benefits of integrating predictive maintenance with existing systems, such as SCADA and ERP?

Integrating predictive maintenance with existing systems enables seamless data exchange, improves maintenance planning, and optimizes resource allocation, ultimately leading to improved maintenance efficiency and reduced costs.

How can organizations overcome data security and privacy concerns in predictive maintenance?

Organizations can overcome data security and privacy concerns by implementing robust security measures, such as encryption and access controls, and ensuring compliance with relevant regulations and standards.

What are the ROI and business benefits of predictive maintenance solutions?

Predictive maintenance solutions can deliver significant ROI and business benefits, including improved OEE, reduced maintenance costs, and increased production uptime, ultimately leading to improved manufacturing efficiency and competitiveness.

How can maintenance teams be trained to effectively use predictive maintenance solutions?

Maintenance teams can be trained through a combination of technical training, on-the-job experience, and change management initiatives, ensuring they have the necessary skills and knowledge to effectively use predictive maintenance solutions.

About Iottive Pvt. Ltd.

Iottive Pvt. Ltd. is an Industrial IoT and smart manufacturing solution provider helping manufacturers design and deploy Industry 4.0 solutions. From sensor and PLC integration to cloud analytics and custom dashboards, Iottive delivers scalable IIoT platforms aligned with real shop-floor challenges.

Iottive Pvt. Ltd. is an Industrial IoT (IIoT) and smart manufacturing solution company enabling manufacturers to design, build, and scale Industry 4.0 systems. Iottive partners with organizations across their digital transformation journey—bridging the gap between shop-floor operations and intelligent, data-driven decision making.

With deep expertise in Industrial Automation, IIoT architectures, and connected product development, Iottive delivers end-to-end solutions covering the complete lifecycle of smart manufacturing initiatives.

How Iottive Delivers End-to-End IIoT Solutions

1. Concept & Solution Design

Iottive works closely with plant teams, engineering leaders, and stakeholders to understand operational challenges, asset behavior, and production goals. This phase includes use-case validation, system architecture design, sensor selection, connectivity planning, and defining measurable business outcomes.

2. Engineering & System Integration

Iottive engineers industrial-grade IIoT solutions by integrating sensors, PLCs, SCADA systems, gateways, and industrial protocols such as OPC UA, Modbus, MQTT, and BLE. The focus is on reliable data acquisition, secure communication, and seamless integration with existing automation infrastructure.

3. Prototyping & Pilot Deployment

Rapid prototyping enables manufacturers to validate concepts on the shop floor before full-scale rollout. Iottive develops functional prototypes, edge analytics, dashboards, and mobile applications to test performance, data accuracy, and operational feasibility in real manufacturing environments.

4. Product Experience & Data Intelligence

Iottive designs intuitive web and mobile dashboards that provide real-time visibility into machine health, production metrics, and operational KPIs. Advanced analytics, alerts, and visualization tools empower plant teams to take proactive, data-driven decisions with minimal complexity.

5. Commercialization & Scale-Up

From MVP to enterprise deployment, Iottive supports product hardening, scalability, cloud or hybrid deployments, and long-term maintenance. Solutions are designed for multi-plant rollout, system expansion, and continuous optimization—ensuring measurable ROI and operational impact.

Why Manufacturers Choose Iottive

  • Proven experience in Industrial Automation & IIoT
  • Strong understanding of real shop-floor challenges
  • Seamless integration with existing PLC/SCADA systems
  • Scalable, secure, and production-ready architectures
  • Focus on business outcomes, not just technology

Contact Email: sales@iottive.com

Smart Manufacturing Factories: Transforming Production in the Digital Age

The manufacturing landscape is undergoing a profound transformation. Smart Manufacturing Factories represent the convergence of digital technologies, data analytics, and traditional manufacturing processes to create more efficient, flexible, and responsive production environments. As we navigate Industry 4.0, manufacturers who embrace these intelligent systems gain significant competitive advantages through enhanced productivity, reduced costs, and improved quality control. This comprehensive guide explores how smart manufacturing is reshaping the industrial sector and provides actionable insights for your own digital transformation journey.

Modern Smart Manufacturing Factory with robotic arms and digital interfaces

What is Smart Manufacturing and Why Does It Matter?

Smart manufacturing represents the seamless integration of advanced technologies with manufacturing processes to create highly efficient, connected, and adaptive production systems. At its core, it’s about leveraging data, automation, and intelligent systems to optimize every aspect of the manufacturing process.

In the context of Industry 4.0, smart manufacturing factories serve as the physical manifestation of the fourth industrial revolution. Unlike traditional manufacturing facilities that operate in relatively isolated environments with limited connectivity, smart factories function as interconnected ecosystems where machines, systems, and humans communicate and collaborate in real-time.

The significance of smart manufacturing extends beyond mere technological advancement. It represents a fundamental shift in how products are conceived, designed, produced, and delivered to customers. This transformation is driven by the need to address several pressing challenges facing the manufacturing sector:

Digital twin visualization of a Smart Manufacturing Factory

Global Competition

Manufacturers face intense pressure to reduce costs while improving quality and speed to market. Smart manufacturing provides the tools to achieve these seemingly contradictory goals simultaneously.

Customer Expectations

Today’s customers demand greater customization, faster delivery, and higher quality at competitive prices. Smart factories enable the flexibility to meet these diverse requirements efficiently.

Workforce Challenges

With skilled labor shortages affecting many regions, smart manufacturing technologies help maximize workforce productivity and create new roles that attract digital talent.

Key Technologies Enabling Smart Manufacturing Factories

The transformation to smart manufacturing is powered by a suite of complementary technologies that work together to create intelligent, connected production environments. Understanding these core technologies is essential for any manufacturer looking to embark on their smart factory journey.

Integration of key technologies in a Smart Manufacturing Factory

Internet of Things (IoT)

IoT forms the foundation of smart manufacturing by connecting machines, products, and systems through networks of sensors that collect and exchange data. These sensors monitor everything from equipment performance and environmental conditions to product quality and inventory levels.

According to Deloitte’s 2025 Smart Manufacturing Survey, 46% of manufacturers are already leveraging industrial IoT solutions, with an additional 27% planning to invest in IIoT within the next 24 months.

Artificial Intelligence and Machine Learning

AI and machine learning algorithms analyze the vast amounts of data generated in smart factories to identify patterns, predict outcomes, and optimize processes. These technologies enable predictive maintenance, quality control, and autonomous decision-making.

The implementation of AI in manufacturing is growing steadily, with 29% of manufacturers using AI/ML at the facility level and 24% deploying generative AI, according to recent industry surveys.

Robotics and Automation

Advanced robotics, including collaborative robots (cobots) that work alongside humans, automate repetitive, dangerous, or precision-requiring tasks. Modern robots are increasingly flexible, able to be reprogrammed quickly to handle different products or processes.

Physical automation ranks as a top investment priority for 37% of manufacturers in the next two years, highlighting its critical role in smart factory implementations.

Cloud Computing

Cloud platforms provide the scalable computing power and storage needed to process the enormous volumes of data generated in smart factories. They also enable remote monitoring, management, and collaboration across global manufacturing networks.

Currently, 57% of manufacturers are using cloud computing, with an additional 29% planning to invest in cloud technologies within the next 24 months.

Big Data Analytics

Advanced analytics tools transform raw data into actionable insights that drive continuous improvement. From real-time dashboards to complex simulation models, these tools help manufacturers optimize everything from equipment performance to supply chain logistics.

Data analytics is being leveraged by 57% of manufacturers, with 40% ranking it as their first or second highest priority for investment in the coming years.

Digital Twins

Digital twins create virtual replicas of physical assets, processes, or entire factories. These digital models enable simulation, testing, and optimization in a virtual environment before implementation in the real world, reducing risk and accelerating innovation.

The digital twin technology is increasingly being adopted for planning, startup, and ongoing optimization of automated systems, providing significant time and cost savings.

Augmented Reality (AR)

AR overlays digital information onto the physical environment, assisting workers with complex assembly, maintenance, and quality inspection tasks. AR can display step-by-step instructions, highlight components, and provide real-time feedback to improve accuracy and efficiency.

5G Connectivity

The high-speed, low-latency capabilities of 5G networks enable real-time communication between machines, systems, and humans. This is particularly important for applications requiring immediate response, such as autonomous vehicles or collaborative robotics.

Approximately 42% of manufacturers are already leveraging 5G technology to enhance connectivity in their smart factory implementations.

Cybersecurity

As manufacturing becomes more connected, robust cybersecurity measures are essential to protect sensitive data, intellectual property, and operational technology from threats. This includes network security, access controls, encryption, and continuous monitoring.

Manufacturers are dedicating an average of 15.74% of their IT budget to cybersecurity, recognizing its critical importance in smart factory environments.

Benefits of Implementing Smart Manufacturing Systems

The transition to smart manufacturing delivers numerous advantages that directly impact a company’s bottom line, operational efficiency, and competitive positioning. Understanding these benefits helps build the business case for investment in smart factory technologies.

Workers collaborating with robots in a Smart Manufacturing Factory

Key Benefits of Smart Manufacturing

  • Increased Operational Efficiency: Smart factories report 10-20% improvement in production output and 7-20% improvement in employee productivity through optimized processes and reduced downtime.
  • Enhanced Product Quality: Real-time monitoring and AI-driven quality control reduce defects, with some implementations achieving defect rates as low as 0.0012%.
  • Production Flexibility: Rapid reconfiguration of production lines enables manufacturers to quickly adapt to changing market demands and produce customized products efficiently.
  • Reduced Costs: Predictive maintenance reduces unplanned downtime by up to 50%, while optimized processes minimize waste, energy consumption, and labor costs.
  • Improved Decision-Making: Data-driven insights enable faster, more informed decisions at all levels of the organization, from the shop floor to the executive suite.
  • Enhanced Worker Safety: Automation of dangerous tasks and real-time monitoring of environmental conditions create safer working environments.
  • Sustainability: Optimized resource utilization and reduced waste contribute to more environmentally sustainable manufacturing operations.

“The magic word for the future is ‘demand-driven production’. Today more than ever, consumers want their goods to be customized according to their wishes, which is why items are now mainly produced as needed. In order to supply these new production lines, dynamic systems are needed with stronger integration and interconnection between production and logistics.”

Christian Brauneis, Vice President KNAPP Industry Solutions
4.5
 
Overall Impact
Productivity Improvement
 
4.5/5
Quality Enhancement
 
4.7/5
Cost Reduction
 
4.3/5
Time-to-Market
 
4.1/5
Workforce Satisfaction
 
4.0/5

Ready to Start Your Smart Manufacturing Journey?

Download our comprehensive implementation guide to learn the step-by-step process for transforming your manufacturing operations.


Real-World Examples of Successful Smart Factory Implementations

Examining successful smart manufacturing implementations provides valuable insights into best practices, challenges, and potential outcomes. These case studies demonstrate how companies across various industries have leveraged smart factory technologies to achieve tangible business results.

Automated production line in a Smart Manufacturing Factory

Siemens Amberg Electronics Plant

Siemens’ Amberg facility represents one of the most advanced smart factories in operation today. By integrating physical manufacturing with digital technologies, Siemens has achieved remarkable results:

  • 99.9988% production quality (defect rate of just 0.0012%)
  • 8x increase in production volume without significant expansion
  • Production of 15 million Simatic products annually
  • Capability to manufacture over 1,000 different product variants

Key to their success has been the integration of real and virtual worlds, direct communication between products and machines, and sophisticated IT systems that optimize all production processes.

Bosch Homburg Plant

Bosch’s factory in Homburg, Germany, transformed its hydraulic valve production line through Industry 4.0 solutions to improve efficiency while maintaining flexibility. Their implementation included:

  • Autonomous intelligent workstations capable of quick product switching
  • Active Assist assembly technology with pick-to-light systems
  • RFID integration for real-time component tracking
  • Customized worker assistance based on qualification level

The results were impressive: setup time reduction from 450 seconds to zero, inventory days halved, 8% decrease in cycle times, and €500,000 in cost savings in the first year alone.

L3Harris Technologies

L3Harris Technologies established a Smart Manufacturing Cell at their Rochester, NY facility to meet increased customer demand for tactical radios. Their implementation featured:

  • Augmented reality for real-time work instructions
  • Common Industry 4.0 platform integrating vision inspection and precision tools
  • Line-agnostic stations capable of building different products
  • Comprehensive data collection and analysis systems

The results included the ability to run three product lines simultaneously with increased efficiency, reduced non-value-added time, improved cognitive ergonomics, and better space utilization and safety.

Company Industry Key Technologies Primary Benefits ROI Timeframe
Siemens Electronics Digital twins, automation, IoT Quality improvement, production volume increase 2-3 years
Bosch Automotive components RFID, pick-to-light, worker assistance Setup time reduction, inventory optimization 1 year
L3Harris Defense electronics Augmented reality, vision inspection, data analytics Efficiency, flexibility, quality control 1-2 years
Magna Automotive Automation, intelligent software Faster parts availability, reduced internal transport 2 years
Fronius Welding equipment Autonomous mobile robots Automated production supply, flexible transport 1-2 years

Challenges and Considerations for Adopting Smart Manufacturing

While the benefits of smart manufacturing are compelling, the transformation journey presents several challenges that manufacturers must address to ensure successful implementation. Understanding these challenges helps organizations develop effective strategies to overcome them.

Team planning a Smart Manufacturing Factory implementation

Implementation Challenges

  • High Initial Investment: Smart manufacturing technologies require significant capital expenditure, with 78% of manufacturers allocating more than 20% of their improvement budget to these initiatives.
  • Integration Complexity: Connecting legacy systems with new technologies creates technical challenges, particularly in older facilities with limited digital infrastructure.
  • Workforce Skills Gap: There’s a significant shortage of talent with the necessary digital skills, with 48% of manufacturers reporting moderate to significant challenges in filling production and operations management roles.
  • Cybersecurity Risks: Increased connectivity exposes manufacturing systems to potential cyber threats, with 55% of manufacturers citing unauthorized access as a high concern.
  • Change Management: Transitioning to new ways of working requires careful change management to overcome resistance and ensure adoption.

Strategic Considerations

  • Phased Implementation: Rather than attempting a complete transformation at once, successful manufacturers typically adopt a staged approach, starting with high-impact, lower-risk initiatives.
  • Clear Business Case: Each smart manufacturing investment should be tied to specific business outcomes with measurable KPIs to ensure ROI.
  • Data Strategy: A comprehensive data strategy addressing collection, storage, analysis, and governance is essential for extracting value from smart manufacturing technologies.
  • Talent Development: Building internal capabilities through training and recruitment is critical, with 53% of manufacturers using in-house training for executives and 43% leveraging vendor-provided training.
  • Ecosystem Partnerships: Collaborating with technology providers, consultants, and academic institutions can accelerate implementation and provide access to specialized expertise.

Key Risk Mitigation Strategies

According to Deloitte’s 2025 Smart Manufacturing Survey, manufacturers are taking several approaches to mitigate risks associated with smart factory implementations:

  • 68% performed a cybersecurity risk or maturity assessment of their smart manufacturing technology stack in the last year
  • 72-74% conduct internal and external penetration testing and vulnerability assessments
  • 52% have developed a central team or working group tasked with researching, developing, and deploying smart manufacturing initiatives
  • 45% have developed a process to communicate to employees and customers the implications of smart manufacturing
  • 44% have established a smart manufacturing center of excellence

Practical Steps for Manufacturers to Begin Their Smart Factory Transformation

Transforming traditional manufacturing operations into smart factories is a journey that requires careful planning, strategic investments, and organizational alignment. The following roadmap provides practical guidance for manufacturers at any stage of their smart manufacturing journey.

Step-by-step implementation roadmap for Smart Manufacturing Factories

Phase 1: Assessment and Strategy Development

  • Evaluate Current State
    Conduct a comprehensive assessment of existing manufacturing operations, technology infrastructure, data capabilities, and workforce skills. Identify pain points, inefficiencies, and opportunities for improvement.
  • Define Clear Objectives
    Establish specific, measurable goals for your smart manufacturing initiative, such as reducing downtime by 30%, improving quality by 25%, or increasing throughput by 15%. These objectives should align with broader business strategies.
  • Develop a Technology Roadmap
    Create a phased implementation plan that prioritizes technologies based on potential impact, implementation complexity, and alignment with business objectives. Start with foundational capabilities like connectivity and data collection before moving to more advanced applications.
  • Build the Business Case
    Develop a detailed business case that quantifies the expected benefits, costs, and ROI of your smart manufacturing initiative. This should include both tangible benefits (cost savings, productivity improvements) and intangible benefits (enhanced agility, improved safety).
  • Secure Leadership Commitment
    Gain executive sponsorship by demonstrating how smart manufacturing aligns with strategic priorities. Ensure leaders understand the transformational nature of the initiative and are prepared to provide sustained support.

Phase 2: Foundation Building

  • Establish Connectivity Infrastructure
    Implement the necessary network infrastructure to connect machines, sensors, and systems. This may include upgrading to industrial Ethernet, implementing wireless networks, and establishing edge computing capabilities.
  • Implement Data Collection and Management
    Deploy sensors and data collection systems to capture information from manufacturing processes. Establish data management practices including storage, governance, and quality control.
  • Develop Analytics Capabilities
    Build the capability to analyze manufacturing data for insights. Start with basic descriptive analytics before progressing to more advanced predictive and prescriptive approaches.
  • Address Cybersecurity
    Implement robust cybersecurity measures to protect connected manufacturing systems from threats. This should include network segmentation, access controls, encryption, and continuous monitoring.
  • Develop the Workforce
    Invest in training programs to equip employees with the skills needed for smart manufacturing. This may include technical skills (data analysis, automation programming) and soft skills (digital literacy, problem-solving).

Phase 3: Implementation and Scaling

  • Start with Pilot Projects
    Implement small-scale pilot projects to test technologies, processes, and approaches. Focus on high-impact areas with clear success metrics and use these pilots to demonstrate value and learn lessons for broader deployment.
  • Implement Core Technologies
    Based on your roadmap and pilot results, implement the core technologies that will drive your smart manufacturing transformation. This may include production execution systems, quality management systems, and automation solutions.
  • Integrate Systems and Data
    Connect previously siloed systems to enable seamless data flow and process coordination. This may involve implementing middleware, APIs, or industrial IoT platforms to facilitate integration.
  • Scale Successful Solutions
    Expand successful pilot implementations across additional production lines, facilities, or business units. Apply lessons learned from pilots to improve implementation approaches and outcomes.
  • Manage Change Effectively
    Implement a structured change management program to help employees adapt to new technologies and ways of working. This should include communication, training, and mechanisms to address concerns and resistance.

Phase 4: Continuous Improvement and Innovation

  • Monitor and Measure Performance
    Establish dashboards and reporting mechanisms to track key performance indicators and the impact of smart manufacturing initiatives. Use this data to identify areas for further improvement.
  • Foster a Culture of Innovation
    Encourage experimentation and continuous improvement by establishing mechanisms for employees to suggest and implement new ideas. Recognize and reward innovative contributions to the smart manufacturing journey.
  • Stay Current with Technology Trends
    Continuously monitor emerging technologies and industry best practices. Evaluate new solutions for potential implementation as they mature and align with business needs.
  • Expand Ecosystem Partnerships
    Develop relationships with technology providers, research institutions, and industry consortia to access expertise, share knowledge, and collaborate on innovation initiatives.

Implementation Success Factors

Research and experience from successful smart manufacturing implementations highlight several critical success factors:

  • Cross-functional collaboration: Involve stakeholders from operations, IT, engineering, and business units in planning and implementation
  • Data-driven decision making: Base investment and implementation decisions on data and measurable outcomes
  • Agile approach: Use iterative implementation methods that allow for learning and adjustment
  • Focus on people: Recognize that successful transformation depends as much on people and processes as on technology
  • Long-term commitment: Maintain focus and investment over time, recognizing that transformation is a journey rather than a destination

Conclusion: The Future of Manufacturing is Smart

Smart Manufacturing Factories represent not just an evolution in production technology but a fundamental reimagining of how products are conceived, designed, manufactured, and delivered. By integrating digital technologies with physical processes, manufacturers can achieve unprecedented levels of efficiency, quality, and responsiveness.

The journey to smart manufacturing is challenging but essential for manufacturers who wish to remain competitive in an increasingly digital world. Those who successfully navigate this transformation will be rewarded with significant advantages: lower costs, higher quality, greater agility, and the ability to create innovative products and business models that were previously impossible.

As we look to the future, the convergence of technologies like AI, IoT, robotics, and advanced analytics will continue to expand the possibilities of smart manufacturing. The most successful manufacturers will be those who view smart manufacturing not as a one-time technology implementation but as an ongoing journey of continuous improvement and innovation.

Future vision of integrated Smart Manufacturing Factories ecosystem

Ready to Transform Your Manufacturing Operations?

Our team of smart manufacturing experts can help you develop a customized roadmap for your digital transformation journey. Schedule a consultation to discuss your specific challenges and opportunities.

Schedule a Smart Manufacturing Consultation

Frequently Asked Questions About Smart Manufacturing Factories

What is the difference between a traditional factory and a smart factory?

Traditional factories operate with limited connectivity between machines and systems, rely heavily on manual processes and decision-making, and have minimal real-time visibility into operations. In contrast, smart factories feature comprehensive connectivity across all systems, utilize data and analytics for automated decision-making, implement advanced automation and robotics, and enable real-time monitoring and optimization of all processes. Smart factories are also characterized by their ability to adapt quickly to changing requirements and self-optimize their operations.

How much does it cost to implement a smart manufacturing system?

The cost of implementing smart manufacturing varies widely depending on the scope, existing infrastructure, and specific technologies deployed. Small-scale pilots might start at ,000-0,000, while comprehensive factory-wide transformations can require investments of millions of dollars. According to industry surveys, 78% of manufacturers allocate more than 20% of their overall improvement budget toward smart manufacturing initiatives. Rather than viewing this as a one-time capital expense, it’s more accurate to consider it an ongoing investment with returns realized through improved efficiency, quality, and agility over time.

How long does it take to implement a smart factory transformation?

Smart manufacturing is best viewed as a journey rather than a destination. Initial pilots can be implemented in 3-6 months, while more comprehensive transformations typically unfold over 2-5 years. Many manufacturers adopt a phased approach, starting with foundational capabilities like connectivity and data collection before progressing to more advanced applications. The timeline depends on factors including organizational readiness, existing infrastructure, available resources, and the complexity of manufacturing processes.

What skills are needed for smart manufacturing implementation?

Successful smart manufacturing requires a blend of traditional manufacturing expertise and digital skills. Key capabilities include data science and analytics, automation engineering, cybersecurity, systems integration, IoT implementation, and change management. Many manufacturers develop these capabilities through a combination of hiring, training existing employees, and partnering with external experts. According to recent surveys, 48% of manufacturers report moderate to significant challenges in filling production and operations management roles with the necessary digital skills.

How do smart factories impact the workforce?

Smart factories transform workforce requirements rather than simply reducing headcount. While some routine tasks may be automated, new roles emerge in areas such as data analysis, automation engineering, and systems integration. Workers often shift from manual tasks to monitoring, programming, and optimizing automated systems. This transition requires significant investment in training and skill development. According to industry research, 85% of manufacturers believe smart manufacturing initiatives will attract new talent to the industry by creating more engaging, technology-focused roles.

IoT Enable Smart Manufacturing Factories

The industrial landscape is undergoing a profound transformation. Traditional production facilities are evolving into intelligent, interconnected ecosystems as manufacturers deploy data-driven technologies to stay competitive in a volatile global economy.

IoT enabled smart manufacturing factory

According to a Deloitte survey, 92% of executives at large manufacturing companies view digital transformation as a primary driver of competitiveness, and 85% expect it to fundamentally change how products are made (source: Deloitte Industry 4.0 survey).1 These figures reflect widespread industry commitment to smart manufacturing and investment in connected systems.

When factories combine sensors, cloud analytics, and automation, they unlock measurable gains: improved production output, higher product quality, and greater operational efficiency. For example, several manufacturers report production output increases in the 10–20% range after deploying integrated IoT and analytics stacks (see industry case studies).2

This guide explains how IoT and related technologies form the foundation for Smart Manufacturing Factories. We will walk through core components, practical use cases, and the steps manufacturers take to move from pilot projects to scaled production.

Key Takeaways

  • Smart manufacturing is widely recognized as essential for future competitiveness.
  • Intelligent, interconnected systems are replacing traditional production methods.
  • Companies are achieving significant improvements in output and productivity.
  • This transformation represents a fundamental shift in how products are designed and produced.
  • Real-time data-driven decision-making is central to operational excellence.
  • Connected factories enable faster responses to market demand while supporting sustainability goals.

See the section “How Iottive Pvt. Ltd. Supports End-to-End IoT Productization” near the conclusion for a practical partner example on product design, hardware, firmware, apps, testing, and commercialization support.

Next: we examine the core building blocks of IIoT systems and how they deliver operational intelligence across the factory floor.

Exploring the Future of IoT-Enabled Manufacturing

The blueprint for next-generation industrial operations is built on interconnected networks of intelligent devices. This foundation—commonly called the Industrial Internet of Things (IIoT)—creates a continuous stream of operational intelligence that drives smarter, faster decisions across the factory floor.

IoT enabled modern production ecosystem

In practice, the internet of things connects equipment sensors, vision cameras, actuators, and robots with edge and cloud compute. Where available, high-bandwidth options such as private 5G or industrial Wi‑Fi increase throughput and lower latency, enabling more real-time controls and richer telemetry for analytics.

Defining IoT in Modern Production

IIoT integrates people, machines, and systems into a cohesive digital framework. Operational intelligence here means the continuous ingestion and interpretation of sensor and process data to support automated responses and human decisions. Typical flows look like: vibration sensor → edge pre-processing → anomaly detected → cloud model predicts failure → maintenance ticket created.

Typical IIoT stack (high-level):

  • Edge devices and sensors (temperature, vibration, vision)
  • Connectivity layer (Ethernet, private 5G, Wi‑Fi, LPWAN)
  • Edge compute and gateways (local preprocessing, ML inferencing)
  • Cloud platforms and data lakes (storage, model training, orchestration)
  • Applications and dashboards (operator HMIs, executive analytics, mobile apps)

With this stack in place, real-time data flows drive predictive models and closed-loop controls. Facilities gain visibility into equipment performance, material flows, and product quality—information that directly improves production efficiency and reduces operating costs when teams act on the insights.

See how an IIoT stack is implemented in practice in the section “How Iottive Pvt. Ltd. Supports End-to-End IoT Productization” for an example workflow and toolchain.

Industry Trends and Developments in Smart Manufacturing

Contemporary production environments face a complex mix of market, regulatory, and economic pressures. Demand for personalized products and stricter environmental standards are reshaping how manufacturers design production systems and source materials.

industry trends and developments in manufacturing

Companies that embrace smart manufacturing technologies can shift from mass-produced, identical runs to more flexible, small-batch and customized production while maintaining cost discipline.

Evolving Market Demands and Sustainability

Mass production is giving way to customization: consumers increasingly expect unique products and faster delivery. This trend pushes manufacturers to adopt agile production techniques and modular systems that support frequent changeovers and short product runs.

Sustainability has moved from a nice-to-have to a business requirement. Regulations such as the EU Green Deal and retailer sustainability commitments are forcing manufacturers to report emissions and material provenance. IoT-driven energy monitoring and process optimization are proven solutions: connected sensors and analytics can cut energy use and waste, helping companies meet regulatory targets and deliver measurable environmental benefits.

Impact of Global Economic Factors

At the same time, global instability—geopolitical tensions, commodity shortages, and logistics disruptions—creates pressure on traditional supply models. The modern supply chain is more exposed to shocks, which increases the need for visibility and flexibility.

Manufacturers face several interrelated issues:

  • Fragile international logistics networks that extend lead times
  • Shortages of skilled labor in specialized production roles
  • Rising cost pressures from materials and transportation

Adopting advanced technologies and data-driven solutions is the practical path to resilience. Smart factories that combine sensors, analytics, and flexible automation can better anticipate supply disruptions, optimize resource use, and maintain consistent product quality—delivering both operational benefits and stronger market positioning.

Core Technologies Driving Smart Factories

Modern smart manufacturing relies on an integrated stack of data-first technologies that work together to deliver operational intelligence and continuous improvement. When combined correctly, these solutions give manufacturers the visibility and control needed to optimize production, reduce waste, and scale across sites.

Big Data, Cloud Integration, and the Internet of Things

Big data platforms ingest large volumes of time-series and event data from machines, sensors, and production systems to reveal patterns missed by manual analysis. Cloud computing supplies elastic storage and compute capacity for model training, cross-site analytics, and centralized dashboards—capabilities that are especially valuable for multi-site manufacturing operations.

IoT networks link sensors and devices across the factory: temperature, vibration, and current sensors provide equipment telemetry; vision systems capture quality data; and PLC/robot interfaces report process states. Edge gateways perform local filtering and preprocessing so only relevant telemetry and anomalies are sent to the cloud for deeper analysis and long-term storage.

core technologies for smart factories

Recommended high-level architecture: edge devices → connectivity (Ethernet, private 5G, industrial Wi‑Fi) → edge compute/gateways → cloud data & analytics → apps & dashboards. Each layer has distinct implementation and cost drivers—sensors and gateways are hardware-focused; cloud and analytics demand software and data engineering expertise.

Digital Twins and Advanced Sensor Systems

Digital twins are virtual models that mirror physical production assets, lines, or entire plants. Use cases include layout optimization, throughput simulation, scenario testing (e.g., change in product mix), and “what-if” analyses to validate process changes before applying them on the shop floor. Digital twins improve confidence in change management and reduce commissioning time for new lines.

Advanced sensor suites—especially machine vision combined with edge inferencing—enable automated quality inspection and near real-time defect detection. While no system guarantees absolute zero defects, vision plus ML-based analytics helps manufacturers approach zero-defect targets by catching subtle anomalies earlier than human inspection alone.

Sensor data feeds cloud-based analytics that retrain and refine digital twin models, creating a closed-loop improvement cycle: sensors → analytics → updated models → control or operator guidance. This synergy progressively increases throughput and product quality while reducing downtime.

Implementation Notes

  • Maturity & priorities: start with high-value use cases (predictive maintenance, quality inspection) before committing to full-scale digital twins.
  • Cost drivers: sensors, wiring, gateways, edge compute, cloud storage, and custom analytics development—budget for integration and change management.
  • Vendors & partners: expect to combine hardware suppliers, connectivity providers, cloud platforms, and system integrators; choose partners with manufacturing domain expertise.

Practical tip: include a short pilot that integrates sensors, an edge gateway, and a basic analytics dashboard to prove value before scaling. For help with digital twin modeling, sensor integration, and hardware-software co-design, see the section “How Iottive Pvt. Ltd. Supports End-to-End IoT Productization” later in this guide.

Enhancing Production through Automation and Robotics

Automation has shifted from a desirable upgrade to a strategic requirement for competitive manufacturing. Recent industry surveys show a strong focus on both process and physical automation investments, as companies prioritize faster cycle times, consistent product quality, and lower operational costs.

Automated Storage Systems and Material Handling

Automated storage and retrieval systems (AS/RS), conveyor automation, and robotic picking/packing form the backbone of modern material handling. These centralized systems manage inventory with precision and speed, reduce manual errors, and shorten lead times between storage and production.

Typical benefits include reduced throughput time, lower labor costs for repetitive tasks, and improved inventory accuracy—many adopters report measurable ROI within 12–36 months depending on scale and complexity.

automation and robotics in production

Autonomous Mobile Robots in Action

Autonomous mobile robots (AMRs) and automated guided vehicles (AGVs) handle repetitive material transport tasks with accuracy while requiring minimal fixed infrastructure. Their route flexibility allows factories to reconfigure production lines faster than with fixed conveyors.

For example, in mixed-model production environments, AMRs enable shorter changeover times and smoother flows to assembly stations—helping maintain consistent production rates when product mixes change.

Integrating automation and robotics creates a more efficient material-flow ecosystem. Companies that combine AS/RS, AMRs, and process automation commonly see meaningful reductions in cycle times and operational costs, while freeing human workers to focus on higher-value activities such as quality control, supervision, and continuous improvement.

Human + Robot: Workforce Transition

Automation doesn’t replace workers so much as shift their roles. Manufacturers should plan upskilling programs focused on systems operation, robot supervision, basic programming, and maintenance. A successful transition includes defined career paths, hands-on training, and collaboration between engineering and HR to retain institutional knowledge.

AI and Machine Learning in Optimizing Manufacturing Processes

Advanced computational capabilities are turning traditional manufacturing methods into predictive, self-improving systems. Artificial intelligence (AI) and machine learning (ML) form the cognitive core of modern production environments, using operational data to detect patterns, forecast outcomes, and recommend corrective actions faster than manual analysis.

AI and machine learning in manufacturing processes

Machine learning models apply statistical and computational techniques to sensor and process data to identify subtle correlations that humans might miss. When deployed at the edge or in the cloud, these models enable real-time insights and automated interventions that improve uptime, product quality, and throughput.

Predictive Maintenance Strategies

Predictive maintenance uses ML to analyze equipment sensor data (vibration, temperature, current) and historical failure records to forecast when machines will need service. By scheduling maintenance during planned windows, manufacturers can significantly reduce unplanned stoppages and extend asset lifetimes.

Typical KPIs for predictive maintenance pilots:

  • Mean Time Between Failures (MTBF)
  • Mean Time To Repair (MTTR)
  • Reduction in unplanned downtime (targeted %)
  • Maintenance cost per asset

Industry reports commonly cite unplanned downtime reductions in the tens of percent after mature predictive programs—actual results vary by asset criticality and data quality. Implementation decisions (edge inferencing vs. cloud scoring) depend on latency requirements and bandwidth constraints.

Quality Assurance and Process Optimization

Computer vision and ML-driven analytics automate quality inspection, spotting defects and deviations that are difficult for human inspectors to detect consistently. ML continuously analyzes production data to surface root causes, enabling rapid corrective actions that improve product quality.

Process optimization uses AI to model complex relationships among temperature, speed, humidity, and other parameters to find operating settings that maximize throughput while maintaining product quality. These models can run in simulation or as live controllers to tune setpoints dynamically.

Selecting and Running an ML Use Case

Practical guidance for starting an ML initiative:

  • Choose a high-value, well-scoped use case (e.g., gearbox vibration prediction, visual defect detection of critical surfaces).
  • Assess data readiness: sensor density, historical logs, labeling effort required.
  • Run a short pilot (6–12 weeks) with clear success metrics: precision/recall for detection models, % downtime reduction for maintenance pilots.
  • Plan model lifecycle: retraining cadence, monitoring for drift, and integration with maintenance or MES systems.

Implementation caveats: ML success depends on data quality and representative labeling; latency-sensitive use cases often require edge ML, while broader analytics and retraining workflows fit cloud platforms. For organizations that need an ML readiness assessment or help designing pilots, consider evaluating partner services that combine data engineering, domain expertise, and deployment experience.

Smart Manufacturing Factories: Improving Efficiency and Flexibility

Operational excellence today depends on integrating digital technologies that boost productivity while preserving the flexibility to respond to changing demand. Smart manufacturing systems deliver measurable improvements across throughput, workforce productivity, and capacity utilization when deployed with clear objectives and governance.

Industry reports and case studies consistently document gains after successful pilots and rollouts. Typical improvement ranges observed across multiple implementations include:

Performance MetricImprovement RangePrimary Benefit
Production Output 10% to 20% Increased capacity
Employee Productivity 7% to 20% Optimized workflows
Unlocked Capacity 10% to 15% Better resource use

How these metrics are typically measured:

  • Production output: units produced per shift or hourly throughput compared to baseline.
  • Employee productivity: output per labor hour, factoring out product mix changes.
  • Unlocked capacity: percent increase in available capacity without additional capital equipment.

“Nearly half of industry leaders prioritize operational benefits as their primary value driver when implementing advanced production technologies.”

Smart factories achieve reduced error rates through predictive maintenance, automated quality inspection, and closed-loop setpoint management. For example, combining machine vision with analytics often reduces escape rate of defects and decreases rework costs. Cost reductions also come from demand-driven procurement that lowers inventory carrying costs and shorter cycle times that reduce work-in-progress.

Before / After: A Mini Case

In a mixed-model assembly line pilot, a manufacturer combined targeted sensorization and a lightweight analytics dashboard. Within six months they reported a 12% increase in hourly throughput and a 15% reduction in rework—improvements driven by faster anomaly detection and quicker operator response.

Buyer Checklist: Pilot to Scale

  • Define clear success metrics (throughput, defect rate, ROI timeframe).
  • Scope a narrow pilot with measurable KPIs and a defined timeline (3–6 months).
  • Ensure data collection and quality before modeling or ML work begins.
  • Plan integration points with MES/ERP and maintenance systems.
  • Prepare an upskilling roadmap for operators and maintenance teams.

Workforce impact: automation removes repetitive tasks and shifts employees toward system operation, quality oversight, and continuous improvement. Upskilling programs should include hands-on training in HMI operation, basic troubleshooting, and data-driven decision-making.

For organizations seeking implementation support, a partner with both manufacturing domain expertise and systems integration capabilities can help design pilots, measure impact, and scale successful projects. See the section later in this guide, “How Iottive Pvt. Ltd. Supports End-to-End IoT Productization,” for an example of a partner-led approach to piloting and scaling smart manufacturing solutions.

Leveraging Data Analytics for Informed Decision Making

The strategic value of operational data has made analytics a top investment area for many manufacturers. Research indicates a growing share of companies prioritize analytics within near-term planning cycles as they recognize that connected systems generate high-velocity data streams that require advanced interpretation to deliver business value.

Without an analytics capability, large volumes of sensor and process data remain underused; with analytics, organizations convert raw telemetry into prescriptive actions that improve uptime, product quality, and supply responsiveness.

Real-Time Data Integration and Analysis

Modern data platforms ingest operational information from equipment sensors, vision systems, quality monitors, and material handling devices into unified repositories. A recommended ingestion architecture includes edge buffering and preprocessing, streaming pipelines (e.g., Kafka), time-series databases for telemetry, and cloud storage for historical analysis and model training.

Advanced analysis applies statistical methods, rule-based engines, and machine learning to detect anomalies, predict failures, and identify process optimization opportunities. These capabilities enable predictive maintenance and faster quality issue resolution by surfacing insights to operators and triggering automated workflows.

Typical analytics maturity steps for manufacturers:

  1. Collect: instrument the right sensors and ensure reliable data capture at the edge.
  2. Clean: establish data quality rules, standardize timestamps, and normalize units.
  3. Analyze: apply dashboards, statistical monitoring, and ML models to detect patterns.
  4. Operationalize: integrate insights into MES/ERP, create alerts, and automate corrective actions.

Suggested KPIs and dashboards:

  • Operator view: real-time alarms, asset health score, current throughput, immediate corrective steps.
  • Supervisor view: shift performance, defect rates by line, mean time to detect.
  • Executive view: overall equipment effectiveness (OEE), yield, and supply chain lead-time variance.

Data Governance and Practical Considerations

Define ownership for data sources, retention policies, and data quality SLAs before scaling analytics. Address compliance (local data laws) and cybersecurity controls for telemetry and cloud storage. Choose edge vs. cloud processing based on latency, bandwidth, and cost—edge for millisecond responses, cloud for heavy model training and cross-site correlation.

Micro-case idea: a pilot that layered an anomaly-detection model on top of vibration telemetry reduced average time-to-detect bearing issues from days to hours, allowing scheduled maintenance and preventing line stoppages. Track success with concrete metrics such as mean time to detect, false-positive rate, and % reduction in downtime.

For manufacturers seeking a practical analytics roadmap or a partner to run a pilot, consider vendors and systems integrators with combined experience in industrial data ingestion, cloud computing, and applied analytics solutions.

Addressing Challenges and Ensuring Cybersecurity in Manufacturing

Digital transformation delivers major benefits, but manufacturers must navigate significant challenges to realize them safely. Operational risks — including business disruption from system failures or cyber incidents — top the list of concerns for many organizations, so risk-aware planning is essential before scaling IIoT projects.

Survey figures cited throughout the industry highlight these worries; when using such statistics in the final article, cite the original source and date to provide context for regional or sector differences.

Risk Management and Compliance in Digital Environments

In highly connected factories, cybersecurity and risk management are central to maintaining continuous operations and protecting intellectual property. Increased connectivity increases the attack surface across OT and IT environments, so manufacturers must adopt a defense-in-depth posture.

Practical cybersecurity checklist for manufacturers:

  • Network segmentation and OT/IT isolation to limit lateral movement.
  • Strong identity and access management (least privilege, MFA for critical systems).
  • Encrypted communications for telemetry and remote access.
  • Regular patching and coordinated vulnerability management for both IT and OT assets.
  • Endpoint detection, monitoring, and anomaly detection tuned for industrial protocols.
  • Incident response plan and table-top exercises that include operations and engineering teams.

Recommended compliance frameworks and standards to reference: NIST Cybersecurity Framework, IEC 62443 for industrial control systems, and ISO 27001 for information security management. Start with a gap analysis against one of these standards, then prioritize mitigations that reduce operational risk quickly.

Security ConcernPercentage ConcernedPrimary Impact
Unauthorized Access 55% System compromise
Intellectual Property Theft 47% Competitive disadvantage
Operational Disruption 46% Production stoppages

Workforce Upskilling and Talent Retention

Workforce issues are another major barrier to Industry 4.0 adoption. Manufacturers often lack personnel with combined skills in OT, IT, data analytics, and process engineering. Addressing this requires a structured upskilling program and partnerships that extend internal capabilities.

Practical action plan for workforce readiness:

  • Map job families and identify new roles (data engineer, edge compute technician, ML ops for manufacturing).
  • Create reskilling pathways with short courses, on-the-job training, and vendor-led workshops.
  • Establish apprenticeship or rotation programs so operations staff gain exposure to analytics and automation systems.
  • Measure progress with KPIs: % of staff trained, reduction in mean time to resolve incidents, and time-to-competency for new roles.

Common pitfalls and mitigations:

  • Ignoring OT constraints: involve plant engineers early to avoid unrealistic IT-led changes.
  • Over-centralizing data without edge capabilities: use edge preprocessing for latency-sensitive controls.
  • Underestimating integration effort: budget time for MES/ERP/Maintenance system integration and validation.

Effective risk management goes beyond technology to include supply chain resilience, vendor risk assessments, and contractual safeguards that ensure continuity. For manufacturers without in-house security or analytics expertise, working with experienced systems integrators or managed security providers that understand industrial contexts is a pragmatic path forward.

How Iottive Pvt. Ltd. Supports End-to-End IoT Productization

Iottive Pvt. Ltd. is an end-to-end IoT product engineering company that helps manufacturers and product companies take IoT concepts from idea to market-ready product. Their multidisciplinary teams combine product strategy, hardware engineering, firmware, cloud and edge software, mobile/web apps, testing, and commercialization support to deliver accountable, production-grade solutions.

Services Offered

  • Product ideation & UX: user research, requirement definition, feature prioritization, and prototyping to validate market fit and use cases.
  • Electronics & PCB design: schematic capture, multi-layer PCB layout, component selection, BOM optimization, and DFx reviews to prepare designs for manufacturability.
  • Enclosure & mechanical design: industrial design, CAD, thermal and EMC considerations, and tolerance analysis for robust factory-grade products.
  • Firmware & embedded software: real-time firmware, bootloaders, OTA update frameworks, secure device identity, and edge inferencing support.
  • Mobile and web app development: operator HMIs, mobile supervision apps, and web dashboards with role-based access for operators, supervisors, and executives.
  • Cloud & edge platform integration: secure telemetry pipelines, time-series storage, model training and deployment, and integration with MES/ERP systems.
  • QA, validation & regulatory testing: environmental, EMC, safety testing plans, and support for certifications such as FCC/CE/UL where applicable.
  • Pilot deployments & small-batch manufacturing: pilot site installs, production validation test plans (PVT), test-jig design, and coordination with contract manufacturers.
  • Commercialization & supply-chain support: manufacturing partner selection, vendor onboarding, production BOM finalization, logistics planning, and handoff to scaled manufacturing.

Typical Engagement Workflow

A representative engagement follows a phased workflow designed to de-risk product development and accelerate time-to-market:

  1. Discovery & feasibility: technical and business assessment, user journeys, and success metrics definition.
  2. Prototype & alpha: rapid hardware prototypes (functional boards and enclosures), initial firmware, and a minimum viable cloud/backend plus operator app for validation.
  3. Pilot & integration: deploy pilot units at one or more sites, collect operational data, refine edge/cloud analytics and digital twin models, and complete safety/EMC testing.
  4. Certification & small-batch production: finalize BOM and gerbers, perform DFM/DFX reviews, execute certification testing, and produce a controlled small batch for field validation.
  5. Scale & commercialization: establish contract manufacturing relationships, implement production test plans, support logistics and supply-chain onboarding, and provide maintenance and feature roadmaps.

Key handoffs emphasized during the workflow include BOM optimization and cost-down reviews, DFM/DFX documentation, production test-jig and validation plans, and release artifacts such as firmware images, signed binaries, and cloud deployment manifests.

Typical Deliverables

  • Functional prototype units and test reports
  • Production-ready schematics, PCB gerbers, and a finalized BOM
  • Production validation test plan (PVT) and test-jig designs
  • Stable firmware images and OTA update package
  • Mobile/web applications and operator dashboards
  • Cloud integration scripts, data schemas, and analytics dashboards
  • Certification support documentation and test certificates

The Iottive team structure typically combines hardware engineers, embedded/firmware developers, cloud engineers, data scientists, mobile/web developers, QA/test engineers, and product managers—delivering end-to-end accountability across product, systems, and operations.

Contact Iottive for a free IoT product feasibility review and pilot scoping session to assess readiness, estimated budget, and an initial timeline for a minimum viable deployment.

Conclusion

The consensus among industry leaders is unmistakable: digital transformation represents the definitive path forward for modern production. With 92% of companies recognizing this approach as essential for competitiveness, investment patterns confirm this strategic direction.

The comprehensive benefits span operational efficiency, supply chain resilience, and enhanced product quality. Industry 5.0 frameworks emphasize human-technology collaboration, where advanced systems handle data-intensive tasks while workers focus on creative problem-solving.

This evolution positions forward-thinking companies to thrive in tomorrow’s technology-driven landscape. The integration of intelligent technologies creates sustainable advantages that redefine competitive standards across the industry.

Frequently Asked Questions

What are the primary benefits of implementing IoT in a production facility?

The primary benefits include enhanced operational efficiency, superior product quality, and significant cost savings. IoT enables real-time monitoring of equipment and processes, leading to data-driven decisions that boost overall productivity and resource utilization.

How does machine learning contribute to maintenance strategies?

Machine learning algorithms analyze historical and real-time data from sensors to predict equipment failures before they occur. This predictive maintenance approach minimizes unplanned downtime, extends asset life, and reduces repair costs.

What role do digital twins play in modern industrial operations?

Digital twins create virtual replicas of physical systems, processes, or products. They allow for simulation, analysis, and control, enabling operators to test scenarios, optimize performance, and identify potential issues without disrupting the actual production line.

Why is cybersecurity a critical concern for connected factories?

As facilities become more interconnected through the Industrial Internet of Things (IIoT), they become larger targets for cyber threats. A robust cybersecurity framework is essential to protect sensitive data, ensure operational continuity, and safeguard intellectual property from attacks.

How does data analytics improve supply chain management?

Advanced analytics provide deep insights into supply chain dynamics, from raw material sourcing to final delivery. This visibility helps manufacturers anticipate disruptions, optimize inventory levels, improve logistics, and enhance responsiveness to market changes.

What is the impact of automation on the manufacturing workforce?

Automation transforms the workforce by handling repetitive, manual tasks. This shift allows human workers to focus on more complex, value-added activities like system management, problem-solving, and innovation, necessitating ongoing upskilling and training programs.

How do I choose a partner for IoT product development?

Choose a partner with proven manufacturing domain expertise, full-stack engineering capabilities (hardware, firmware, cloud, apps), strong cybersecurity practices, references or case studies, and established relationships with contract manufacturers and testing labs. Look for clear project governance, transparent cost estimates, and a plan for pilot-to-scale transition.


Book A Meeting

How Smart Parking Systems Are Making Cities Efficient

One evening in Los Angeles, a driver spent 20 minutes circling a single block. That extra time burned fuel
and frayed nerves, mirroring a citywide pattern where cruising makes up about 30% of urban traffic.


Book a call

Modern smart parking systems use sensors, gateways, cloud platforms, and an app to turn live data
into spot availability and short routes. This cuts search time for drivers and trims congestion.

smart parking sensors

The result is both environmental and economic: less cruising means lower emissions and better use of existing
space. Cities can pilot small networks, scale to citywide coverage, and rely on partners like Iottive for BLE apps, cloud integration, and end-to-end solutions.

Key Takeaways

  • Real-time guidance from sensors and apps reduces search time for drivers.
  • Better availability data lowers traffic and cuts fuel use and emissions.
  • Scalable systems let cities grow from pilots to full deployments.
  • Dynamic pricing and demand forecasting improve space utilization.
  • Expert vendors provide integration across devices, cloud, and user interfaces.

The present-day parking challenge in U.S. cities and why it matters now

Cruising for a space now drives measurable congestion, higher emissions, and frustration for city
drivers.

parking

Studies show roughly 30% of urban traffic comes from drivers searching for parking. In one Los Angeles business
district, cruising equaled 38 trips around the globe, burned 47,000 gallons of gasoline, and released 730 tons of
CO2 in a year.

The daily effects are clear. Drivers face longer time spent circling blocks, added stress, and unpredictable trip
times. That frays the user experience and can reduce foot traffic for local businesses.

  1. Traffic and fuel waste: searching parking increases congestion and emissions across metro areas.
  2. City operations: enforcement and revenue collection strain under uneven curb use.
  3. Supply pressure: rising urban populations mean fixed space cannot keep up without better management.

Legacy systems lack live data and transparency. This creates pockets of empty stalls while other blocks
stay full. Modern data-driven systems and digital solutions are now essential to balance demand and guide drivers
quickly to open space.

Issue Legacy systems Data-driven outcome
Visibility No real-time availability Live spot status reduces search time
Enforcement & revenue Manual checks, delays Automated reports, fair billing
Space utilization Uneven use, hotspots Balanced occupancy across areas

What a smart parking system is and how AIoT makes it work

A modern system turns sensors, networks, and cloud logic into an on-demand guide for drivers.

In short: smart parking systems are AIoT platforms that link on-spot detectors, gateways,
cloud analytics, and a user-facing app to show live availability and simplify the journey.

From sensors to smartphones: the end-to-end loop

Sensors and cameras detect occupancy at the curb or lot. Gateways then relay those signals over LoRaWAN, NB‑IoT, or
Wi‑Fi to central cloud services.

Cloud engines fuse raw data, run pattern recognition, and produce real-time availability and short-term forecasts.
The mobile app and web portal present routes, pricing, reservations, and payments in one flow.

  • Accuracy: AI fuses multiple signals to spot anomalies and raise trust in availability.
  • Edge filtering: Local devices aggregate messages to cut latency and lessen cloud load.
  • Reservations & payments: Users can book a spot, navigate to it, and complete checkout
    without leaving the app.
  • Modular rollout: Cities can pilot small zones, reuse legacy meters, and scale coverage as
    demand grows.

Operations teams get dashboards that track KPIs and live status. That same architecture supports
reporting and optimization so operators can tune pricing, enforcement, and space use with real-time data.

AI & IoT smart parking architecture that scales for cities

A layered architecture ties user interfaces, edge devices, and back-end services into a single, scalable
city platform.

User-facing layers: mobile app and web portal

The user layer presents live availability, reservations, pricing, and account tools via a mobile app and web
portal. It guides drivers to an open space, handles payments, and offers operator dashboards for management.

Cloud platforms for real-time processing and storage

Cloud services ingest telemetry, store time-series data, and run ML models for short-term forecasts and alerts.
APIs expose those results so cities and vendors can build further solutions and integrate with transit systems.

Gateways and edge intelligence to reduce latency

Gateways filter messages, normalize payloads, and queue telemetry when backhaul is intermittent. Local edge logic
lowers round-trip time and reduces cloud load, while MQTT is used for efficient publish/subscribe messaging.

On-spot sensors and lot infrastructure

Stall-level sensors, cameras, barriers, signage, and power systems enable real-time operations at scale. Device
twins and autoscaling cloud resources support multi-site deployments, tenant isolation, and the security practices
cities require.

Core IoT sensors that detect vehicle presence accurately

Picking the correct detector mix is the first step to reliable vehicle occupancy data. Different
sensors suit curbside lanes, garages, and open lots. Choice depends on accuracy needs, weather, and installation
cost.

Magnetic, ultrasonic, infrared, radar, and inductive loops

Common field devices include ground-embedded magnetic probes, overhead ultrasonic units, infrared detectors, radar
modules, and inductive loops. Each modality senses a different physical change to detect vehicle presence.

  • Magnetic: senses disturbances in the earth’s magnetic field from a metal mass. Good for
    curbside stalls and low power needs.
  • Ultrasonic: measures acoustic reflections from a vehicle under a canopy or ceiling. Works well
    indoors but needs clear mounting.
  • Infrared: detects heat signatures and works for short-range occupancy checks in controlled
    lighting.
  • Radar: uses radio wave reflections and performs robustly in harsh weather and varied lighting.
  • Inductive loops: count vehicles by measuring changes in inductance at the pavement. High
    accuracy but invasive to install.

Computer vision and occupancy detection cameras

Video with computer vision adds licence-plate capture, lane analytics, and multi-space sensing from a
single device. Modern models tackle occlusion and low-light scenes to estimate which parking spaces are occupied.

Blending sensors and vision improves resilience. Vision fills gaps in sensor fields, while spot
sensors reduce false positives during weather or interference.

Sensor Type Strengths Trade-offs
Magnetic Low power, low cost, good curb accuracy Limited range, ground work for install
Ultrasonic Ceiling-mounted for garage stalls, non-invasive Sensitive to mounting, affected by noise
Infrared Simple heat-based detection, compact Less reliable in variable temperatures
Radar All-weather, long range, robust Higher cost, potential interference
Inductive loop Very accurate per-stall detection Pavement cuts, higher installation effort
Computer vision Multi-space coverage, ALPR, analytics Privacy concerns, bandwidth and compute needs

Calibration, routine health checks, and remote diagnostics keep data accurate over time. Operators should weigh
installation complexity, power draw, and network needs when selecting sensors for garages versus curbside
environments.

Data flow, protocols, and real-time updates that drivers can trust

Reliable data flow is the backbone that turns raw sensor events into timely guidance for drivers.

From LoRaWAN, NB‑IoT, or Wi‑Fi to MQTT and cloud ingestion

Sensors publish occupancy events over LPWAN or Wi‑Fi to local gateways. Gateways forward telemetry to cloud
services using MQTT or HTTPS for low-latency delivery.

Turning raw signals into dependable availability

Cloud pipelines run de-duplication, filtering, and aggregation to convert noisy inputs into a single availability
state per stall.

Confidence scoring fuses sensor and camera signals to reduce false positives and false negatives.

  • Edge inference reduces round-trip time for guidance when drivers approach a destination.
  • Defined SLAs for data freshness keep updates within seconds for high-demand zones.
  • Observability—metrics, traces, and dashboards—verifies correctness and aids troubleshooting.
  • Standardized APIs enable integration with navigation providers, enforcement platforms, and city data hubs.
Stage Function Outcome
Device Detect occupancy events Low-power, local signals
Gateway Normalize and forward Resilient telemetry delivery
Cloud Clean, fuse, score Reliable availability for user displays
Edge Inference and caching Lower latency for guidance

Connected parking analytics: using AI to optimize space and time

Data-driven models convert historical patterns and live feeds into forecasts that guide daily
operations and long-term planning.

Predictive availability forecasts stall occupancy so operators can align staffing, enforcement, and
signage. Drivers gain better confidence about arriving times and likely availability.

Predictive availability and demand forecasting

Machine learning blends time-series and live telemetry to forecast short-term demand by block and hour. That
forecast helps cities reduce cruising and improve space utilization.

Dynamic pricing aligned with live demand patterns

Price signals respond to occupancy to smooth peaks and boost turnover. Dynamic rates increase revenue stability
while keeping access fair near key destinations.

Traffic flow analysis and heatmaps for planning

Ingress/egress counts and curb activity produce heatmaps that reveal hotspots and time-of-day trends. Planners use
these visuals to reallocate curb rules and coordinate with broader traffic flow systems.

  • Definition: application of ML to reveal patterns, forecast occupancy, and optimize space
    utilization.
  • Outcomes: less time searching, lower emissions, and steadier revenue for operators.

AI mobility apps that elevate the driver experience

When discovery, booking, and checkout live in one place, drivers spend less time circling and more time
arriving.

Modern AI mobility apps consolidate discovery, reservations, navigation to parking spots, and
contactless payments into one cohesive flow. Real-time availability detection feeds the map so the user can reserve
a slot and head straight to it with turn-by-turn guidance via Google Maps or Mapbox.

Reservations, navigation, and contactless payments

Secure payment flows support stored methods and fast checkout. Many solutions use Stripe or PayPal for tokenized
cards and digital receipts.

  • Reserve a slot in seconds and store multi-vehicle profiles for quick selection.
  • Navigation hands off to maps for precise routing and ETA updates.
  • Voice search and accessibility options speed discovery in multi-level facilities.

ALPR for seamless entry and ticketless operations

License plate recognition enables automatic gate opens and ticketless billing. Plate recognition
reduces queues at entry and exit and ties sessions to a user account for smooth invoicing.

Predictive guidance suggests arrival windows or nearby alternatives when availability looks tight. Push
notifications and trip history keep the driver informed and in control.

smart parking IoT, AI mobility apps, connected parking analytics

A three-part system links field sensors, a user-facing app, and real-time models to cut cruising and
improve curb use.

The first layer captures ground truth occupancy with on-stall detectors and cameras. This field telemetry gives
operators accurate, second-by-second data for each stall.

The second layer delivers that availability to drivers through a convenient app. Users get turn-by-turn guidance,
reservations, and live status so they arrive with confidence.

The third layer runs models that turn behavior and history into policy. Forecasting and dynamic pricing adjust
rates, curb rules, and signage to match demand.

Feedback loops keep the triad adaptive: user choices feed models, the models update guidance, and
the system tunes supply-side levers like time limits or rates.

Function Input Outcome
Sensing Stall telemetry Accurate occupancy
User layer Real-time availability Faster arrivals, less cruising
Analytics Behavior + history Dynamic pricing, better turnover

Platform interoperability matters. Sharing anonymized feeds with transit, micromobility, and venues supports
coordinated demand management.

KPIs to track include reduced cruising time, higher turnover per stall, revenue per space, and
user satisfaction. Robust privacy, security, and governance keep public trust as deployments scale.

Operational benefits for municipalities, operators, and drivers

Real-time visibility turns scattered curbside activity into clear operational choices for cities and
vendors.

City teams gain centralized dashboards that show occupancy, revenue, and alerts in one view. This improves response
time and helps prioritize maintenance or enforcement without guesswork.

Reduced congestion, fuel use, and emissions

Lower cruising cuts emissions: deployments in busy corridors have shown up to a 40% drop in
vehicle emissions by reducing search time.

Fewer vehicles circling means less fuel burned and lower traffic congestion, supporting municipal climate goals.

Higher space utilization and better parking operations

Higher turnover raises effective capacity so cities get more use from existing assets without new construction.

Better space utilization and targeted pricing increase revenue and save capital and time on expansion projects.

Stronger security and enforcement with real-time alerts

Automated compliance, ALPR, and rule-driven alerts reduce unauthorized use and speed violation handling.

Operators and enforcement teams work from the same evidence, making enforcement fairer and less intrusive for the
user.

Implementation hurdles and how to address them

A clear rollout plan can turn resistance into momentum for citywide deployments. Start with
governance that names roles across departments, operators, and the public. Publish transparent KPIs and a phased
timeline to build trust.

Organizational readiness, cost, and stakeholder buy-in

Mitigate budget concerns with a pilot-to-scale financing model. Use SaaS pricing, hardware leasing, and measured
pilots that show benefits in reduced search time and lower traffic.

Data privacy, correctness, and standard tool availability

Privacy-by-design limits collection, anonymizes records, and enforces retention rules. Maintain
correctness with sensor fusion, routine calibration, and continuous validation so users trust live availability.

Bridging legacy systems and talent gaps

Integrate meters, gates, and back offices via APIs and adapters to avoid rip-and-replace. Close talent gaps through
vendor partnerships and training programs that upskill staff in cloud and edge management.

Practical checklist:

  • Governance, KPIs, and phased rollout plans.
  • Pilot financing and cost-to-benefit tracking.
  • Data minimization, compliance controls, and validation routines.
  • API-led integration and workforce development partnerships.

Business models and revenue levers for smart parking solutions

Monetization mixes subscriptions, device sales, and per-use charges to fund deployments.

Recurring SaaS revenue typically comes from tiered subscriptions for operations dashboards, API access,
and data analytics. Fees scale with deployment size and feature sets, giving predictable income for operators and
cities.

Hardware sales add upfront revenue. Sensors, gateways, meters, and access controllers sell with optional warranties
and maintenance packages to extend lifetime value.

Transaction fees and premium user features drive per-use income. Operators can charge a small percentage on digital
payments, offer fleet accounts, or sell subscriptions for priority access in an app.

Additional levers include dynamic pricing to match demand, short-term space rentals, premium services like EV
charging and valet, and revenue from digital signage and geotargeted advertising.

Revenue Lever Model Typical Outcome
SaaS subscriptions Tiered access, APIs, dashboards Recurring predictable ARR
Hardware & services Device sales, install, maintenance Upfront cash + service margins
Transactions & premium Payment fees, fleet plans, VIP passes Variable, scales with usage
Data & reporting Custom reports, forecasting High-margin enterprise contracts
Demand levers Dynamic pricing, rentals, ads Higher yield per parking space

Integrating with smart city infrastructure and mobility systems

When curb availability feeds traffic centers in real time, signal timing can adapt to reduce congestion. This link
turns stall-level status into actionable control across urban systems.

Data sharing across traffic, public transit, and urban planning

Traffic management platforms ingest stall and garage feeds to avoid spillback and smooth traffic flow. Coordinated
signals and dynamic lane controls keep entry points clear and reduce queuing.

Transit partners receive availability feeds so their app can suggest park-and-ride options when downtown supply is
low. That improves multimodal choices and lowers single-occupant trips.

Planners use longitudinal data to refine curb rules, set price schedules, and allocate accessible space for equity
goals. Heatmaps and KPIs help evaluate policy outcomes over months and years.

Event and interoperability benefits

  • Pre-stage guidance and surge pricing around venues to smooth arrivals and departures.
  • Open standards and APIs prevent vendor lock-in and enable city-wide solutions to interoperate.

From MVP to full rollout: a practical development roadmap

Begin pilots with a narrow zone and a tight scope to prove value quickly. Start by validating core
features that matter most to drivers and operators: live availability, reservations, and secure payments. Use a
single lot or a short curb corridor to collect real-world data and KPIs.

Defining scope, UX, and core features for a pilot

Define clear KPIs—reduce time to find parking, increase adoption, and meet accuracy targets.
Design the user flow so discovery and booking take seconds. Test a lightweight mobile app with real users and
iterate on UI based on session metrics and surveys.

AI model integration, payments, and security hardening

Choose detection models like YOLO or MobileNet for stall-level inference and forecasting. Host
model training and deployment on AWS, Azure, or GCP and monitor drift with MLOps tools.

Integrate mapping (Google Maps or Mapbox) and payments (Stripe or PayPal). Enforce PCI compliance, use OAuth 2.0
and JWT for identity, and apply data minimization across the lifecycle.

Scaling, monitoring, and continuous improvement

Move from pilot to production using containerization (Docker) and orchestration (Kubernetes). Implement CI/CD
pipelines for safe releases and automated tests.

Set up observability, SLOs, and incident response. Use analytics to collect feedback and run iterative releases
that improve accuracy, uptime, and user satisfaction.

Feature set and tech stack to build a future-ready parking platform

A clear feature plan and a modular stack let cities deliver reliable curb services today and scale
tomorrow.

Must-have features include real-time availability, stall-level occupancy detection, reservations,
contactless payments, and ALPR for ticketless entry. Add account management, billing, and robust reporting so
operators can do day-to-day management with confidence.

Advanced capabilities lift the user experience: AR indoor guidance for garages, conversational
chatbots for support, ML demand forecasting, and anomaly detection to catch fraud or sensor drift. Include computer
vision where wide-area sensing or plate recognition adds value.

Recommended modular stack

Layer Examples Notes
Client React Native, Flutter, Swift, Kotlin mobile app + web UI
Backend Django / Node.js, PostgreSQL, MongoDB API-first, multi-tenant
ML & Edge TensorFlow, PyTorch, MQTT, edge Python computer vision, forecasting
Cloud & DevOps AWS/Azure/GCP, Docker, Kubernetes, Jenkins scalable, observable

Security &ops demand OAuth/JWT, SSL, cert management, encrypted OTA updates, and PCI-compliant
payment flows (Stripe/PayPal). Test performance under event surges and multi-lot scale to ensure uptime and smooth
user experience.

About Iottive: your partner for end-to-end IoT, AIoT, and mobile parking solutions

Iottive’s engineering teams focus on secure, scalable platforms that
fuse device telemetry with clear user flows.
The company builds BLE-enabled mobile solutions, cloud
integration, and custom hardware to help cities and operators manage curb and lot space more effectively.

Expertise in BLE app development and cloud integration

Iottive delivers rapid prototypes and MVPs that reduce
risk and speed time-to-value. Their teams craft BLE app experiences, APIs, and back-end services that turn sensor
signals into actionable status for drivers and operators.

Industries served

  • Healthcare
  • Automotive
  • Smart Home
  • Consumer Electronics
  • Industrial IoT

Get in touch

Visit: www.iottive.com | Email: sales@iottive.com

Conclusion

A focused deployment that ties sensors to user guidance can quickly prove value for drivers and operators
alike.
AIoT-powered smart parking aligns real-time sensing, routing, and forecasting to cut
cruising, lower emissions, and save time.

Across stakeholders the benefits are clear: less time to find a spot for drivers, higher utilization and revenue
for operators, and reduced congestion for cities. Durable impact requires scalable systems,
privacy-by-design, and integration with broader city infrastructure.

Start with a narrow MVP, measure KPIs, and iterate using live data and user feedback. For end-to-end support—from
sensors to mobile and cloud—engage expert partners like Iottive: www.iottive.com
| sales@iottive.com. They help cities deliver robust
solutions that reclaim curb space and improve daily life.

FAQ

What problems do modern cities face with on‑street parking and why act now?

Urban areas in the U.S. face rising vehicle counts, limited curb space, and unpredictable demand. These issues increase search time, congestion, emissions, and lost revenue for cities. Deploying availability detection and real‑time guidance reduces cruising time and improves curb management, making traffic flow smoother and streets safer.

How does an end-to-end system detect and show available spaces to drivers?

Sensors at the curb or in lots detect vehicle presence and send signals via low‑power networks or Wi‑Fi to gateways. Edge processing filters data, then cloud services aggregate and publish availability to mobile and web interfaces. The loop closes when navigation or reservation features direct drivers to the confirmed spot.

Which on‑spot detection technologies are most reliable for occupancy sensing?

Inductive loops, magnetic sensors, ultrasound, and radar provide robust presence detection in many settings. Camera‑based computer vision adds plate recognition and lane‑level accuracy. Choosing the right mix depends on installation cost, lighting, weather, and desired features like ALPR.

What communication protocols keep real‑time updates dependable?

Networks such as LoRaWAN and NB‑IoT offer long range and low power for sensors, while Wi‑Fi and LTE support higher throughput. MQTT and HTTPS move telemetry to cloud platforms, where APIs feed apps with low latency and high availability for drivers and operators.

How do analytics and machine learning improve space utilization?

Historical occupancy and transaction data let models predict peak demand, forecast availability windows, and suggest dynamic pricing. Heatmaps and flow analysis reveal bottlenecks so cities can reallocate curb space, adjust signage, and optimize enforcement for better utilization.

What user features should a driver expect from a modern mobility app?

Core features include live availability maps, turn‑by‑turn navigation to reserved or nearest space, contactless payment, and booking. Advanced functions add estimated time to spot, expansion of AR guidance, and automated entry/exit via license plate recognition for ticketless operation.

How does license plate recognition (ALPR) enhance operations?

ALPR automates entry, exit, and payment reconciliation, reducing queuing and manual checks. It supports permit checks, enforcement alerts, and event management. Proper privacy controls and secure storage are essential when using plate data.

What operational benefits do cities and operators gain after rollout?

Benefits include reduced congestion and emissions, higher turnover and revenue from better utilization, faster enforcement with real‑time alerts, and improved traveler satisfaction. Data also supports long‑term planning and coordination with transit and traffic systems.

What common implementation hurdles should be expected and how can they be mitigated?

Challenges include upfront hardware cost, stakeholder alignment, integration with legacy systems, and data governance. Start with a focused pilot, define clear KPIs, choose interoperable standards, and set privacy policies to build trust and measure value before scaling.

Which business models make deployments financially viable?

Typical models combine SaaS subscriptions for software, hardware sales or leases, transaction fees for payments, and premium services like analytics. Dynamic pricing, reserved spaces, and advertising also create recurring revenue streams for operators and municipalities.

How do you ensure data privacy and accuracy in these systems?

Implement encryption in transit and at rest, role‑based access, and data retention limits. Validate sensor feeds with cross‑checks—camera verification or loop sensors—to reduce false positives. Regular audits and transparent privacy notices help maintain compliance and public trust.

How do these systems integrate with broader city mobility and traffic platforms?

Use open APIs and standardized data formats to share availability, demand forecasts, and curb usage with transit agencies and traffic management centers. Shared datasets enable coordinated signal timing, multimodal routing, and smarter curb allocation across agencies.

What roadmap steps deliver a successful pilot to full city rollout?

Start by defining scope, user experience, and KPIs for a small area. Deploy sensors and a minimal app with reservation and payment. Integrate edge filtering and cloud analytics, then iterate on ML models and security. Scale by expanding geographies, adding features, and automating operations.

What core features and tech stack are recommended for a future‑ready platform?

Must‑have features include real‑time availability, reservations, and payments. Recommended stack: resilient sensors, edge gateways for preprocessing, cloud platforms for storage and ML, MQTT/REST APIs, and mobile/web front ends. Add monitoring, DevOps, and fraud detection for reliability and security.

Which industries and use cases benefit from this technology beyond municipal curb management?

Commercial operators, airports, hospitals, retail centers, and campuses gain from reduced search time, better revenue capture, and improved user experience. Industries like automotive and logistics use these systems for fleet routing and loading zone management.

Who can enterprises contact for end‑to‑end product and integration services?

Look for firms with experience in BLE apps, cloud/mobile integration, hardware design, and custom deployments. Check vendor portfolios for cross‑industry projects in healthcare, automotive, and industrial IoT, and request references to verify delivery and support.


Let’s Connect

From Step to Stat: Smart Shoes That Redefine Running Analytics

smart shoes

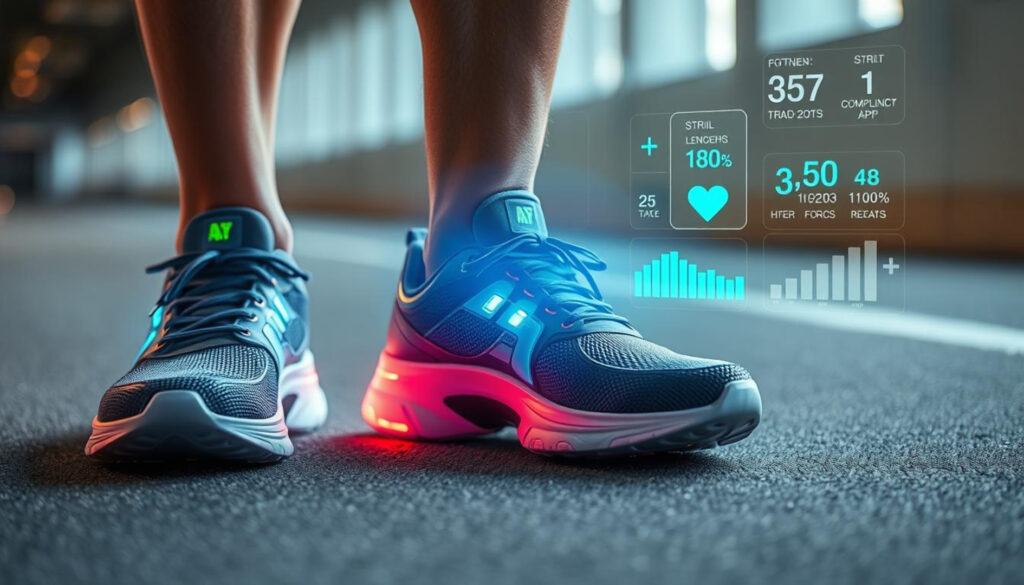
On a humid morning in Boston, a coach handed a novice a pair of smart shoes and a phone app. The
runner laughed at first, then paused at the first report. Within a mile, stride gaps and pressure points showed up
as clear, usable analysis.

That small moment shows how modern shoes translate each step into meaningful
data. Embedded sensors like accelerometers, gyroscopes, and pressure arrays feed
lightweight Bluetooth LE links. The result is fast syncing and long battery life.

Today’s category bridges performance needs and health use cases. From gait deviation detection to rehab tracking,
the tech helps athletes and patients alike. This section previews product features, buyer criteria such as battery
life and app quality, and market trends.

Iottive brings expertise in BLE app development and cloud
integration for device makers. For product integrations and custom platforms, visit www.iottive.com or email sales@iottive.com.

Key Takeaways

  • Embedded sensors turn steps into actionable analysis for users.
  • Bluetooth LE enables efficient, real-time syncing with apps.
  • Design choices—battery, comfort, and app UX—drive buyer value.
  • Use cases span performance coaching to medical monitoring.
  • Look for solutions that balance specs with everyday usability.

Why Smart Running Footwear Matters Now

Advances in sensor accuracy have turned everyday footwear into a real-time movement lab.

Modern shoes capture subtle motion and pressure signals that help runners improve efficiency and
cut injury risk.

Smartphone ubiquity makes setup and syncing simple. That means more users get immediate cadence cues, pace nudges,
and form alerts while they train.

footwear analysis

Behind the scenes, better sensors and refined algorithms translate raw signals into clear
analysis. Runners see actionable tips mid-run or a concise report after finishing.

The same data foundation supports practical health features: temperature or pressure warnings can flag a developing
sore or ulcer early.

Today’s value is in usable insights, not generic step counts. Reliable Bluetooth links, accurate timing, and
contextual feedback separate helpful products from gimmicks.

Iottive builds Bluetooth-enabled app and cloud pipelines that lift the UX of this technology
without compromising comfort or durability.

  • Actionable in-ride guidance and post-run reports
  • Health alerts layered on performance tracking
  • Reliability and fit remain non-negotiable

IoT Smart Shoes Buyer’s Guide: Features That Provide Real-Time Value

Choosing the right feature set starts with understanding which sensors deliver real-time benefits
you’ll actually use. Focus on what improves gait insight, comfort, and timely feedback.

Must-have sensors: Pressure arrays map contact timing and load distribution. IMUs (accelerometers
and gyros) track motion, cadence, and stride length. Temperature sensors flag hot spots that may indicate
inflammation or ulcer risk.

Sensor fusion blends these inputs to improve gait monitoring. Fusion reveals pronation patterns, ground contact
time, and subtle asymmetries that single signals miss.

  • Connectivity vs. battery: Bluetooth LE gives low power and steady mobile syncing. Wi‑Fi offers
    more bandwidth but drains batteries faster and complicates pairing.
  • Battery trade-offs: Duty cycle, sampling rate, and on-shoe processing drive autonomy. Local
    processing extends life versus continuous streaming.
  • Comfort and durability: Look for robust insole layers, encapsulated electronics, and flexible
    interconnects that preserve comfort.

buyer guide sensors

Feature Benefit Trade-off When to pick
Pressure arrays Contact timing & load maps Added cost, placement sensitivity Injury prevention, gait monitoring
IMU (accel + gyro) Motion, cadence, stride data Sampling affects battery Form coaching, cadence feedback
Temperature sensor Localized inflammation cues Requires calibration, privacy rules Health monitoring, diabetic care
Bluetooth LE vs Wi‑Fi Mobile pairing vs bandwidth Power vs data rate Daily use vs high-data labs

Test onboarding, pairing, and firmware updates. Check privacy settings for health features. Iottive’s BLE app
development and cloud integration expertise helps brands balance connectivity, battery autonomy, and user experience
to maximize long-term value.

Product Roundup: Best IoT Smart Shoes for Running Performance

A hands-on product roundup helps buyers match sensor depth to training goals and budget.

smart shoes performance

Top picks span clinical platforms like Pedar and F-Scan to wearable systems such as Moticon
OpenGo. Pedar and F-Scan offer dense pressure arrays and high sampling rates for clinical-grade analysis. Moticon
prioritizes wireless convenience and easier field use.

Top running picks with stride, ground contact time, and form analysis

Choose based on what you need: high sampling for precise ground contact time or on-shoe processing for real-time
form cues. Higher sample rates improve interval feedback but reduce battery life.

Smart insoles vs. fully integrated options

Insoles retrofit many shoes and deliver detailed pressure maps. Integrated designs win on ergonomics and seamless
tracking during long runs.

Solution Strength Trade-off Best for
Pedar Calibrated pressure arrays Higher cost, lab focus Clinical gait labs
F-Scan High sampling fidelity Complex setup Research & rehab
Moticon OpenGo Wireless autonomy Lower sensor density Field testing & athletes
Consumer insoles Easy retrofit Variable durability Data-curious runners

Selection tip: test fit alignment, check firmware cadence, and favor products with stable apps and
reliable BLE/mobile-cloud stacks. Iottive supports teams
building these pipelines to speed go-to-market and lift long-term user value.

Connected Running Analytics: What Data Runners Actually Use

Not every metric is equally useful. Runners and coaches focus on a short list that changes
training and prevents injury.

Key gait metrics are cadence, stride length, ground contact symmetry, and pronation tendencies. These
numbers show form, reveal imbalance, and guide shoe choice or drills.

gait

Stride, cadence, pronation, and pressure maps for injury prevention

Pressure and IMU data map foot loading and cadence. Pressure maps expose hotspots that often match overuse risks.
Those maps help decide insoles, shoes, or technique tweaks.

Training load, recovery, and calories burned accuracy

Training load blends session intensity, volume, and impact surrogates to suggest recovery windows. Calories burned
vary by model; consistency beats raw accuracy for trend tracking.

  • Actionable insights: cadence nudges, midfoot strike cues, and asymmetry alerts after injury.
  • Watch contact time and vertical oscillation for fatigue signals during a run.
  • Validate new metrics against perceived exertion and race results.

Iottive’s mobile-cloud integration delivers clean dashboards and trend visualizations so users act
on analysis without overload. Keep sensors calibrated and alerts context-aware to preserve trust in the data.

AI Sports Footwear Innovations Shaping the 2020s

Putting models on the insole changes how systems balance latency, battery life, and personalization. Designers must
choose between instant, on-device cues and richer cloud-based profiling.

On-shoe inference gives near-zero delay for coaching cues. It reduces uplink needs and protects
short-term privacy. Cloud analysis enables deep personalization and long-term trend models that adapt to a
user over weeks or months.

How deep learning reads motion

Multivariate models fuse accelerometer and pressure streams to classify gait, flag anomalies, and estimate injury
risk. Sampling rates and chosen features directly affect model accuracy and power draw.

Approach Benefit Cost Best use
On-device inference Low latency, instant cues Higher local compute, power use Real-time coaching
Cloud analytics Deep personalization, large models Latency, bandwidth needs Long-term trend analysis
Hybrid updates Firmware model refreshes Complex deployment Balance reliability & improvements
Energy-harvesting systems Extended autonomy Added hardware complexity Low-power, long-term use
  • Privacy by design limits raw data transfer and uses on-device summaries.
  • Personalization loops build baselines to refine fatigue and asymmetry thresholds.
  • Fail-safes revert to rule-based cues when model confidence is low.

Iottive builds embedded inference and cloud pipelines that match model placement to battery and performance goals,
while keeping firmware updates and user privacy front of mind.

Inside the Tech: Sensors, Connectivity, and Energy in Smart Shoes

Sensor choice and system design determine how well a product turns motion into useful signals.
Engineers must balance sensitivity, durability, and power to support accurate monitoring without bulky
batteries.

Pressure sensing options

Pressure arrays come in four common types: piezoresistive, capacitive, piezoelectric, and resonant. Piezoresistive
sensors are cost-effective and simple to read but drift over time.

Capacitive types offer higher sensitivity and lower drift but need careful encapsulation. Piezoelectric sensors
suit dynamic loads; resonant elements give high fidelity in labs yet raise integration cost.

IMUs for motion intelligence

IMUs merge accelerometers and gyroscopes to detect steps, orientation, and stride dynamics. Axis alignment and
mounting repeatability are critical to reliable data.

On-device fusion reduces uplink needs by extracting step events and features before wireless transfer.

Temperature and sweat biosensing

Temperature options include RTD, NTC, thermocouple, IR thermopile, and digital ICs. IR sensors can be useful when
contact is inconsistent.

Sweat biosensors can hint at hydration or glucose trends but require calibration and comfort-aware placement for
valid health signals.

Connectivity and energy realities

Bluetooth LE is the common link for low-power data transfer. Designers must handle packet
loss, burst buffering, and sync strategies during intense sessions.

Energy harvesting—mechanical-to-electrical—can extend battery life but complicates hardware and cost. Firmware
power modes, compression, and edge feature extraction deliver the best autonomy per gram of battery.

Mechanical and lifecycle considerations

Use flexible PCBs, robust encapsulation, and strain relief to survive repeated loading and moisture. Component
choices affect maintenance, warranty costs, and long-term value.

Iottive’s BLE app development and hardware-software integration expertise helps teams achieve
robust syncing, low-latency telemetry, and efficient battery usage across these trade-offs.

From Adidas “1” to AIoT: The Evolution of Smart Footwear

A. The journey from microprocessor cushioning to full-stack personalization spans two decades of hardware and app
milestones.

In 2005, the Adidas “1” introduced microprocessor-controlled cushioning and proved consumer footwear could embed
real control logic. By 2012, Nike+ used smartphones to scale tracking to millions and normalized app-driven
experiences.

In 2016 Under Armour added built-in tracking to mainstream models, tightening the link between sensors and daily
use. The 2020s brought deeper machine learning, broader device ecosystems, and device-grade health features.

Key shifts include component miniaturization for comfort, BLE standardization for reliable
pairing, and firmware updates that extend product life. Community data now refines models and guides product
updates.

  • Trace: from cushioning control to sensor-rich platforms
  • Scale: smartphone adoption unlocked cloud services and better apps
  • Future: healthcare validation and sustainability will shape new milestones
Milestone Year Impact
Adidas “1” 2005 Introduced on-device control for comfort
Nike+ 2012 Made phone-linked tracking mainstream
Under Armour smart models 2016 Embedded sensors in consumer lines
AIoT era 2020s Personalization, health features, and OTA model updates

Iottive helps brands modernize legacy concepts with today’s BLE, machine learning, and cloud
stacks to deliver reliable, wearable technology experiences that users trust.

Healthcare-Grade Smart Footwear: Beyond Fitness Tracking

Healthcare teams increasingly rely on localized pressure and temperature readings
to guide care for vulnerable feet. Precise deltas in load and warmth can flag early tissue stress and reduce ulcer
risk in diabetes through timely intervention.

Rehabilitation use cases include step-quality scoring, asymmetry detection, and adherence tracking
that clinicians review remotely. IMU thresholds and pattern recognition enable reliable fall detection and
real-world event capture for older adults.

Clinical deployment needs documented repeatability, validated accuracy, and clear protocols for data handling.
Privacy, consent, and secure transmission are essential to preserve patient trust and meet regulatory guidance for
health monitoring.

  • Integration: EHR and telehealth dashboards allow remote clinician review and
    clinician-configured alerts.
  • Wearability: Comfort, washable encapsulation, simple charging, and long battery life drive
    long-term adherence.
  • Accessibility: Large-text interfaces, voice prompts, and caregiver notifications improve
    outcomes for diverse users.

Design note: durable, repeatable sensors and validated analysis are prerequisites before clinical use.
Iottive’s IoT & AIoT Solutions and compliance-aware cloud integration support healthcare-grade deployments that
prioritize data privacy, reliability, and clinician workflows.

Industrial and Occupational Use Cases for Smart Shoes

Workplace movement data turns everyday tasks into measurable signals that safety teams can act on.
In construction, logistics, and manufacturing, pressure and motion streams reveal risky patterns such as
overreaching, twisting, or long static loading.

Ergonomics monitoring, posture insights, and worker safety

Pressure maps and IMU-derived features detect prolonged time on feet and unsafe postures. Those signals feed
role-based dashboards so supervisors and individuals see different views of the same data.

Practical outcomes include fewer musculoskeletal injuries, smarter task allocation, and targeted training
programs that reduce strain. Operations teams use these insights to improve scheduling and reduce overtime fatigue.

  • Rugged design: slip resistance, sealed sensors, and impact-rated housings for real sites.
  • Operational needs: shift-long battery life, reliable syncing in RF-noisy environments, and
    fleet firmware management.
  • Policy: clear privacy, consent, and labor rules to protect workers and maintain trust.

Iottive delivers custom systems and mobile dashboards that turn
movement signals into safety and productivity insights. Framing benefits as cost savings and reduced incident rates
helps win support from safety and operations leaders in the market.

Mainstream Market Snapshot: IoT smart shoes, AI sports footwear, connected running analytics

The consumer market is moving fast. North America leads adoption while APAC growth is picking up as incomes rise
and more people move to cities.

Buyers want three things: simple setup, dependable syncing, and clear everyday insights. Social features like
challenges and shared milestones boost engagement and retention.

Platform ecosystems that link shoes, watches, and fitness apps make products stickier. Price tiers are emerging:
entry-level trackers, mid-range lifestyle models, and premium analytics systems for serious users.

Retail and e-commerce education reduces returns by setting fit and feature expectations.
Durability, transparent warranty terms, and visible firmware support give shoppers confidence.

Consumer Need Why it Matters How Brands Win Example KPI
Easy pairing Reduces setup friction Robust BLE apps, clear guides First-run success rate
Social sharing Boosts motivation Integrated leaderboards Monthly active users
Privacy & updates Builds trust Transparent settings, firmware roadmap Churn rate
Durability & warranty Drives purchase confidence Longer warranty, rugged design Return frequency

Iottive partners with consumer brands to scale
mainstream-ready platforms with dependable BLE apps and mobile-cloud pipelines. Clear data controls and influencer
outreach help normalize these products in daily fitness routines.

Smart Shoe Market Outlook: Size, Segments, and Growth

Two headline forecasts highlight how assumptions change projections for the next decade.

Market size and CAGR through 2032

One estimate values the market at USD 155M in 2023, growing to USD 270.9M by 2032
at a 6.40% CAGR (2024–2032).

Another study projects a larger expansion: from USD 269M in 2023 to USD 2.1B by
2033
at a 22.7% CAGR. These gaps show why methodology and scope matter for any market forecast.

Segment leaders and user mix

Running products hold the largest share, and male end-users lead adoption and spend. Price tiers—from basic
trackers to premium platforms—shape who buys and why.

Drivers, restraints, and ecosystem opportunities

Health awareness, habitual fitness tracking, and richer app ecosystems drive demand. Key restraints include
hardware durability, sensor reliability, and ongoing software maintenance.

  • Opportunities: interoperable ecosystems that link apps, watches, and cloud analysis.
  • Regional note: North America leads now; APAC is the fastest-growing market.
  • Design priorities: comfort, battery life, accurate metrics, and clear consumer value.

Iottive helps brands capture growth with scalable mobile-cloud backends, BLE apps, and custom product
development that align features to segment needs and support robust analysis at scale.

Regional Insights: Where Adoption Leads and Why

Where consumers live and shop matters as much as what a product can measure. North America leads the market thanks
to deep fitness ecosystems, broad retail distribution, and strong mobile infrastructure.

APAC is the fastest-growing region. Urbanization, rising disposable income, and wide e-commerce reach push demand
for entry models that scale quickly.

Europe balances growth with strict data rules. Consumers expect wellness features, clear privacy controls, and
regional certification before trust builds.

  • Localization: language, sizing standards, and privacy norms change product expectations and UI
    needs.
  • Partnerships: local retailers and running communities speed adoption through demos and trials.
  • Logistics & support: reliable after-sales, repair networks, and warranty plans reduce
    returns and boost lifetime value.

Price sensitivity in emerging markets favors simpler entry models, while mature markets pay for richer analysis and
integration. Regulatory nuances for health-leaning features affect rollout timing and required clinical evidence.

Iottive supports localized app rollouts and regulatory alignment across North America, Europe, and
APAC to help brands stagger features and scale by region.

Integration Playbook: Bringing Footwear, Apps, and Cloud Together

Bridging on-device firmware with cloud services is what turns prototypes into reliable products. A clear
architecture keeps teams aligned and reduces field issues.

BLE app development and mobile-cloud pipelines

Map the stack: on-shoe firmware → BLE transport → mobile SDK → cloud analytics and secure APIs. Tune connection
intervals, MTU, and buffering to balance power and throughput.

Design mobile-cloud pipelines that convert raw packets into indexed features for fast analysis and long-term trend
models. Add clock-drift correction, loss recovery, and telemetry quality checks.

Data privacy, security, and compliance for consumer health data

Encrypt in transit and at rest, enforce role-based access, and define retention policies for
health-adjacent records. Use consent flows, granular permissions, and transparent policies as default.

Area Best practice Why it matters Example KPI
BLE transport MTU tuning & reconnection logic Stable syncing, lower drops Pair success rate
Telemetry Time sync & buffering Accurate analysis Packet loss %
Security Encryption & access control Regulatory compliance Audit pass rate
Delivery CI/CD for app & firmware Safe rollouts Crash-free sessions

Iottive specializes in BLE app development, cloud & mobile integration, and end-to-end
solutions that link devices, systems, and user experience. For platform support and integration smart services,
contact www.iottive.com or sales@iottive.com.

User Experience Meets Biomechanics: Designing for Comfort and Insight

Designing a product that people wear every day starts with balancing human comfort and precise
biomechanics. Good material stacks preserve sensor fidelity while keeping the insole soft and supportive.

Material choices, insole design, and sensor placement

Layer cushioning to isolate sensors from shear while maintaining normal pressure patterns under
the foot. Use thin, durable encapsulation over pressure arrays to prevent drift and protect electronics
from moisture.

Place arrays under the heel and forefoot and mount IMUs on a stable midsole region to capture repeatable motion
patterns. Offer trim lines on insoles so sizing matches anatomical landmarks.

Reducing friction: charging, updates, and pairing reliability

Favor ergonomic charging—wireless pads or pogo pins that align easily—and OTA firmware that resumes after
interruption. Build pairing flows that handle interference, re-authentication, and multi-device scenarios to keep
the user experience smooth.

Area Design choice User benefit
Material stack Encapsulated cushion layers Comfort + sensor fidelity
Sensor layout Heel/forefoot arrays, midsole IMU Repeatable pressure & motion patterns
Charging & OTA Wireless/pogo + resumable updates Higher compliance, low disruption

Iottive helps teams prototype UX flows that balance biomechanics accuracy with everyday
convenience. Test across diverse users to validate insight clarity and long-term hygiene of the platform.

Challenges to Watch: Fit, Complexity, and Cost vs. Value

Product teams often discover that every added capability brings trade-offs in fit, assembly, and price. Design
choices can erode comfort and push a product above its target price if not carefully scoped.

Compute and sensor selection affect the bill of materials, manufacturing steps, and serviceability. High-sample
sensors and on-device inference raise component cost and test complexity, increasing returns risk when pairing or
updates fail.

Field validation is essential: lab results must translate into user-perceived benefits in real
conditions. Without robust trials, market claims on accuracy and analysis become a liability, not an advantage.

  • Value-first roadmap: start with reliable core metrics, then layer advanced insights that users
    actually use.
  • Modularity: design replaceable modules to simplify repairs and extend product life.
  • Regulatory & privacy: health-leaning features add overhead for compliance and secure data
    handling.
  • Supply chain: specialized sensors and flexible electronics require vetted suppliers to avoid
    delays and quality issues.

Iottive’s end-to-end approach helps teams de-risk complexity, optimize BOM, and align features to user
value. Transparent marketing and continuous feedback loops keep expectations realistic and improve
long-term product trust in the market.

Partner with Iottive to Build Your Next Smart Shoe Platform

Brands accelerating from prototype to production rely on partners who can own firmware, mobile, and cloud
workstreams.

Iottive delivers end-to-end support for smart shoe projects. Our services cover firmware, mobile
SDKs, analytics pipelines, and admin portals. We focus on stable connectivity, battery-friendly
telemetry, and dependable OTA updates.

We offer co-design on sensor selection, placement, and calibration so gait and health analysis are
reliable in real use. Workflows include PoCs, pilot programs, and scaled rollouts with observability built-in.

  • Integration: firmware → BLE transport → mobile SDK → cloud APIs
  • Compliance: security and privacy frameworks for consumer and healthcare-grade data
  • Platform links: Apple Health, Google Fit, and third-party training integrations
Block What we deliver Benefit When to engage
Firmware Low-power sampling & feature extraction Longer battery life, robust telemetry Prototype → pilot
Mobile SDK Pairing flows & UI components Higher first-run success, lower churn Pre-launch & updates
Cloud & Admin Dashboards, device fleet management Operational visibility, secure storage Pilot → scale
Validation Sensor calibration & clinical-grade testing Trustworthy metrics for users and clinicians Health market entry

We draw on experience across Healthcare, Automotive, Consumer Electronics, and Industrial systems to reduce
time-to-market. Expect measurable outcomes: improved user retention, fewer pairing failures, and lower return rates.

Get started: schedule a discovery session or scoping workshop at www.iottive.com or email sales@iottive.com. Partner with Iottive to turn device concepts into
market-ready products that users trust.

Conclusion

strong, The latest platforms focus on usable metrics, reliable pairing, and long-term value for
users in the evolving market for smart shoes.

Modern shoes convert each step into clear analysis that improves training and lowers injury risk. Integrated
sensors capture pressure, IMU motion, and temperature, then turn raw data into timelier cues.

Buyers should weigh sensor fidelity, connectivity and battery life, comfort, and app quality when comparing
footwear. AI helps personalize guidance, while healthcare and industrial uses prove the tech’s reach beyond simple
fitness tracking.

Fit, cost, and system complexity remain real constraints. Choose products with robust firmware, strong privacy
policies, and ecosystem interoperability. For platform design, trials, or scaled rollouts, contact Iottive: www.iottive.com | sales@iottive.com.

FAQ

What key metrics do these intelligent running shoes track?

Most models measure cadence, stride length, ground contact time, and pressure distribution. Many also add IMU-based motion data (accelerometer and gyroscope) for gait and pronation analysis, plus temperature or sweat sensing for basic health signals.

Which sensors should I look for when buying performance-focused footwear?

Prioritize pressure sensors, an IMU suite (accelerometer and gyroscope), and a reliable temperature sensor. These give the core inputs for gait analysis, load monitoring, and early signs of overheating or localized pressure that can lead to injury.

How do connectivity choices affect battery life and data quality?

Bluetooth Low Energy (BLE) conserves power and works well for live sync to phones. Wi‑Fi moves larger datasets faster but drains battery sooner. On‑shoe processing reduces wide data transfers and saves energy, while cloud uploads enable deeper analytics at the cost of more frequent syncing.

Are integrated sensor shoes better than sensor insoles?

Integrated shoes offer seamless data capture and consistent sensor placement, improving reliability. Insoles are modular and cost-effective, letting you upgrade existing footwear. Choose based on budget, desired durability, and whether you need multi‑shoe flexibility.

How accurate are calorie and training load estimates from footwear?

Estimates vary by algorithm and sensor quality. When motion data is combined with individual metrics (weight, age, VO2 estimates), accuracy improves. Expect close approximations for activity-based calories but some variance for metabolic rate estimates compared with lab tests.

Can these products help prevent injuries?

Yes. Pressure maps, asymmetry detection, and abnormal gait alerts can identify risk patterns early. Paired with coaching features that suggest cadence changes or strength work, they support injury prevention but don’t replace professional medical advice.

Do on‑shoe AI features work without internet access?

Some shoes run inference on-device for latency‑sensitive feedback, so basic coaching and alerts work offline. Advanced personalized models and long‑term trend analysis often require cloud connectivity to process larger datasets.

What are the practical maintenance and durability concerns?

Expect to manage battery charging, firmware updates, and occasional sensor recalibration. Water resistance, sole wear, and connector longevity matter—choose brands known for build quality and clear maintenance guidance.

How is health data protected when apps sync with cloud services?

Look for end‑to‑end encryption, clear privacy policies, and compliance with regional health data standards like HIPAA where applicable. Reputable vendors publish security practices and allow users to control data sharing.

Which brands have led the evolution of intelligent footwear?

Major milestones include Adidas’s early connected models, Nike’s fuel‑tracking efforts, and Under Armour’s partnerships around wearables. Today, several athletic and medical device companies advance on‑shoe sensing and analytics.

Are there clinically validated options for medical use?

A few systems target clinical markets with validation studies, particularly for diabetic foot care and rehabilitation. For medical applications, choose devices with peer‑reviewed evidence and regulatory clearances.

How should developers integrate shoe data into mobile and cloud platforms?

Use BLE for near‑real‑time sync, implement robust mobile SDKs, and design a scalable pipeline to cloud analytics. Prioritize low‑power data formats, user consent flows, and secure storage for personal health metrics.

What performance trade-offs exist between comfort and sensing capability?

Adding sensors, batteries, and rigid housings can affect fit and weight. The best designs place sensors to minimize pressure points and use lightweight power systems to preserve comfort while retaining accurate measurements.

How do temperature and sweat sensors add value beyond motion data?

Thermal and moisture signals help detect overheating, localized inflammation, or blister risk. Combined with pressure maps, they enrich context for injury prevention and recovery monitoring.

What should a buyer consider about price versus features?

Match features to goals: casual runners need basic cadence and distance; competitive athletes benefit from detailed ground contact and form analytics; clinicians require validated metrics. Higher price often buys durability, better sensors, and stronger app ecosystems.

IoT: Perfect Solution for Healthcare Systems

A short story: At a busy U.S. hospital, a nurse once rushed between floors hunting for a vital
infusion pump. A real-time tag pinged from a laptop, and the pump was found in minutes. That small win turned a long
delay into immediate care.

This guide explains how connected sensors, devices, and platforms turn real-time clinical and operational
data into safer, higher-quality patient care. You will learn foundational concepts, reference architectures, and
high-value use cases that matter to American providers.

We describe RTLS with BLE, RFID, and Wi‑Fi, plus environmental monitoring and wearables that capture vitals. Cisco
Catalyst and Meraki access points can act as gateways, helping centralize device visibility and alerts across sites.

Why now: Aging populations, rising chronic disease, and staffing gaps push hospitals to adopt
resilient, network-friendly technologies that scale. This section sets the stage for practical steps to improve
outcomes, speed interventions, and avoid vendor lock-in.

Key Takeaways

  • Connected devices and sensors make real-time monitoring actionable for providers.
  • RTLS, wearables, and environmental sensors reduce delays and improve outcomes.
  • Network gateways like Cisco Catalyst and Meraki simplify deployments.
  • Open ecosystems and centralized management ease scaling across systems of care.
  • Security, compliance, and interoperability are non-negotiable for U.S. adoption.

What Is Healthcare IoT and Why It Matters Now in the United States

Real-time device telemetry and sensor feeds turn episodic visits into continuous patient observation across care
sites.

Defining the system

Healthcare iot healthcare is a network of connected devices and sensors that stream clinical and
operational data into workflows. These signals enable continuous monitoring, automated alerts, and faster decisions
that improve patient care.

Present-day pressures

U.S. systems face aging populations, rising chronic conditions, and persistent staffing shortages. COVID-19 showed
the need to scale remote-ready technologies to manage capacity and cost.

Continuous monitoring captures vitals, behavior, and environmental context so providers intervene earlier
and cut unnecessary readmissions.

Device Type Data Collected Primary Benefit
Clinical wearables Heart rate, SpO2, activity Early warning of decline
Environmental sensors Temp, humidity, air quality Compliance and infection control
RTLS tags & telemetry Location, equipment status Faster time-to-care and asset use

Why timing matters: value-based payment and capacity limits reward technologies that boost
visibility and reduce time to treatment. Strong connectivity and device management keep data reliable and equitable
across rural and urban populations. The next section maps how sensors, networks, and analytics form a secure,
scalable architecture.

Inside an IoT Healthcare Architecture: From Sensors to Insights

A layered architecture turns raw sensor signals into clinical alerts and operational dashboards.

Perception layer

Perception layer: sensing vitals and equipment state

Wearables, biosensors, RFID tags, cameras, and GPS modules collect heart rate, blood pressure, glucose, movement,
temperature, humidity, and asset location.
These inputs help teams monitor patients and track equipment in real
time.

Network layer

Network layer: moving signals reliably

BLE handles low-power proximity tasks. Wi‑Fi delivers high throughput across campuses. RFID supports precise
tracking.
LPWAN (NB‑IoT/LoRaWAN) spans long range with low power, while 4G/5G provides mobility and resilience.

Application and analytics

Application layer and data: turning streams into workflows

Dashboards, alert rules, and API-based integration feed EHRs and service desks. Edge computing reduces latency for
critical monitoring and lowers bandwidth needs.
AI/ML on curated data enables anomaly detection and predictive
maintenance of equipment.

Layer Key Components Primary Benefit
Perception Wearables, biosensors, RFID, cameras Continuous vitals and asset telemetry
Network BLE, Wi‑Fi, LPWAN, 4G/5G, RFID Reliable signal transport across facilities
Application & Data Dashboards, edge nodes, AI/ML, APIs Actionable alerts and integrated workflows

Governance and integration matter. Role-based access, encryption in transit and at rest, and audit
logs protect sensitive data.
Using Cisco Catalyst and Meraki access points as gateways can reduce additional
hardware and speed deployment across existing infrastructure.

Core Technologies Powering Smart Hospitals and Remote Care

Modern hospitals depend on a set of complementary technologies to track equipment, monitor conditions, and
keep patients safe.
These building blocks turn raw signals into timely actions that reduce delays and cut
costs.

RTLS with BLE and RFID

Real-time location systems use BLE tags, RFID, and Wi‑Fi to map assets, tagged patients, and staff. This
reduces search time for medical equipment and speeds responses during critical events.

Environmental monitoring

Temperature, humidity, and air-quality sensors stream data for pharmacy refrigerators, labs, ORs, and patient
rooms. Automated alerts protect medications and keep compliance logs for audits.

Clinical wearables

Wearables capture heart rate, blood pressure, glucose, and movement for remote monitoring and fall detection. These
devices support early intervention and fewer unnecessary visits.

Gateways, onboarding, and analytics

Using existing Wi‑Fi access points as gateways simplifies deployments and enforces secure onboarding and
segmentation. Wayfinding and occupancy analytics guide visitors, reduce missed appointments, and focus cleaning on
high-traffic areas.

Lifecycle and governance: battery life, calibration, firmware updates, and centralized maintenance
keep sensors and equipment reliable. Together, these technologies boost staff efficiency and improve the patient
experience across hospital and remote care systems.

High-Impact Use Cases for Healthcare Providers and Patients

High-value use cases link patient-facing devices and facility sensors to dashboards that drive faster
treatment and lower costs.

Remote patient monitoring and real-time alerts

At-home blood pressure cuffs, glucose monitors, and smart inhalers capture health data and send it to care teams.
Clinician dashboards surface prioritized alerts when thresholds are crossed.

That real-time visibility enables prompt outreach, medication changes, or clinic visits that cut
readmissions and speed treatment.

Operations: space use, predictive maintenance, and safety

Sensors track room occupancy, equipment use, and environmental status to plan cleaning and allocate staff.
Predictive maintenance flags failing medical equipment before it causes downtime.

Asset tracking and inventory

RFID and BLE tagging reduces lost equipment and manual searches. Faster device location shortens time-to-care and
trims unnecessary reorders.

Telemedicine, medication management, and assisted living

Reliable connectivity supports video consults and remote diagnostics alongside continuous monitoring. Automated
dispensers and reminders improve adherence for chronic conditions.

Passive sensors detect falls and track sleep patterns to support aging in place while reducing caregiver burden.

Measurable outcomes: faster interventions, fewer adverse events, and higher patient and caregiver
satisfaction when devices and dashboards integrate with clinical workflows.

Tangible Benefits: Outcomes, Operational Efficiency, and Cost Control

Streams of location and condition data let teams find equipment fast and fix problems before they affect care.

Proactive care delivery: Continuous monitoring enables earlier detection and faster intervention.
That leads to better patient outcomes and fewer costly readmissions.

Operational efficiency improves when routine checks are automated. Fewer manual rounds, faster access to
devices, and occupancy insights shorten wait times and boost throughput.

  • Staff relief: clinicians spend more time with patients and less on searches and paperwork.
  • Cost control: tracked assets reduce loss and prevent excess purchases.
  • Medicine protection: monitored storage cuts spoilage and waste.

“Automated, time-stamped logs simplify audits and make compliance more reliable.”

Compliance and safety: Environmental alerts, staff duress signals, and audit-ready records reduce
risk. Standardized dashboards give providers consistent data to benchmark operations and improve treatment across
sites.

Implementing an IoT Smart Healthcare Solution: Integration, Security, and Scale

Start with a clear integration plan that maps device roles, data flows, and clinical touchpoints across
sites.

Adopt an open ecosystem to preserve device choice and cut pilot time. Cisco Spaces works with Catalyst and Meraki
access points as gateways to use existing wireless infrastructure and avoid extra hardware.

Open ecosystems in practice

Choose pre-certified vendors to speed deployment. A supported BLE framework with 50+ vendors reduces
vendor lock-in and helps providers pick the best devices for tracking, environmental monitoring, and staff safety.

Centralized device management

Central dashboards show device status, connectivity, firmware state, and alerts. That visibility reduces downtime,
lowers mean time to repair, and improves operational efficiency.

Avoiding vendor lock‑in

Leverage network-friendly onboarding, segmentation, and APIs to integrate data with EHRs and service desks. Build
governance with runbooks, SLAs, and cross-functional ownership to sustain operations.

  • Start with assess → pilot → measure → expand.
  • Embed security by design: segmentation, strong authentication, and encryption aligned to HIPAA.
  • Use gateways on existing infrastructure to speed rollouts and reduce capital expense.

Challenges Today and What’s Next: Security, Interoperability, and Emerging Technologies

Securing patient trust and connecting diverse systems remain the top obstacles as hospitals scale device
fleets and analytics.
Providers must build controls that protect data and still let clinicians act
quickly.

Security and privacy by design

Encrypt data in transit and at rest, require device authentication, and apply network segmentation
to reduce risk. Regular firmware updates and patching close common attack paths.

HIPAA-aligned controls—least-privilege access, detailed audit logs, and role-based policies—help meet
compliance and protect patients.

Interoperability and data standards

Fragmented formats slow integration. Adopt open APIs and common protocols to let devices and systems share
real-time alerts and clinical state without silos.

Standardized feeds improve clinical workflows and speed evidence gathering for pilots and scale-up.

Regulatory and reimbursement considerations

Policy gaps and unclear reimbursement can block projects. Align pilots to measurable outcomes and collect evidence
to support funding and wider adoption.

Future trends to watch

5G and improved connectivity enable higher device density and low-latency use cases. Edge computing keeps critical
processing local for faster alarms and privacy. AI on streaming data supports early warning scores and predictive
maintenance. Where appropriate, blockchain can add tamper-proof audit trails for consented sharing.

“Resilience planning ensures monitoring and alerts persist during outages or disasters.”

  • Encrypt and authenticate everywhere.
  • Use open APIs for integration.
  • Design pilots to prove outcomes and funding.
  • Plan for edge, AI, and resilient infrastructure.

Conclusion

Connecting device fleets, analytics, and clinical workflows turns scattered signals into clear, timely actions for
patients and staff. , Devices and sensors feed trusted data that helps providers detect decline earlier, shorten response time, and improve patient outcomes.

Open ecosystems and centralized management reduce complexity and speed time to value. They also make operations
more efficient and deliver clear benefits for care teams and patients.

Security, interoperability, and governance must guard trust while programs scale. Prioritize high-impact pilots—patient monitoring, asset tracking, and environmental compliance—then expand based on measured results.

Assess readiness, run strategic pilots, and build a roadmap to scale patient monitoring and operations confidently. As networks, analytics, and edge compute mature, iot solutions will deepen impact on health, costs, and experience.

FAQ

What is healthcare IoT and why does it matter now in the United States?

Healthcare IoT refers to connected devices, sensors, and systems that collect real‑time clinical data to support patient care. It matters now because rising chronic disease, workforce shortages, and post‑pandemic demand for scalable remote care push providers to adopt remote monitoring, telehealth, and automated workflows to improve outcomes and reduce costs.

How does a typical connected healthcare architecture work from sensors to insights?

The architecture starts with a perception layer of clinical wearables, biosensors, and telemetry on medical equipment. Data travels via a network layer using BLE, Wi‑Fi, RFID, LPWAN, or 4G/5G to gateways and edge nodes. Application layers provide dashboards, alerts, and workflow integration, while analytics and AI/ML on secure pipelines turn raw signals into clinical insights.

Which network technologies are best for real‑time monitoring in hospitals?

Choice depends on the use case. BLE and Wi‑Fi suit indoor patient monitoring and RTLS. LPWAN covers low‑power, wide‑area sensors. 4G/5G enables high‑bandwidth telemetry and low‑latency remote procedures. A hybrid approach often delivers the best balance of latency, coverage, and power consumption.

What types of clinical wearables and sensors are commonly used?

Common devices include heart rate monitors, blood pressure cuffs, continuous glucose monitors, pulse oximeters, and motion trackers. Environmental sensors for temperature, humidity, and air quality also support infection control and compliance. These devices feed continuous data for early intervention and better care plans.

How do asset tracking and RTLS improve hospital operations?

RTLS with BLE or RFID locates equipment and patients in real time, reducing time spent searching for devices, shrinking downtime, and improving workflows. That leads to faster treatment, lower capital expenses through better utilization, and enhanced patient safety by preventing equipment shortages.

What are high‑impact use cases for providers and patients?

Key use cases include remote patient monitoring with real‑time alerts, smart operations such as predictive maintenance and space optimization, inventory and asset management, telemedicine integration, medication adherence tracking, and ambient assisted living for chronic care.

What measurable benefits can hospitals expect from deploying connected systems?

Providers can achieve earlier interventions and improved clinical outcomes, streamlined workflows and reduced delays, lower operational costs from optimized asset use, and stronger compliance through automated reporting and audit trails.

How should organizations approach integration and scale to avoid vendor lock‑in?

Adopt open ecosystems and standards, use gateways that support multiple protocols, and select interoperable platforms. Centralized device management with multi‑site visibility helps maintain control, while choosing pre‑certified vendors accelerates deployment and reduces proprietary dependency.

What security and privacy measures are essential for connected deployments?

Security by design is critical: strong encryption, device authentication, network segmentation, and continuous monitoring. Align systems with HIPAA and other regulations, enforce role‑based access, and maintain secure data pipelines from edge to cloud to protect patient information.

How do analytics like edge computing and AI add value?

Edge computing reduces latency and preserves bandwidth by processing data locally for immediate alerts. AI and machine learning analyze trends, predict deterioration, and prioritize workflows, enabling proactive care and reducing clinician burden.

What regulatory and reimbursement hurdles affect adoption?

Providers must meet HIPAA and FDA requirements where applicable, demonstrate clinical validity for remote monitoring, and navigate reimbursement policies for telehealth and RPM. Clear pathways and pilot data often support sustainable adoption and payer coverage.

What emerging technologies will shape the next phase of connected care?

Next‑gen trends include expanded 5G use, more sophisticated edge analytics, AI‑driven clinical decision support, enhanced device interoperability, and explorations of blockchain for auditability. These advances promise lower latency, better insights, and tighter security.

How can facilities ensure compliance and safety with environmental monitoring?

Deploy calibrated temperature, humidity, and air‑quality sensors linked to alerting systems and automated logs. Integrate environmental data into compliance workflows to support sterile storage, infection control, and audit readiness.

Let’s Get Started

Inside the Future of V2I: How AI is Connecting Vehicles & Infrastructure

On a rainy Tuesday in Tampa, a commuter tapped his brake less and smiled more. His dashboard had warned of a sudden hazard ahead, and a nearby signal adjusted to ease congestion. That brief moment showed how modern systems can change a commute.

The story is a snapshot of how vehicles and roadside equipment share information to cut crashes and calm traffic. Real-time, two-way data helps spot hazards, tune signals, and guide drivers toward safer choices.

VICAD—the link between vehicle sensing, roadside systems, cloud analytics, and governance—turns raw data into timed actions. Pilot projects in the U.S. show fewer emergency brakings and modest travel-time gains when these systems work together.

Companies like
Iottive
bring end-to-end expertise in connected sensors, BLE apps, and cloud/mobile platforms to help scale these deployments. This guide will map the key systems, real-world benefits, and the governance needed for safe development.

Key Takeaways

  • Real-time data exchange links vehicles and infrastructure to improve safety and ease traffic.
  • Cooperative systems like VICAD turn sensor inputs into actionable, safety-focused outcomes.
  • Pilot results show measurable drops in forward collisions and emergency braking events.
  • Deployment needs clear governance for privacy, encryption, and trusted data flows.
  • Vendors such as
    Iottive
    offer end-to-end solutions for scaling deployments across cities.

The state of AI-powered V2I and IoT smart roads in the United States today

Cities and highways are upgrading to systems that sense conditions and alter signal timing in real time.

Why this matters: American road infrastructure is shifting from fixed assets to adaptive, sensor-rich platforms. Embedded sensors, connected signals, and gateways now continuously sense, compute, and coordinate movement for safer travel.

Why real-time data exchange is the new backbone of transportation systems

Real-time information between vehicles, signals, and management systems underpins safety-critical applications. Live feeds reduce surprises for drivers and help control traffic flow during peak periods.

From static roads to adaptive infrastructure: what’s changed and why it matters

Pilots show measurable gains: highway travel times improve about 10.4% and intersection queues shrink nearly 20%. Adaptive signals can cut CO2 by up to 30% and raise overall traffic efficiency by more than a third.

  • Baseline assets: roadside sensors, connected signals, and vehicle gateways.
  • Funding: federal grants and PPPs speed development and scale.
  • Operational shift: agencies move from static timing plans to continuous, data-driven management.

Vendors such as Iottive build end-to-end solutions—pairing BLE, mobile, and cloud to link roadside devices, vehicles, and platforms for U.S. agencies. Standards alignment and workforce development remain key to citywide deployment.

V2X fundamentals: How vehicles, infrastructure, and networks communicate

V2X is the umbrella for vehicle communication with other vehicles, roadside systems, pedestrians, and cloud services. It defines how information moves and which messages get priority when seconds matter.

V2V, V2I, V2P, and V2N in practice

V2V shares speed, position, and direction for collision avoidance. NHTSA estimates V2V and V2I safety apps could eliminate or mitigate up to 80% of non‑impaired crashes, especially at busy intersections.

V2I sends green‑light speed advisories and optimized signal timing. V2P warns drivers of pedestrians and cyclists via phones and wearables. V2N links vehicles to cloud systems for rerouting and fleet coordination.

Where edge analytics amplify situational awareness

Edge computing lives in vehicle ECUs and roadside units to fuse sensor streams and act on real‑time data. Ultra‑reliable, low‑latency channels carry safety messages with strict priorities so warnings reach drivers in time.

  • Message types: status, warning, and control — prioritized by time sensitivity.
  • Perception boost: shared intent extends line‑of‑sight and aids cooperative maneuvers.
  • Data governance: authentication, anonymization, and minimal fields keep exchanges safe.

Iottive’s BLE app development and cloud/mobile integration enable secure edge‑to‑cloud data exchange for pilots and production programs that test these systems in real traffic.

AI V2I connectivity, IoT smart roads, autonomous mobility integration

When on-vehicle sensors meet roadside processing and cloud analytics, detection confidence rises and false alerts fall.

Core components: sensors, roadside units, traffic signals, and cloud platforms

Perception layers use cameras, radar, and LiDAR to gather local views. Roadside units handle short‑range processing and messaging.

Signals and cloud link local insights to citywide optimization and operator dashboards for real‑time management.

VICAD architecture: Vehicle, Infrastructure, Cloud, and Data working together

The VICAD model syncs on‑board intelligence with field sensing and cloud analytics. This mix boosts detection of occluded hazards and improves decision quality.

“Merging infrastructure sensing with vehicle perception adds a vital layer of redundancy for intersection safety.”

From ADAS to cooperative driving: enabling safer autonomous driving

Shared intent messages help vehicles negotiate merges and unprotected turns. Operators use dashboards to monitor KPIs, send updates, and manage device health.

Layer Function Benefit
Perception Cameras, radar, LiDAR Hazard detection, blind‑spot coverage
Edge units Local fusion & messaging Low latency warnings
Signal control Adaptive timing Reduced delay, clearer routing
Cloud Analytics & dashboards Citywide optimization, OTA updates


Iottive
designs custom platforms that connect sensors, RSUs, and cloud services with BLE and mobile apps to support pilots and production deployments.

5G, DSRC, and C‑V2X: The communications stack enabling real-time responsiveness

Modern transport relies on layered wireless links to deliver life‑critical alerts in milliseconds. The communications stack blends 5G and short‑range radio protocols to move information that prevents collisions and clears intersections.

Why latency matters: millisecond‑level delays separate a near miss from a crash. Short‑range radios like DSRC and IEEE 802.11p offer predictable range and low delay for intersection use. C‑V2X delivers broader coverage and longer reach but needs spectrum and vendor alignment.

5G brings ultra‑low latency and high bandwidth for real time HD map updates, remote operation, and scaling connected devices in dense urban canyons. Edge preprocessing prioritizes safety messages while the cloud aggregates data for learning and system development.

Interoperability and security: regions use ITS‑G5, C‑V2X, and IEEE variants, so multi‑mode gateways ease transitions. Architectures must include mutual authentication and signed messages to keep networks and infrastructure trusted during peak traffic and emergencies.

  • DSRC vs C‑V2X: spectrum, range, and deployment trade‑offs for city vs corridor use.
  • Edge + cloud: prioritize safety messages at the edge, aggregate in cloud for updates.
  • Cybersecurity: authentication, message signing, and robust failover across systems.


Iottive
integrates mobile and cloud services with roadside communication stacks to support DSRC and C‑V2X pilots and enable scalable rollouts.

AI and data pipelines: Turning sensor streams into decisions in real time

Sensor streams must be turned into clear actions within fractions of a second to prevent crashes and ease delays. The end-to-end pipeline ingests, cleans, fuses, infers, decides, and acts across vehicle, roadside edge, and cloud tiers.

Edge vs. cloud analytics for time-critical safety and traffic flow

Edge handles sub-100 ms safety decisions and local alerts. It filters and forwards key information to the cloud.

Cloud supports fleet learning, long‑range optimization, and policy management. Iottive’s cloud & mobile integration links edge devices to secure data lakes and dashboards.

HD maps, predictive maintenance, and signal optimization

HD map streaming and change detection keep vehicles and signals aligned with work zones and incidents.

Predictive maintenance cuts repair costs by about 25% and spots needs up to 90% faster than manual methods.

Data governance, privacy, and public trust

“Transparent retention, minimal collection, and role-based access build citizen confidence.”

  • Encrypt data in transit and at rest.
  • Apply anonymization and differential privacy.
  • Run audits, red-team tests, and clear public communications.
Stage Role Outcome
Ingest & Clean Edge/vehicle Reduce noise, keep latency low
Fuse & Infer Edge Sub-100 ms safety alerts
Decide & Act Edge/Signal Immediate warnings, adaptive timing
Aggregate & Learn Cloud Citywide optimization, maintenance planning

Proven benefits: Safety, efficiency, and sustainability outcomes you can measure

Real-world trials reveal that targeted alerts and adaptive signal timing drive measurable safety and energy wins on busy corridors.

Crash prevention and hazard detection in busy intersections

Targeted warnings and anomaly detection reduce conflict points where pedestrians, bikes, and vehicles meet. Tampa’s pilot cut forward collision conflicts by 9% and emergency braking incidents by 23%.

Improved traffic flow, reduced idling, and lower emissions

Adaptive signals smooth arrivals and enable platoons, lowering stops and delays. The same pilot showed travel times fell by 2.1% and idle minutes by 1.8%.

Optimized timing can cut emissions by roughly 32–40%, which trims fuel consumption and greenhouse gases while easing driver stress.

Energy optimization and EV charging strategies on connected corridors

Systems that steer electric vehicles to available chargers and to off‑peak windows reduce grid strain and improve charge access. Energy-aware lighting and roadside equipment can dim or shift schedules to cut operating costs.

“Outcome-based KPIs — crash surrogates, person-throughput, idle minutes, and emissions per mile — help cities measure real progress.”

  • Quantify intersection safety gains from alerts and anomaly detection.
  • Link adaptive control to fewer stops, smoother traffic flow, and emission drops.
  • Reduce fuel consumption, tire/brake wear, and improve transit on-time performance.
  • Steer electric vehicles to chargers and off-peak windows to balance the grid.
  • Use energy-aware lighting to trim operational cost and emissions.


Iottive’s
end-to-end solutions support energy-aware applications and electric vehicle integrations across roadside and mobile apps, making these outcomes measurable and repeatable.

Real-world case studies and pilots shaping deployment

Field pilots reveal how coordinated signaling and in-vehicle alerts change driver behavior at busy intersections.

Tampa connected vehicle pilot: signal prioritization and conflict reduction

Architecture and message sets: Tampa’s THEA pilot linked vehicle beacons and roadside signal controllers to prioritize phases and send timely warnings. Message logic gave proactive green timing to reduce conflict points and warn drivers of potential hazards.

Metrics: The deployment yielded 9% fewer forward collision conflicts, 23% fewer emergency braking events, 2.1% reduced travel time, 1.8% lower idle time, and 56% participant satisfaction.

Bus signal priority improved transit reliability while keeping cross‑traffic safe. Operators used dashboards to track performance and validate outcomes.

Michigan lessons: unified datasets and common languages

Michigan pilots stressed model alignment, shared semantics, and governance to avoid vendor lock‑in. Agencies adopted common schemas, API contracts, and phased testing to speed development and cut integration delays.

“Standardized data and repeatable testing protocols are the glue for scale.”

  • Translate Tampa patterns into reusable data schemas and API contracts.
  • Validate systems in realistic field conditions before citywide rollout.
  • Use BLE apps and cloud reporting to link participants, verify KPIs, and support pilot-to-scale execution.

Challenges to scale: Reliability, security, bandwidth, and power constraints

Large-scale rollouts stress networks in ways that lab tests rarely reproduce, especially under peak traffic and severe weather.

Communication reliability in dense urban settings and adverse weather

Urban canyons and heavy rain create multipath, blockage, and fading that hurt message delivery. Antenna diversity, sectorized radios, and cellular fallback reduce outages.

Designers should layer short‑range links with wide‑area links and plan for physical obstructions. This mix preserves safety messages when the environment degrades.

Cybersecurity, encryption, and authentication for resilient networks

Security must be baked in: a stack of PKI, certificate revocation, signed messages, and zero‑trust access keeps roadside and cloud edges trusted.

Regular certificate rotation, logging, and tamper detection help operations spot compromises and restore service fast.

Bandwidth, latency, and edge strategies for peak-load performance

Prioritize safety and control messages during spikes and compress or delay telemetry that is non‑critical. Dynamic bandwidth allocation and QoS rules maintain low latency for urgent alerts.

Edge buffering and local decision logic allow systems to act for seconds or minutes when backhaul drops, avoiding degraded safety at intersections.

Energy‑efficient devices and maintenance at roadside scale

Energy tactics lower OPEX: solar‑assisted cabinets, duty‑cycled sensors, and efficient compute modules extend field life. Remote diagnostics and OTA updates cut truck rolls.


Iottive
designs low‑power IoT hardware and secure mobile/cloud pipelines to minimize maintenance cycles and protect sensitive mobility data.

“Resilience is as much about lifecycle management as it is about peak performance.”

  • RF mitigation: antenna diversity and fallback paths for urban blockage.
  • Security stack: PKI, revocation lists, signed messages, and zero‑trust policies.
  • Bandwidth tactics: prioritize safety, compress telemetry, and use edge buffering.
  • Lifecycle ops: remote health checks, OTA, and spare‑parts planning at scale.

Policy, funding, and PPPs: Accelerating smart infrastructure adoption

Public trust and clear liability rules often determine whether a pilot grows into citywide development.

Federal grants and programmatic funding map the first steps for infrastructure upgrades. BUILD grants and corridor investments, such as the I‑70 Mountain Corridor private upgrades, show how public dollars plus private capital speed deployment and reduce taxpayer burden.

Federal grants, standards, and adaptive regulatory frameworks

Standards enable cross-vendor interoperability, secure networks, and long-term maintainability. Adaptive regulation that shortens approval cycles can cut repair and rollout costs by roughly 25%.

Public-private partnerships and economic development impacts

PPPs blend public oversight with private innovation to fund large-scale development. These models create construction jobs, attract tech firms, and improve logistics efficiency.

Liability, insurance, and building public confidence

Clear liability allocation helps insurers price risk for vehicles and field equipment. New insurance approaches are emerging as a key part of the market, which some forecasts place near $1.5T by 2030.

  • Map funding avenues to safety, efficiency, and sustainability outcomes.
  • Use standards to protect security and long-term management.
  • Structure PPPs to de-risk pilots and document ROI through phased reporting.
  • Engage the public with privacy policies, open dashboards, and independent audits.

“Staged pilots and transparent reporting de-risk implementation and build political will.”


Iottive
partners with agencies and OEMs to meet standards, document ROI, and de-risk implementation through staged pilots and clear reporting. That approach helps scale development while keeping data and safety central to transportation systems planning.

Implementation roadmap: From pilot to citywide autonomous mobility integration

A phased approach reduces risk, limits cost overruns, and speeds measurable benefits.

Start with readiness: run an asset and data readiness review to match architectures to corridor priorities and budgets.

Align stakeholders early—transportation agencies, vendors, and community groups—so governance, procurement, and privacy policies move in step.

Pilot design and KPIs

Co‑create MVP pilots with clear safety and efficiency KPIs such as conflict surrogates, idle‑time reduction, and citizen feedback loops.

Use unified datasets and common communication languages to avoid vendor lock‑in and speed validation, as demonstrated in Michigan pilots.

Scaling and operations

Define iteration cadence, scaling thresholds, and interoperability tests before expansion. This prevents delays that can raise costs by up to 150% per lane annually.

Establish 24/7 management for incident response, device health, and configuration. Integrate continuous improvement with model updates, firmware patches, and seasonal playbooks.

  • Align procurement, privacy compliance, and workforce training with long‑term sustainability.
  • Document KPIs and handoffs so operations and vendors share one source of truth.

“Pilot programs refine strategy before larger rollouts; clear KPIs and managed services turn lessons into repeatable deployment.”


Iottive
offers readiness assessments, architecture recommendations, MVP pilots, KPI frameworks, and managed services to operate and evolve these systems and vehicle‑to‑field programs.

Where V2I meets industries: Healthcare, logistics, and smart city ecosystems

Hospitals, freight depots, and city control centers now rely on vehicle-to-field links to speed response and cut delays. These cross-sector ties let operators clear corridors, sync intersections, and move goods with fewer stops.

Healthcare and emergency response: Preemption and precision routing

Emergency preemption clears lanes and holds cross traffic so ambulances and fire services reach incidents faster. Precision routing factors in closures, weather, and demand to reduce response times and improve outcomes.

Freight and fleet: Platooning, fuel consumption, and operational efficiency

Platooning stabilizes headways, lowers drag, and trims fuel consumption for long hauls. Fleet telematics linked to city signals cut dwell at loading docks and boost schedule reliability.

Example: Iottive connects emergency vehicles, fleet apps, and roadside controllers via BLE and cloud APIs to support preemption, routing, and telematics. Shared data across agencies and private operators unlocks network-level gains in traffic flow and overall efficiency for transportation systems in U.S. cities.

Why Iottive for end-to-end IoT/AIoT smart road solutions


Iottive
delivers complete systems that move from sensors to apps with clear KPIs and rapid pilots. Our work pairs rugged field devices, BLE-enabled gateways, and cloud platforms to make data useful for operations teams and vendors.

Our expertise: BLE app development, cloud & mobile integration, custom IoT products

We build BLE apps and mobile clients that link vehicles and field devices to secure cloud services. Our engineering teams deliver firmware, backend APIs, and mobile UX focused on reliability and fast deployment.

From sensors to apps: Vehicle connectivity and data exchange at scale

Standards-based APIs and interoperable architectures let agencies scale device fleets and networks. We operationalize vehicle connectivity, encrypted data pipelines, and certificate management to meet agency and OEM requirements.

Contact us to accelerate deployment

Services include discovery workshops, proof-of-concept builds, and phased citywide rollouts. Reach us:
www.iottive.com | sales@iottive.com

Offering Benefit Use Case
Rugged sensors & gateways Field reliability, low OPEX Corridor sensing, EV charging detection
BLE & mobile apps Driver alerts, fleet apps Emergency preemption, fleet routing
Cloud & APIs Analytics, KPI reporting Pilot validation, ROI storytelling

Conclusion

Real‑world programs tie local sensing to signal logic, turning raw observations into faster, safer traffic responses. Pilots show clear wins: fewer conflicts and emergency brakings in Tampa, shorter travel and idle times, lower queues, and emissions down as much as 30% in tested corridors.

Standards, low‑latency links, and governed data pipelines make deployments resilient and trustworthy. Funded pilots and PPPs unlock scale while unified datasets and encryption keep systems reliable and auditable.

Assess, pilot, prove KPIs, and scale with continuous improvement and transparent reporting.

Iottive

stands ready to partner across strategy, engineering, and operations to deliver measurable safety, efficiency, and sustainability outcomes. Contact: www.iottive.com | sales@iottive.com

FAQ

What is the role of real-time data exchange in modern transportation systems?

Real-time data exchange enables vehicles and roadside systems to share timely information about traffic, road conditions, signal status, and hazards. This continuous flow helps traffic managers optimize signal timing, reduces congestion, and supports faster emergency response. By combining sensor feeds, edge analytics, and cloud platforms, cities can improve safety and energy efficiency while lowering fuel consumption and emissions.

How do vehicles, infrastructure, and networks communicate in a V2X setup?

Vehicles communicate with each other, with roadside units, with pedestrians, and with network services using a layered communication stack such as 5G, DSRC, or C‑V2X. Messages include position, speed, and intent for collision avoidance and signal phase information for smoother intersections. Edge computing and machine learning amplify situational awareness by processing local sensor data before sending summarized insights to the cloud.

What are the key components of a roadside system that supports connected and cooperative driving?

Core components include roadway sensors (cameras, radar, LIDAR), roadside units and traffic signal controllers, centralized cloud platforms, and APIs for vehicle and fleet integration. Together these parts collect telemetry, run analytics, and deliver actionable alerts to vehicles and traffic operations centers, enabling cooperative functions like signal priority and platooning.

How does edge analytics differ from cloud analytics for time-critical decisions?

Edge analytics processes data close to the source, minimizing latency for safety-critical functions such as collision avoidance and emergency vehicle preemption. Cloud analytics handles longer-term tasks like HD map updates, predictive maintenance, and city-wide traffic optimization. A hybrid pipeline balances immediate responsiveness with scalable model training and historical trend analysis.

What communication technologies enable ultra-low latency for collision avoidance and alerts?

Ultra-low latency is achieved using cellular networks such as 5G and dedicated short-range communications (DSRC), or cellular-based C‑V2X. These options support rapid message delivery, high reliability, and prioritized traffic for public safety. Network slicing and edge compute also help guarantee timely performance during peak loads.

How do connected systems improve energy use and EV charging integration?

Connected infrastructure optimizes traffic flow to reduce idling and stop-and-go conditions, cutting fuel consumption and emissions. For electric vehicles, platforms can coordinate charging schedules, provide route-aware range predictions, and manage smart charging stations to balance grid demand and reduce peak loads, enhancing sustainability and operational efficiency.

What measurable safety benefits have pilots demonstrated in the United States?

Pilots like the Tampa connected vehicle program have shown reduced signal conflicts and faster emergency vehicle clearance. Michigan pilots have highlighted the value of unified datasets for consistent messaging. These tests report fewer near-misses, better intersection awareness, and improved response times—translating to lower crash risk and better public safety outcomes.

What are the main cybersecurity and privacy concerns for connected road systems?

Key concerns include secure message authentication, encryption, and device hardening to prevent spoofing or tampering. Data governance policies must control access, protect personal information, and maintain transparency to build public trust. Regular audits, patching, and multi-factor authentication help maintain resilience against attacks.

How do standards and interoperability affect regional deployments?

Interoperability ensures vehicles and roadside equipment from different vendors work together across cities and states. Aligned standards reduce integration costs and simplify scaling. Regional coordination of protocols, message sets, and certification processes helps avoid fragmentation and speeds wider adoption.

What factors should cities consider when moving from pilot projects to citywide deployment?

Cities should perform readiness assessments, align stakeholders, select scalable architectures, and define KPIs for safety, congestion, and emissions. Pilot design must include iterative scaling, maintenance plans, and operations teams for real-time management. Public-private partnerships and sustainable funding models are also critical for long-term success.

How can freight and fleet operators benefit from connected road infrastructure?

Freight and fleet operators gain from platooning, optimized routing, reduced fuel consumption, and predictive maintenance. Real-time data exchange improves ETA accuracy, lowers idle time, and boosts operational efficiency. Integration with telematics and cloud services helps fleets scale these benefits across routes and terminals.

What role do public-private partnerships and federal funding play in deployment?

Federal grants and adaptive regulations can accelerate infrastructure upgrades by lowering upfront costs. Public-private partnerships provide technical expertise, shared investment, and faster procurement. Together they support economic development, encourage innovation, and spread risk while building public confidence in new systems.

What are common technical challenges to scaling connected road solutions?

Common challenges include maintaining communication reliability in dense urban areas and adverse weather, ensuring sufficient bandwidth and low latency, and powering roadside devices efficiently. Solutions include redundancy, edge strategies for peak loads, efficient device design, and robust encryption to meet security and performance needs.

How do data governance and transparency influence public acceptance?

Clear policies on data use, retention, and anonymization build trust. Open communication about how data improves safety and reduces emissions helps gain public buy-in. Independent oversight, privacy safeguards, and accessible reporting on outcomes reinforce accountability and foster acceptance of connected services.

How can cities measure the ROI of connected infrastructure projects?

Cities can track metrics such as crash rates, emergency response times, vehicle hours of delay, fuel consumption, and emissions. Measuring changes in traffic throughput, signal efficiency, and EV charging utilization provides quantifiable evidence of safety, environmental, and economic benefits to justify continued investment.