On-device intelligence and physical hardware are converging. The companion app is no longer just a remote control — it’s becoming the brain.
By the Iottive Engineering Team · 14 min read · May 2026
Imagine a connected glucose monitor whose companion app, in real time, explains exactly why a patient’s glucose spiked an hour after lunch — not by querying a cloud LLM, not by making any network call, but by reasoning entirely on the iPhone in the patient’s pocket. No latency. No subscription. No HIPAA risk. No data ever leaves the device.
A year ago, this was speculation. Today it ships as a Swift function call.
Apple’s Foundation Models framework — a 3-billion-parameter language model that runs entirely on iPhone and Mac, free of per-token costs and offline by default — is the most consequential platform shift for IoT app development in a decade. WWDC 2026 is just 17 days away. The companies that adapt early will pull years of competitive distance before the rest catch up.
This is what we think is changing, why it matters specifically for connected products, and what hardware companies should be doing right now.
1. What Apple Actually Shipped (and What’s Coming June 8)
Foundation Models runs the language model entirely on the iPhone or Mac. No data ever leaves the device.
At WWDC 2025, Apple introduced the Foundation Models framework — a Swift-native API that gives developers free access to a 3-billion-parameter on-device language model. The headline facts:
3-billion-parameter LLM, runs entirely on-device. No internet required after the initial OS install.
Swift-native API with a @Generable macro that produces type-safe structured output from Swift structs — no JSON parsing, no string wrangling.
LoRA fine-tuning support — developers can customize the base model for domain-specific tasks (medical reasoning, industrial diagnostics, sport-specific coaching) without retraining the entire model.
Function calling — the model can invoke app functions directly, enabling agentic behavior across your app.
Zero per-token cost. Zero API rate limits. Zero data egress.
Hardware requirement: A17 Pro or later iPhones, M1 or later iPads and Macs. Older devices fall back to Core ML or cloud paths.
WWDC 2026 — the keynote runs June 8 — is widely expected to expand this surface significantly. Bloomberg’s Mark Gurman has reported that Apple is paying Google roughly $1 billion a year for a custom 1.2-trillion-parameter Gemini model to power the next generation of Siri and Foundation Models. iOS 27 is expected to introduce “Extensions” — a system that lets developers and users plug in third-party AI models (Gemini, ChatGPT, Claude) alongside Apple Intelligence.
For connected products specifically, what matters more than any single announcement is the architecture Apple has committed to: intelligence runs on the user’s device by default. Cloud is optional, not obligatory. That is a profound break from how every IoT companion app has been architected for the last decade.
For the first time, every modern iPhone has a competent LLM in its pocket that runs locally. For developers, this means no infrastructure cost, no privacy review process, and no internet dependency for shipping AI features.
2. Why This Matters Specifically for IoT
IoT apps have always been bottlenecked by three things. On-device AI fixes all three simultaneously.
Bottleneck 1 — Latency
Cloud LLM round-trips take 800ms to 3 seconds. For real-time sensor interpretation — a heart-rate spike, a manufacturing anomaly, a stroke deviation in a practice putting session — that’s too slow to feel useful. On-device Foundation Models responds in 100 to 300ms.
Bottleneck 2 — Cost
Cloud-LLM economics break for high-frequency sensor data. A connected wearable streaming biometrics 24 hours a day generates hundreds of thousands of inferences per user per month. At frontier-model prices, that’s $50 to $300 per user per month — economically infeasible for any consumer or healthcare product. On-device is free.
Bottleneck 3 — Privacy and Compliance
HIPAA, GDPR, and SOC 2 all become dramatically easier when sensor data never leaves the device. Health and fitness products have been constrained for years by the data-egress problem. Foundation Models solves it by architecture — the data does not go anywhere because the intelligence comes to the data.
What this means in practice
Looking across the products we have engineered:
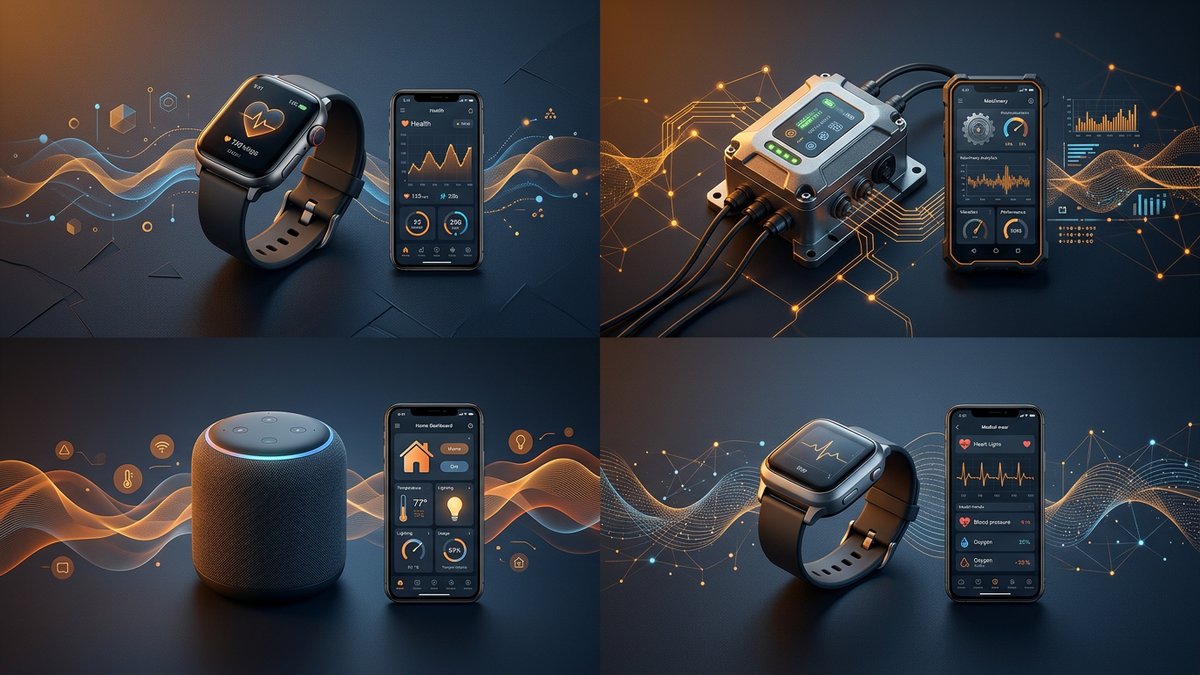
Health wearables (Vagal Tones, BionicGym, 360Care): Foundation Models can generate personalized stimulation protocols, interpret biometric trends, and summarize a week of remote-patient data — all locally, with no HIPAA exposure.
Sports tech (Vertex Golf): Imagine the SmartCore app saying, “Your stroke tempo deteriorated 12% after the 8th putt — that’s a fatigue pattern, not a technique flaw” — generated from the player’s actual session data, on-device.
Industrial IoT (SIMMM Cool App): Predictive maintenance summaries, anomaly explanations, and operator-language alerts (“the Foggy pump in zone 3 is drawing 8% above baseline, suggesting nozzle scaling”) generated locally on the technician’s phone.
Consumer IoT (Heatsail, POQQ): Natural-language device configuration without sending user behavior to any LLM provider.
Cloud LLM vs. Foundation Models — at a glance
Dimension
Cloud LLM
Apple Foundation Models
Latency
800ms – 3s
100 – 300ms
Per-inference cost
$0.001 – $0.10+
Free
Internet required
Yes
No
Data egress
Yes (HIPAA/GDPR risk)
No
Model size
Up to 1T+ parameters
~3B parameters
Hardware requirement
None on client
A17 Pro+ / M1+
Best for
Heavy reasoning, long context
Real-time, private, frequent inference
3. Five Things That Will Change in IoT Companion Apps
The companion app is becoming the intelligence layer for every connected category.
Sensor data becomes conversational. Companion apps move from charts to conversations. “Why is my resting heart rate higher this week?” — the app answers locally, with reasoning grounded in the device’s actual data. A Vertex SmartCore user asks, “How did my stroke change after the 6th hole?” — and the app explains, citing the actual stroke metrics from that session.
App UX shifts from menus to intent. With App Intents plus Foundation Models, users describe what they want, not how to do it. “Turn off all the misting zones except the patio” becomes a single utterance, not a navigation sequence. Heatsail, SIMMM Cool App, and any multi-zone connected product becomes immediately better with this pattern.
OTA personalization replaces firmware features. Today, adding a new analysis capability to a connected product usually requires a firmware update. With LoRA adapters, app makers can ship updates that customize the on-device model for specific user cohorts — post-surgical rehab patients, golf coaches, asthma patients — without touching firmware.
Edge inference becomes the default architecture. The standard IoT stack — device → BLE → phone → cloud → ML model → response — collapses to device → BLE → phone → response. Cloud is no longer in the critical path for intelligence. Cloud becomes a sync layer, not a thinking layer.
The Siri-to-device gap closes. With expanded Siri and App Intents in iOS 27, users will invoke connected-product functions across the system. “Hey Siri, start a 20-minute mindfulness session on my Pulse Ring.” The companion app becomes the actor, not the destination.
The standard IoT architecture collapses. Cloud is no longer in the critical path for intelligence. It becomes a sync layer, not a thinking layer.
4. What Hardware Companies Should Do Now
For IoT teams, the work begins now — before WWDC 2026 — to architect for on-device intelligence.
Audit your app for AI-eligible features. Every alert, every summary, every recommendation in your current app is a candidate for Foundation Models. List them. Score them by user impact. The top 3 are your roadmap for the next two quarters.
Redesign your data model for on-device reasoning. LLMs need structured, queryable context. If your app’s data model is a flat time-series, you’ll need to add semantic layers — sessions, events, anomalies, narrative annotations — for the model to reason about. Start now; this work has long lead time.
Plan for LoRA fine-tuning if your domain is specialized. Medical, industrial, and clinical use cases benefit from domain-fine-tuned models. Start collecting the data you’ll need for LoRA training now. Anonymized, structured, well-labeled session data is gold.
Don’t wait for Android parity. Android has its own on-device AI stack (Gemini Nano), and the cross-platform pattern is forming. Native iOS-first is the right call for early-adopter products in iOS-dominant categories — consumer health, premium fitness, luxury IoT, prosumer audio. Android can follow.
Treat the cloud as a sync layer, not a thinking layer. Redesign cloud services to handle data persistence, multi-device sync, and admin/clinician dashboards. Stop building cloud-side ML pipelines for features that can run on-device. The cost structure inverts.
Watch WWDC 2026 carefully (June 8). Apple is expected to expand the Foundation Models API, add new modalities (vision and audio reasoning are widely rumored), and announce iOS 27 Extensions. Major IoT architecture decisions should pause until that lands. Ten days of patience now will save quarters of rework later.
5. The Risks and Limits Nobody Talks About
This is the section the typical “Apple AI is amazing” article skips. Here are the constraints we work with daily.
Hardware fragmentation. Foundation Models only runs on A17 Pro+ and M1+. iPhone 14, iPhone 15 (non-Pro), and older iPads are locked out. If 40% of your user base is on those devices, your “on-device AI” feature is a “premium tier” feature whether you wanted it to be or not.
Model size limits. 3 billion parameters is small by frontier standards. Complex multi-step reasoning still benefits from cloud LLMs. A medical reasoning chain involving four causal hops is not yet a job for Foundation Models alone.
No streaming, no audio-out by default. Today’s Foundation Models is text-in, text-out. Voice and richer modalities are coming but not shipped. If your IoT product requires natural voice interaction today, you still need a hybrid architecture.
Apple’s terms. Foundation Models output cannot (today) be used to train competing models. Read the developer agreement carefully if your business depends on closed-loop learning across users.
The right strategy is hybrid. On-device for low-latency, private, high-frequency inference. Cloud for heavy reasoning. The hardware companies that succeed will architect for both, with on-device as the default.
Building Connected Products for the Next Decade
The connected products that will define the next decade are the ones built around on-device intelligence from day one.
Apple’s bet on on-device AI is the most consequential platform shift in IoT since BLE became universal in 2014. The hardware companies that build for it now will pull years of competitive distance before their slower rivals catch up.
We are already designing connected products around Foundation Models for Iottive clients — extending companion apps with on-device intelligence, redesigning data models for LLM-friendly reasoning, and prototyping LoRA adapters for specialized verticals.
If you are building a connected product and want to understand how on-device AI changes your architecture — what to build now, what to wait for, and what to redesign — we offer a free 45-minute Architecture Briefing.
On the call we will:
Review your current app and identify the top 3 Foundation Models opportunities
Sketch a hybrid on-device + cloud architecture for your product
Tell you what to ship before WWDC 2026 and what to wait for after
No slides. No pitch. Just engineering conversation between teams that have shipped connected products together for a decade.
Iottive is an AIoT product engineering firm with teams in India, Europe, and North America. Since 2016 we have engineered connected products for 155+ companies across 30+ countries — including Vertex Golf (used by 150+ tour professionals), BionicGym (FDA-cleared NMES wearable), Vagal Tones (medical vagus nerve stimulation), SIMMM Engineering (industrial misting control), Heatsail (premium outdoor heating), POQQ (luxury wireless charging), and Road Angel (automotive safety). Our work spans health and fitness sensors, industrial IoT, automotive safety, consumer products, and medical devices.
For most successful health and fitness hardware founders, the journey starts the same way: a practitioner with an idea and a notebook.
By the Iottive Engineering Team · 12 min read · April 2026
You’ve thought about this for months. Maybe years.
You’re a physiotherapist watching the same six rehabilitation problems show up across hundreds of patients, and the existing products on the market don’t quite solve any of them. You’re a strength coach noticing that the testing tools you use are either cheap-and-unreliable or expensive-and-tethered to a single piece of furniture in a single room. You run a gym chain and you’ve watched three competitors launch branded recovery devices that doubled their average revenue per member. You’re a cardiologist whose elderly patients need a continuous-monitoring solution that costs less than a gold bracelet and is easier to charge than a Tesla.
You have the idea. You know exactly who needs it. You probably have early sketches on a napkin, in a Notion doc, or on a slide deck you’ve shown three trusted colleagues.
What you don’t have is a clear picture of what happens between “I have an idea” and “my product is in the hands of patients or athletes.”
This is that picture.
We’ve taken healthcare professionals, sports coaches, and clinic owners from sketch to shipped product more than 150 times since 2016 — including for elite golf coaching, FDA-cleared neuromuscular stimulation, ESD-protection wristbands, smart misting systems for hospitals, baby-safety monitors, and remote patient monitoring platforms. The journey is more predictable than most first-time founders realize. It’s also more expensive in some places and significantly cheaper in others than the internet would have you believe.
Here’s the honest version.
Why Practitioners Make the Best Hardware Founders (and the Worst Engineers)
The strongest health and fitness hardware products in the market today were started by practitioners — not engineers. There’s a structural reason for this.
A physiotherapist who has tested 500 athletes has internalized something an engineer cannot: the specific, repeating moment of friction that real users experience. The seven-second pause where the data isn’t loading. The strap that doesn’t fit. The metric that everyone glances at but no one actually uses. The follow-up appointment that gets skipped because the at-home device is too confusing.
Practitioners see these moments. Engineers don’t, until practitioners point them out.
But practitioners also tend to make three predictable mistakes when they try to build the product themselves:
They underestimate how much engineering is involved. Building a hardware product that works is roughly 10x the work of building a software-only app. Connected hardware adds another 3x.
They overestimate their need to “own” the engineering. The companies that succeed don’t try to learn embedded firmware programming. They partner with engineering teams who have shipped these products before — and stay focused on the clinical or athletic insight that made the product worth building in the first place.
They assume they need a finished prototype before talking to anyone. The opposite is true. The earlier you bring engineers into the conversation, the cheaper the product becomes to build.
If you take nothing else from this article, take this seriously: most expensive mistakes in hardware happen in the first 90 days, not the last.
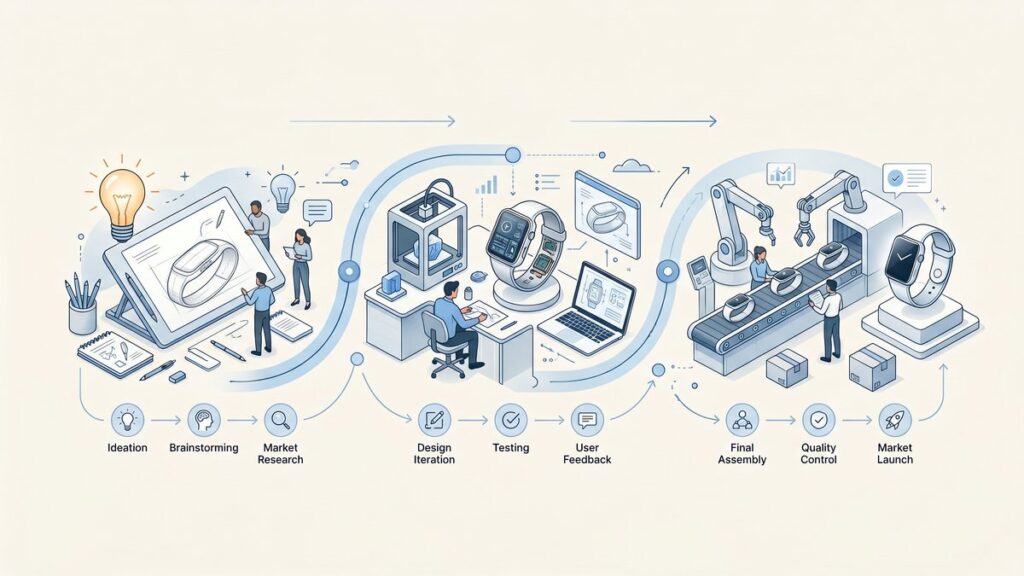
The Six Stages of Going From Idea to Shipped Device
Almost every successful product moves through the same six stages — usually 9 to 18 months from idea to shipped device.
Almost every successful product we’ve shipped has moved through the same six stages. The total journey is typically 9 to 18 months.
Stage 1 — Concept Validation (Weeks 1–4)
Before any hardware exists, before any sketches are real, you need to answer three questions on paper:
Who is this for, specifically? Not “physiotherapists.” A name. A clinic. A patient profile. The product gets clearer or vaguer based on the precision of this answer.
What measurement, signal, or stimulus does the device provide that nothing else does? If the answer is “the same as competitor X but cheaper” — stop. That product will be commoditized within 24 months. The successful products do something measurably different, not just similarly.
What does the user do with the device every day? Walk through the full daily workflow. Where does the device live when not in use? How does it charge? Who does the data go to? What happens if the user loses it?
You don’t need engineering for this stage. You need brutal honesty and conversations with 15–20 of your potential users. Cost: under $3,000, mostly time.
Stage 2 — Technical Feasibility (Weeks 5–8)
This is where engineers enter the picture, and it’s the stage most first-time founders skip — to their cost.
A good engineering partner spends 4–6 weeks producing a technical feasibility report covering:
Sensor selection. What hardware can actually measure what you need at the accuracy you need at the cost you need?
Wireless protocol decision. BLE, WiFi, cellular, or LoRaWAN? The choice constrains every downstream decision — battery life, cost, range, certification.
Power budget. How long does the device need to run between charges? That answer determines battery size, which determines product size, which determines what your product physically looks like.
Regulatory pathway. Is this a wellness product or a medical device? FDA 510(k), CE-MDR, or unregulated? The answer changes timeline and budget by 3–6x.
Cost-of-goods estimate. What will each unit cost to manufacture at 100 units, 1,000 units, and 10,000 units?
Cost: $5,000 to $6,000. This is the single highest-leverage spend in the entire journey.
Stage 3 — Prototype Development (Months 3–6)
The first physical prototype gets built. Not the final product — a working “ugly” version that proves the concept on a benchtop.
This stage typically includes:
Custom PCB design (the circuit board)
Initial firmware that captures and transmits data
A bare-bones companion app for testing
5 to 10 prototype units for internal trials
This is also where the BLE protocol gets designed — the structured “language” your device and app use to talk to each other. Most first-time founders don’t realize this is its own engineering discipline. It is. A poorly designed BLE protocol will haunt the product for its entire lifetime.
Cost: $20,000 to $30,000.
Stage 4 — Pilot Testing (Months 6–9)
Twenty to fifty units in the hands of real users. This is where the product stops being a theory.
You’ll discover:
Things that worked in your office that don’t work in a real clinic
Failure modes you didn’t anticipate (sweat, drop tests, battery anxiety)
App workflow problems that your engineering team would never have spotted but your users will name within five minutes
Whether the regulatory category you assumed at Stage 2 is actually correct
Your engineering team revises the firmware, app, and sometimes the hardware itself based on what the pilot reveals. Plan for one to three iteration cycles here. Most products that fail in market fail because they skipped this stage or rushed it.
Cost: $30,000 to $80,000 including hardware iteration.
This is where the product becomes legal to sell. Almost every connected health or fitness device needs some combination of:
FCC Part 15 (US) and CE RED (EU) — required for any product transmitting wireless signals. $15,000–$40,000.
Bluetooth SIG Qualification — required to legally use the Bluetooth trademark. $8,000–$10,000.
FDA 510(k) — if the product is classified as a medical device. $50,000–$300,000 and 6–18 months. (Most products you imagine as medical are actually wellness products and don’t need this — verify in Stage 2.)
IEC 60601-1 — medical electrical equipment safety. $30,000–$100,000.
IEC 62133 — battery safety. Required for most rechargeable products. $5,000–$15,000.
Plan certification from Day 1, not when you’re ready to launch. We’ve seen companies finish their hardware design and then discover that an antenna placement mistake killed their FCC certification. Fixing that mistake meant a new PCB revision, three lost months, and $300,000 unbudgeted.
Stage 6 — Manufacturing & Launch (Months 12–18)
The factory makes the product. The app launches on the App Store and Play Store. The cloud goes live. You ship.
This stage is more operational than engineering, but engineering still matters: OTA firmware update infrastructure, production-line testing protocols, and the customer support backend all get built here.
What It Actually Costs (Honest Numbers)
The realistic investment ranges for connected health hardware are wider than most first-time founders expect.
The internet will tell you a smart consumer hardware product costs $50,000 to launch. The internet is lying. Here are the real ranges based on more than 150 shipped products.
Product Category
Realistic Total Investment
Typical Timeline
Wellness wearable (no medical claims)
$100,000 – $200,000
4 to 6 months
Connected fitness device with companion app
$200,000 – $300,000
5 to 10 months
FDA-cleared medical device (Class I)
$500,000 – $1,200,000
10 to 12 months
FDA-cleared medical device (Class II, e.g., neurostimulator)
$1,000,000 – $2,500,000
10 to 12 months
Clinical-grade diagnostic device
$1,500,000 – $5,000,000+
12 to 24 months
These ranges include hardware, firmware, mobile apps (iOS + Android), cloud backend, certification, and pilot testing. They do not include marketing, manufacturing scale-up beyond initial production, or salaries for an in-house team.
If you’ve raised money for a connected health product and the budget is below the bottom of these ranges, something is being underestimated. We’d rather tell you that now than have you discover it 14 months in.
The Build vs. Outsource Question
For most first-time hardware founders, the math favors specialized partners over building an in-house team.
Practitioners often ask: do we hire an in-house engineering team, or partner with a development firm?
A realistic in-house team for a first connected product looks like one embedded firmware engineer, one iOS engineer, one Android engineer, one backend engineer, and a part-time QA. Fully loaded, that team costs $80,000 to $120,000 per month. Over 12 months, you’re committing more than $1 million before you’ve shipped a single unit. You also have to find, recruit, retain, and manage that team — which is roughly a full-time job in itself, and not the job you wanted to do.
For a first product, the math almost always favors specialized firms. In-house becomes the right call after you’ve shipped, validated the market, and have a clear two-year roadmap for v2 and v3.
What to Look For in an Engineering Partner
If you’re going to partner, the right partner has four characteristics:
They’ve shipped connected products in your category before. Not generic “IoT projects.” Actual health or fitness or sports products that exist on the market today. Ask for case studies. Ask to talk to their previous clients.
They lead with technical depth, not slides. A first conversation should leave you smarter, not sold to. If a partner can’t explain BLE background-mode constraints or the difference between FDA wellness and medical-device classification in five minutes, they haven’t shipped enough product.
They speak the language of your domain. A partner who has worked with clinicians, athletes, or coaches will understand that data accuracy isn’t negotiable, that the user is more demanding than a consumer, and that the regulatory layer changes everything.
They’re transparent about cost and timeline. A real partner gives you honest ranges and explains the variables. A weak partner gives you a single confident number and a 90-page pitch deck.
Where Most Practitioner-Founded Products Quietly Die
Most practitioner-founded hardware products fail for the same five reasons — all preventable in Stages 1 and 2.
We’ve seen the same five failure patterns repeatedly:
The product was a feature, not a category. “A better X” is rarely defensible. Successful products are categorically different.
The companion app was an afterthought. The hardware works; the app is unusable. Users abandon the product within 30 days.
Regulatory category was misdiagnosed. The team assumed wellness, the FDA classified it as medical, and the product is now in 18-month re-certification.
The data model was wrong. Sessions weren’t standardized, research-grade analysis was impossible, and the clinical credibility roadmap evaporated.
The team ran out of money before pilot testing. Hardware budget was right; everything around it (firmware, app, cloud, testing) was underestimated.
Each of these is preventable in Stage 1 or Stage 2. None are preventable once they happen.
A Final Word — Your Insight Is the Most Valuable Asset
If you’re a healthcare or fitness provider seriously considering building a connected device, the most valuable thing you bring to the project is not capital. It’s not even the product idea.
It’s the daily, weekly, year-after-year insight into the specific moment of friction that real users experience. That insight is what makes products that win in this category. It’s what we’ve seen drive every successful connected health product we’ve ever shipped.
Engineers can build anything. The hard part is knowing what to build. You already know that. The rest is execution.
What to Do Next
From sketch to shipped — what your finished product can look like with the right engineering partner.
If you have an idea for a connected health or fitness device and want to understand what it would actually take to build it, we offer a free 45-minute Product Feasibility Call. On the call we’ll:
Listen to your concept and the user problem you’re solving
IOTTIVE is an AIoT product engineering firm with teams in India, Europe, and North America. Since 2016 we have engineered connected products for 155+ companies across 30+ countries — with deep specialization in connected health wearables, sports technology, and FDA-cleared medical devices. Our portfolio includes Vertex Golf (used by 150+ tour professionals), BionicGym (FDA-cleared NMES wearable), Vagal Tones (medical vagus nerve stimulation), 360Care (HIPAA-compliant remote patient monitoring), and SafeyApp (FDA-cleared Bluetooth spirometer for asthma and COPD).
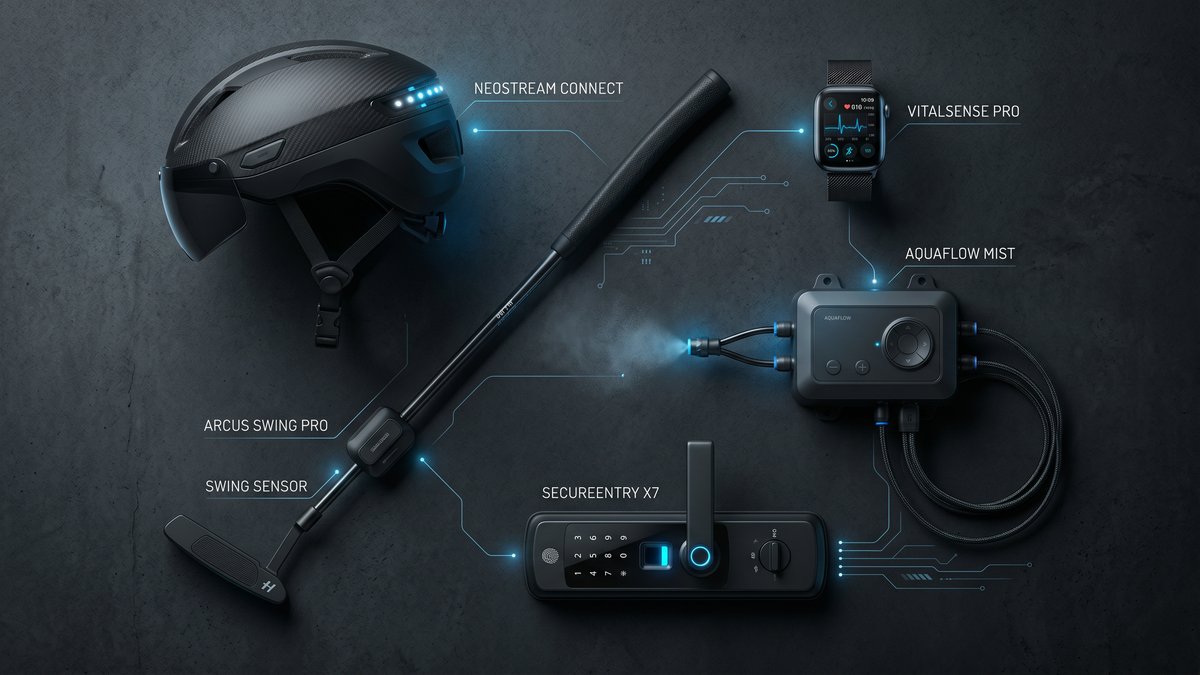
Connected products we have engineered span sports, industrial, safety, healthcare, and lifestyle categories.
By the Iottive Engineering Team · 18 min read · April 2026
In 2016, we sat across from the founder of a European golf-putter company. He had 150+ tour professionals using his product, a patent-pending sensor mechanism, and a problem: his hardware was brilliant, but the companion app felt like an afterthought. Golfers would record a practice session and then — nothing. No analysis. No feedback loop. No stickiness.
Two years later, that same putter — the Vertex SmartCore — had logged over 10 million putting strokes and became the preferred training tool for coaches of three major championship winners.
This playbook is the accumulated knowledge from engineering connected products for 155+ hardware companies over the past decade — across fleet management in Malta, climate sensors for citizen scientists, industrial misting systems in Italy, motorcycle safety in the United States, and luxury wireless chargers in Belgium.
What you will learn:
The six-layer architecture of a production-ready connected product
How to choose between BLE, Wi-Fi, LTE-M, and other protocols — with real tradeoff tables
The honest cost and timeline breakdown for a first MVP through production launch
When to build vs. buy each layer
How to avoid the five mistakes that derail 80% of IoT projects
A decision checklist you can use in your next planning session
Part 1: Why “Just Add Bluetooth” Fails
The most dangerous phrase in IoT product development is “we just need to add connectivity.”
Connectivity is not a feature. It is an architecture. Adding a BLE chip to a product without redesigning the firmware, power budget, security model, and data pipeline is like installing a jet engine on a bicycle and calling it an aircraft.
We have seen this failure mode play out dozens of times:
A glucose monitor manufacturer added BLE in week 11 of a 12-week sprint. Pairing worked in the lab. In the field, reconnection after sleep mode failed 40% of the time. The product recall cost $2.3 M.
A smart lock startup shipped firmware that allowed an unauthenticated BLE command to unlock the device from 30 feet away. The vulnerability was discovered by a security researcher on day one of public launch.
An industrial sensor company built a beautiful cloud dashboard — and forgot that their devices would be behind NAT firewalls on factory floors. Zero devices ever connected.
The pattern in all three cases: connectivity was treated as a layer added on top of the product rather than designed into the product from day one.
Part 2: The Six-Layer Architecture
Every connected product is built on six distinct engineering layers. A weak link in any one collapses the experience.
Every production-grade connected product is actually six products stacked on top of each other. Understanding these layers — and their interfaces — is the difference between a prototype and a shippable system.
Layer 1: Embedded Firmware
The firmware layer runs on your microcontroller or SoC. For BLE products, this typically means a Nordic nRF52 series or a Silicon Labs EFR32 — both offer mature SDKs, certified radio modules, and power management APIs that are well-documented.
Key firmware responsibilities in a connected product:
BLE stack management: advertising, connection, pairing, bonding, reconnection
GATT profile design: which services and characteristics expose your sensor data
Power state machine: transitions between active, sleep, and deep-sleep modes without losing BLE context
OTA update handler: accepting firmware images over BLE and writing them safely to flash
Watchdog and fault recovery: ensuring the device recovers from software faults without requiring a physical reset
A firmware mistake at this layer is the most expensive mistake you can make. Firmware bugs that reach mass production require physical recalls or complex OTA patches — both of which erode customer trust and burn cash.
Layer 2: The Radio Protocol
The protocol choice drives cost, power budget, range, and the app experience. Here is a simplified comparison for the most common options for consumer and light-industrial connected products:
Protocol
Range
Power
Requires Phone?
Monthly Cloud Cost (10k devices)
Best For
BLE 5.x
10–100 m
Very Low
Yes (or gateway)
$0 (device-side) + app infra
Wearables, medical, consumer
Wi-Fi (802.11)
30–50 m
High
No
$80–$400
Smart home, appliances
LTE-M / NB-IoT
Nationwide
Low–Med
No
$200–$2,000+
Fleet, logistics, field sensors
LoRaWAN
2–15 km
Very Low
No (gateway)
$50–$300
Agriculture, smart city
Zigbee / Thread
10–30 m
Low
No (hub)
$0–$100
Smart home mesh
For most hardware startups building their first connected product, BLE is the right starting point. It requires no monthly connectivity fees at the device level, ships with free certification on pre-certified modules, and the phone becomes your gateway — eliminating the need for a separate hub infrastructure.
Layer 3: The Mobile Application
For BLE products, the mobile app is not a companion — it is the gateway. Data does not reach your cloud unless the app is open (or running in background mode, which has its own battery and OS permission constraints).
This architectural reality has product implications that surprise many hardware founders:
Session-based data: If the user does not open the app for three days, three days of sensor data is buffered on the device (or lost, if the buffer overflows).
Background sync limits: iOS severely limits background BLE activity. Your app cannot maintain a persistent BLE connection while in the background on iOS without explicit user permission and a specific background mode declaration.
App store review risk: A rejected app update can block critical firmware OTA or security patches from reaching users.
For products where real-time data continuity is critical (medical monitoring, industrial alarms), a hardware gateway — not a phone — is often the right answer at Layer 3.
Layer 4: The Cloud Backend
The cloud backend is where your product becomes a platform. The core components:
Device registry: maps device serial numbers to user accounts, firmware versions, and last-seen timestamps
Telemetry ingestion: a high-throughput API endpoint (or MQTT broker) for receiving sensor data at scale
Time-series storage: purpose-built databases (InfluxDB, TimescaleDB, or AWS Timestream) outperform relational databases for sensor data by 10–100× at query time
OTA update service: manages firmware version targeting, rollout percentages, and rollback triggers
Auth service: device-level authentication (certificate-based or token-based), separate from user authentication
A common mistake: building a monolithic REST API for telemetry ingestion. At 10,000 devices syncing every 60 seconds, you are handling 167 requests per second — a load that will overwhelm a standard web API container and produce 5–9% data loss without proper queuing.
Layer 5: The Analytics and Intelligence Layer
Raw sensor data is not value. Processed insights are value. This layer transforms ingested telemetry into the outputs that make users retain your product:
Trend analysis and anomaly detection
Predictive maintenance signals
Personalized coaching or recommendations
Fleet-level aggregate dashboards (for B2B)
Alerting and notification triggers
This layer is where most MVP scopes get cut — and where the product value proposition lives. We consistently find that hardware companies that ship a basic analytics layer — even simple trend charts — see 2–3× higher 90-day retention than those that ship raw data views.
Layer 6: The Update and Lifecycle Layer
Connected products ship bugs. Regulations change. Features get added post-launch. Without a reliable OTA update mechanism, every firmware issue becomes a recall event.
A production OTA system requires:
Signed firmware images (prevents supply chain attacks)
Incremental rollout (release to 1% → 10% → 100% with automated rollback on error-rate spikes)
Dual-bank flash (so a failed update does not brick the device)
Update status reporting (so you know what percentage of the fleet is on each version)
OTA is not a nice-to-have. It is a regulatory requirement in the EU under the Cyber Resilience Act (effective 2027) and a practical necessity for any product with a shelf life longer than 18 months.
Part 3: Choosing Your Radio Protocol
The protocol decision is irreversible once hardware is manufactured. Making it based on demo convenience rather than production requirements is a frequent source of expensive redesigns.
BLE dominates consumer hardware for good reason: ubiquity, low power, low cost, and sufficient bandwidth.
When BLE Is the Right Choice
The user will have a smartphone nearby during product use
You need battery life exceeding six months on a coin cell
Your product is consumer or prosumer (wearable, fitness, medical, sports)
You cannot afford monthly connectivity fees per device
You need iOS and Android compatibility without custom hardware
When Wi-Fi Is the Right Choice
The product is always plugged in (appliances, smart home, industrial equipment near outlets)
You need always-on cloud connectivity without a phone intermediary
Data volumes exceed what BLE can efficiently transfer (>100 KB per sync)
You are building for enterprise or commercial environments with managed Wi-Fi infrastructure
When Cellular (LTE-M / NB-IoT) Is the Right Choice
The product moves or is deployed in locations without fixed infrastructure (vehicles, containers, field assets)
Guaranteed connectivity matters more than cost
The business model can absorb $1–10/device/month in connectivity fees
Real-time remote monitoring is a core feature, not optional
Part 4: Timeline Reality
The most common mismatch we see between hardware founders and engineering teams is on timeline expectations. Here is the honest breakdown, based on median delivery times across our project portfolio:
Phase
What Gets Built
Typical Duration
Discovery & Architecture
Protocol selection, system design, API contracts, risk registry
2–3 weeks
Firmware MVP
BLE stack, GATT profile, sensor integration, basic OTA stub
6–10 weeks
Mobile App MVP
BLE pairing, data display, user accounts, basic sync
8–14 weeks
Cloud Backend MVP
Device registry, telemetry API, auth, OTA service
6–10 weeks
Integration & QA
End-to-end testing, field testing, performance validation
3–5 weeks
Certification Support
FCC/CE pre-scan support, BLE SIG qualification
4–6 weeks
Total MVP Range: Over 6–8 months
These figures assume you already have hardware prototypes ready for firmware integration. If hardware is still in design, add 3–6 months for hardware bring-up and PCB spins.
The parallelization question: firmware and cloud development can run in parallel (using agreed API contracts as the interface). Mobile app development should start no earlier than week 4, once the BLE GATT profile is stable enough to build against. Starting mobile earlier typically produces 2–3 weeks of throwaway work as the firmware interface changes.
Part 5: Build vs. Buy at Each Layer
Not every layer needs custom development. Here is our current recommendation matrix based on build/buy economics:
Layer
Build Custom
Buy / Use Platform
Recommendation
BLE Firmware Stack
Full control, no licensing
Nordic SDK, Zephyr RTOS
Use established SDK. Do not write a BLE stack.
OTA Service
Full control over rollout logic
AWS IoT Jobs, Memfault, Mender
Buy for <50k devices. Custom above that threshold.
Mobile BLE Layer
Maximum flexibility
Nordic Blinky SDK, React Native BLE PLX
Use library. Do not rewrite CoreBluetooth/BluetoothGATT wrappers.
Cloud Telemetry
Full schema control
AWS IoT Core, Azure IoT Hub, InfluxDB Cloud
Hybrid. Use managed MQTT broker, build custom processing pipeline.
Device Auth
Full control, no vendor lock-in
AWS IoT Certificates, Particle, Blues
Buy. Device certificate management is a solved problem.
Analytics/ML
Proprietary algorithms = moat
AWS SageMaker, generic dashboards
Build. This is where your product IP lives.
Part 6: The Five Mistakes That Kill IoT Projects
Mistake 1: Skipping the Architecture Phase
The Architecture phase (Part 4 cost table, row 1) is the most frequently skipped and most frequently regretted phase. Starting firmware development without agreed API contracts and a validated protocol choice produces expensive divergence between the firmware, mobile, and cloud teams. In one engagement, a skipped architecture phase produced a 14-week delay and $180,000 in rework when the firmware team and cloud team discovered their assumed data formats were incompatible.
Mistake 2: Underspecifying the GATT Profile
The GATT profile — the BLE data schema that defines how your device exposes data to the mobile app — is your product’s API contract. Changing it after the mobile app is built requires synchronized releases of firmware and app, which is operationally complex once devices are in the field. We treat the GATT profile with the same discipline as a public API: versioned, documented, and change-controlled from day one.
Mistake 3: Ignoring iOS Background Restrictions
iOS 13+ introduced significant restrictions on background BLE activity. If your product’s user experience depends on the phone continuously syncing data from the device (sleep trackers, continuous monitors, sports sensors), you will encounter this constraint in user testing. The mitigation options are: (a) use a hardware gateway instead of a phone, (b) design for session-based sync with on-device buffering, or (c) use Apple’s Core Bluetooth background mode with explicit documentation to users about battery impact. There is no option (d) that bypasses the OS restriction.
Mistake 4: Using a Relational Database for Telemetry
PostgreSQL and MySQL are excellent databases for user data, device registry, and configuration. They are poor databases for high-frequency time-series sensor data. At 10,000 devices logging once per minute, a relational database storing raw telemetry will begin experiencing performance degradation within 18–24 months. We have migrated three clients from relational to time-series storage in production — a painful, expensive operation that is entirely avoidable by making the right choice at architecture time.
Mistake 5: Treating Security as a V2 Feature
BLE security is not the default. Out-of-the-box BLE connections are unencrypted and unauthenticated. Implementing LE Secure Connections pairing, encrypting GATT characteristics, and validating device identity against a certificate stored at provisioning time are all engineering tasks that require explicit design and implementation effort.
The cost of retrofitting security into a shipped product: 3–6× the cost of building it in from the start, plus the reputational risk of a public disclosure in the interim.
Part 7: Real Projects, Real Numbers
Theory is useful. Numbers are better. Here are four real projects (anonymized by industry and geography, consistent with client NDAs) with actual delivery metrics:
Project A: Fleet Telematics Platform (Malta)
Product: LTE-M asset tracker for commercial vehicle fleet, 1,200 devices at launch.
Timeline: 9 months from kickoff to production deployment.
Cost: Hardware BOM: €38/unit.
Key challenge: NAT traversal for devices behind carrier-grade NAT. Solved with MQTT over TLS with persistent keepalive and server-side last-will messages for disconnect detection.
Result: 99.2% uptime across the fleet in year one. Client expanded to 4,800 devices in month 18.
Project B: Consumer Health Wearable (Belgium)
Product: BLE wrist sensor for continuous HRV monitoring, targeted at biohacker market.
Key challenge: iOS background sync. Solved by implementing on-device circular buffer (72 hours of HRV data) and session-based sync when app opens, eliminating dependency on background mode entirely.
Result: 4.6-star App Store rating at launch. 68% 90-day retention (category average: 23%).
Project C: Industrial Misting Control System (Italy)
Product: Wi-Fi connected misting controller for commercial greenhouse and hospitality environments.
Stack: ESP32 firmware with custom Wi-Fi provisioning flow, MQTT backend on AWS, React Native app + web dashboard.
Timeline: 11 months (extended due to CE certification iterations).
Cost: Hardware BOM: €54/unit.
Key challenge: Reliable Wi-Fi provisioning in commercial environments with enterprise WPA2-Enterprise networks. Solved by implementing both soft-AP provisioning and Bluetooth-assisted provisioning as fallback.
Result: Deployed in 340 commercial sites across Italy and Germany. Zero remote support tickets related to connectivity in months 6–18 post-launch.
Timeline: 14 months to FCC/DOT certification submission.
Cost: Hardware BOM: $67/unit at 2,500-unit MOQ.
Key challenge: False-positive crash detection leading to unnecessary SOS triggers. Solved with a two-stage algorithm: accelerometer threshold trigger followed by a 20-second confirmation window with a cancel button, reducing false positives by 94%.
Result: Became the first DOT-certified smart helmet with integrated LTE-M emergency dispatch. Featured in Wired and TechCrunch at launch.
Part 8: Your Pre-Kickoff Checklist
A realistic 90-day path from idea to validated connected-product MVP.
Before committing budget to a connected product development engagement, validate these ten questions. If you cannot answer more than three, the architecture phase is not a phase you can skip.
What is the primary connectivity protocol, and why? (Not “we need connectivity” — the specific protocol and the specific reason.)
What is the expected battery life, and what is the power budget per BLE advertisement / sensor read cycle?
Where will data be stored on the device when the app is not connected, and what happens when the buffer fills?
What is the OTA update delivery mechanism, and who controls rollout targeting?
What is the device authentication model (certificate, token, or none)?
What is the telemetry schema, and who owns schema versioning?
What analytics or intelligence outputs will drive user retention?
What regulatory certifications are required (FCC, CE, UKCA, MDD, FDA), and are they budgeted?
What is the support model for devices in the field after launch?
What is the sunset plan for devices when the cloud backend is eventually decommissioned?
Conclusion: Connectivity Is a Strategy, Not a Feature
The hardware companies that have successfully shipped connected products — the ones whose products are still running reliably three, five, eight years after launch — share one characteristic: they treated connectivity as a core architecture decision, not a feature added to an otherwise-complete product.
The golf putter company from the opening of this playbook succeeded not because we added BLE to their sensor. It succeeded because we redesigned the firmware power state machine, specified a GATT profile that exposed the right data for the app to deliver meaningful coaching, built a sync architecture that buffered 30 days of practice data on-device, and delivered an analytics layer that turned raw stroke data into actionable technique feedback.
Connectivity was not added. It was designed in.
If you are planning a connected product launch in 2026, the questions in Part 8 are a good starting point for your next internal planning session. If you would like a technical architecture review of your current design, our team at Iottive offers a no-commitment architecture review for hardware companies at the pre-development or early-development stage.
Iottive is a specialist IoT and embedded engineering firm with a track record across 155+ connected hardware products. Our work spans BLE wearables (fitness, medical, sport), Wi-Fi connected appliances, LTE-M asset trackers, and LoRaWAN environmental sensor networks. Case studies include fleet telematics in Malta, smart home products in Belgium, industrial automation in Italy, climate science instrumentation for academic research, luxury chargers), and life-safety technology (motorcycle helmets).
Long lines at the cash register are a major headache for shoppers. They hurt the customer experience and limit how much a store can sell. This is especially true during busy times like holidays or weekends.
For store owners, these delays are more than just an annoyance. They represent lost sales and frustrated shoppers who might not return. Retailers need a better way to handle high traffic without adding more staff or checkout lanes.
Modern technology offers a powerful solution. Automated checkout systems can speed up transactions dramatically. This allows a business to serve more people in less time, turning a bottleneck into an opportunity.
The move toward automation is changing the fundamental shopping journey. It creates a smoother, faster, and more pleasant experience for everyone. This guide explores how this innovation works and why it’s essential for modern commerce.
Key Takeaways
Long checkout lines drive customers away and cap sales, especially during peak hours.
Automated systems are a direct answer to improving store throughput and efficiency.
This technology addresses core operational challenges for retailers.
Shoppers today expect speed and convenience at every point of sale.
Implementing these solutions can lead to higher customer satisfaction and loyalty.
Stores can handle significantly higher transaction volumes without physical expansion.
The right tools transform the payment process from a wait into a seamless moment.
Introduction to Smart Retail Checkout Automation
A seamless fusion of in-store experiences and digital capabilities defines today’s retail landscape. This blend, often called smart retail, uses technology to support every shopper interaction.
It specifically tackles the frustrating bottleneck at the register during busy periods. Long waits drain staff resources and often lead to abandoned carts.
Automated solutions range from self-service kiosks to cashier-less formats. These tools track purchases using sensors and computer vision.
The value extends beyond convenience. It optimizes labor, improves accuracy, and gathers vital purchase data.
Modern systems connect with existing store infrastructure. This creates a unified ecosystem for management and sales.
Aspect
Traditional Checkout
Automated Checkout
Staffing Requirement
High (1+ cashiers per lane)
Low (monitoring only)
Transaction Speed
Slower, manual scanning
Faster, seamless processing
Customer Experience
Often frustrating queues
Streamlined, self-directed
Integration Capability
Limited, often standalone
High, connects to inventory & CRM
Cost Efficiency
Higher ongoing labor costs
Lower operational overhead
Early adopters see much higher transaction throughput. This technology is now accessible for mid-size establishments seeking a competitive edge.
The Evolution of Retail Automation & AI Integration
Retail operations have transformed dramatically since the first barcode was scanned decades ago. What began in the 1970s as simple price tracking has evolved into sophisticated, AI-powered Retail Automation. Today’s merchants face immense pressure from ecommerce, rising costs, and wage demands. This makes advanced systems essential for survival.
The current frontier is AI in Retail. Machine intelligence analyzes vast amounts of customer data. It predicts demand, optimizes pricing, and personalizes shopping at scale. This artificial intelligence creates competitive advantages traditional stores cannot match.
Market projections confirm this shift is accelerating. The global AI in retail market is expected to reach $15.3 billion by 2025. Overall retail automation is set to hit $33 billion by 2030. According to McKinsey, generative AI could unlock $240 to $390 billion in value for the sector.
This evolutionary trajectory shows no signs of slowing. Emerging technology like advanced computer vision continues to expand possibilities. For modern retailers, integrating these intelligent systems is no longer just an option. It is the key to future growth and efficiency.
Benefits of Smart Billing Process and AI in Retail
Implementing intelligent checkout systems delivers concrete advantages for both store operations and the people shopping there. These benefits directly tackle the core challenges of modern commerce.
Enhanced Operational Efficiency
The Smart Billing Process fundamentally transforms store economics. It cuts the labor intensity of checkout while boosting transaction speed and accuracy.
This efficiency allows businesses to reallocate staff from repetitive tasks. They can focus on higher-value work like personalized service and inventory management.
According to a Capgemini survey, retailers using this technology noted an 11% rise in customer visits. Superior operations attract more foot traffic and improve the overall shopping experience.
Reduced Customer Wait Times
This addresses the primary friction point in any store. Long lines directly cause lost sales, as many shoppers simply leave without buying anything.
Automated systems process transactions in a fraction of the time. Some formats even eliminate the wait entirely by charging shoppers as they exit.
Data shows broad acceptance of this convenience. Over 74% of people prefer automated interactions for common queries. This comfort extends directly to a faster, frictionless checkout time.
Smart Retail, Retail Automation, Smart Billing Process, AI in Retail, Smart IoT
The physical store is undergoing a digital metamorphosis, powered by interconnected devices and real-time data streams. This network of sensors and smart equipment forms the foundation of a responsive commercial environment.
Market projections highlight this massive shift. The IoT-enabled retail sector is predicted to be valued at $94 billion by 2025. This growth reflects the unlimited possibilities these breakthroughs provide.
These connected technologies create a synergistic stack. Shelf monitors track inventory, while beacons enable personalized marketing. The entire ecosystem gathers continuous data on operations and shopper behavior.
For retailers, this delivers unprecedented visibility. It enables data-driven decisions across all business functions. The integration with artificial intelligence creates self-improving systems that adapt automatically.
Comprehensive solutions offer a clear competitive edge. They boost productivity, enhance the customer experience, and establish new, insight-based business models. This connected intelligence is now essential for modern commerce.
Cutting-Edge AI and IoT Technologies in Smart Retail
Modern commerce now hinges on the seamless integration of predictive software and sensor networks. This fusion, known as AIoT, combines real-time data collection with analytical intelligence.
Smart shelf sensors monitor stock levels instantly. They connect to enterprise software to automate reordering. This prevents empty shelves and optimizes supply chains.
Cameras and beacons track shopper dwell time. This behavioral data identifies genuine product interest. Stores can then trigger personalized offers at the perfect moment.
Edge computing processes information locally on kiosks and carts. It enables ultra-fast, personalized promotions without latency. Computer vision systems analyze customer movements for deeper insights.
Store Function
Traditional Approach
AIoT-Enabled Solution
Inventory Management
Manual stock checks
Automated, sensor-driven alerts
Customer Insight
Surveys & guesswork
Real-time behavioral tracking
Checkout Process
Cashier-dependent
Sensor fusion for seamless exit
Data Analysis
Periodic reports
Continuous machine learning
Connected platform architectures unify disparate store systems. They create a single ecosystem for smooth information flow. Machine learning algorithms find patterns in this data.
These advanced solutions give retailers proactive decision-making power. They move from reactive operations to predictive management. This technology stack is the new foundation for competitive stores.
Customer Experience Revolution with Smart IoT Innovations
Innovative technologies are turning routine shopping trips into curated journeys of discovery. Connected devices and data now allow stores to anticipate needs and remove friction at every step.
This revolution moves beyond simple transactions. It builds deeper relationships through tailored interactions.
Personalized Interaction Strategies
Advanced personalization leverages purchase history and real-time behavior. For example, Sephora’s Color IQ scans a shopper’s skin to match perfect foundation shades.
These AI-generated recommendations link directly to loyalty accounts. They ensure consistent experiences across all channels.
Relevance builds trust. A significant 72% of consumers trust companies more when recommendations feel highly relevant to their needs.
This data-driven approach transforms marketing into contextual commerce. Offers appear precisely when interest is demonstrated.
Frictionless Checkout Experience
The pinnacle of convenience is eliminating the wait. Amazon’s Just Walk Out technology uses ceiling cameras and shelf sensors.
It automatically identifies selected items and charges customers as they exit the store. Checkout time drops to zero seconds.
Complementary tools like Dash Carts track purchases in real-time. Shoppers see a running total and finalize payment without stopping.
These innovations respect the shopper’s most valuable resource—time. They dramatically enhance customer satisfaction and loyalty by delivering a superior, modern experience.
Optimizing Inventory and Supply Chain Efficiency with Automation
Billions of dollars are lost annually by merchants due to two opposing problems: empty shelves and overstocked backrooms. This chronic inventory inefficiency stems from poor tracking and forecasting.
Connected tracking sensors now provide complete visibility. They monitor a product‘s journey from manufacture to final purchase in real-time. Three-quarters of merchants plan to use this technology for supply chain management.
Item-level tagging boosts inventory accuracy to 95%. This eliminates the discrepancies that plague manual stock counts.
Management Aspect
Traditional Method
Automated System
Accuracy Rate
~65-75% (manual counts)
~95% (RFID/sensor tags)
Reorder Trigger
Periodic review & guesswork
Real-time analytics & alerts
Demand Forecasting
Historical sales only
Multi-source data (trends, weather)
Perishable Goods Monitoring
Spot checks
Continuous temperature tracking
Intelligent systems analyze stock levels continuously. They suggest optimal reorder quantities to prevent shortages without excess capital tied up.
Advanced forecasting, like H&M’s system, processes social media trends and local event data. It predicts which items will surge in specific regions.
Real-time visibility enables dynamic product allocation across stores. This optimizes distribution and reduces waste from unsold merchandise.
For perishables, temperature sensors maintain quality throughout the cold chain. They alert operations teams to potential issues before losses occur. This end-to-end automation creates a lean, responsive, and highly efficient supply chain.
Real-World Case Studies Transforming Retail Automation
Pioneering companies have turned theoretical automation concepts into operational realities. These real-world examples from leading brands show measurable results across different store formats.
Amazon Go: The Cashier-Less Experience
Amazon Go stores represent a revolutionary leap. Shoppers scan an app, pick items, and walk out. The system uses computer vision and deep learning to track selections.
Automatic charging happens without any checkout line. This technology slashes wait times and labor costs dramatically. It defines the ultimate frictionless shopping experience.
Walmart & Sephora: AI in Action
Established retailers use artificial intelligence to stay competitive. Walmart employs AI algorithms for inventory and supply chain management.
This reduces stockouts and minimizes excess stock. Sephora analyzes customer data to offer personalized product tips. Its Virtual Artist feature uses augmented reality for virtual makeup trials.
Company
Core Technology
Primary Benefit
Impact Metric
Amazon Go
Computer Vision & Sensor Fusion
Eliminates Checkout Queues
Near-Zero Wait Time
Walmart
AI Forecasting Algorithms
Optimized Inventory Levels
Reduced Stockouts
Sephora
AI & Augmented Reality
Personalized Customer Experience
Increased Conversion Rates
These case studies prove automation delivers value. It enhances customer experience and operational efficiency for modern companies.
Overcoming Peak Hour Billing Queues with Automated Checkout Systems
Abandoned carts at the register represent a direct revenue leak that retailers can no longer ignore. This scenario peaks during high-traffic hours when billing queues stretch longest.
Shoppers consistently rank checkout as the most tedious and time-consuming part of their trip. Many will simply leave without completing a purchase rather than wait.
Automated checkout systems directly attack this problem. They process transactions much faster and can handle higher volumes of people.
In advanced setups, they eliminate queues altogether through cashier-less technology. This protects sales that would otherwise be lost to frustration.
Streamlined Payment Processes
These modern processes use connected devices to automate the point of sale. Sensors read product tags as a customer exits, charging them via a mobile app.
This automation stops the common situation where long waits kill potential sales. It ensures people complete their intended purchases.
Enabled point-of-sale systems are often portable and cloud-based. A store can deploy pop-up stations during rush times to spread out the flow.
Cashierless payment also tracks inventory in real time and gathers valuable shopper data. This provides operational benefits beyond just transaction processing.
Implementing such automation lets businesses manage sudden spikes in transactions. They do this without needing to hire proportionally more staff.
This change fundamentally improves operations during the busiest periods. It turns a major pain point into a seamless experience for customers.
Leveraging Data Analytics and Machine Learning for Retail Growth
Beyond speeding up transactions, the next frontier for stores is using predictive insights to fuel growth. Advanced analysis turns the vast streams of operational and customer data into a clear strategic advantage.
This intelligence layer helps stores shift from reactive reports to proactive planning. Predictive models anticipate market shifts before they fully happen.
Dynamic pricing algorithms are a prime example. They analyze competitor actions and shopper behavior in real-time. This automatically adjusts prices to protect margins and boost sales.
Furthermore, machine learning excels at spotting unusual patterns. It identifies suspicious transactions as they occur, minimizing financial risk.
Forecasting models synthesize historical sales data, trends, and external factors. They predict future demand with great accuracy.
This helps retailers optimize stock levels and marketing spend. It avoids costly overstock and targets campaigns for maximum return.
Ultimately, these tools reveal hidden opportunities for revenue and growth. They enable merchants to serve customers better and operate more efficiently.
The systems learn continuously, improving their predictions over time. This creates a compounding advantage for businesses that invest in these capabilities.
Conclusion
Adopting modern checkout systems is no longer a luxury for forward-thinking merchants; it’s a core requirement for survival. Early adopters gain a compounding data advantage that refines operations and deepens customer insight.
This creates a performance gap competitors cannot quickly bridge. The right solutions turn information into better decisions, directly fueling businessgrowth.
Successful implementation strategies are holistic. They integrate new technologies with staff training and process updates.
For retailers, the central question is no longer “if,” but “how fast.” Moving now secures a decisive edge in revenue, efficiency, and future readiness for the evolving retail landscape.
FAQ
How does automated checkout directly improve efficiency for businesses?
Automated checkout systems streamline the entire payment process, significantly reducing transaction times. This allows staff to focus on higher-value tasks like customer service and restocking, boosting overall productivity. The result is a smoother operation that can handle higher sales volume without increasing labor costs.
What role does artificial intelligence play in managing store inventory?
Artificial intelligence analyzes sales patterns and historical data to predict future demand with high accuracy. This enables precise stock management, preventing both overstocking and out-of-stock situations. Platforms like those used by Walmart optimize supply chains, ensuring products are available when and where customers need them.
Can these technologies create a more personalized shopping experience?
Absolutely. By leveraging data from intelligent sensors and purchase history, businesses can tailor promotions and product recommendations to individual shoppers. Brands like Sephora use this approach to enhance engagement and build stronger customer loyalty through relevant, personalized interactions.
What is a real-world example of a frictionless checkout system?
Amazon Go stores are a prime example. They utilize a network of cameras and sensors to track items customers take off shelves. Shoppers simply walk out, and their account is automatically charged, eliminating traditional billing queues entirely and revolutionizing the in-store experience.
How do Internet of Things (IoT) devices help during peak shopping hours?
Connected devices and smart shelves monitor stock levels in real-time and can alert staff instantly when items are low. This, combined with self-service kiosks and scan-and-go apps, distributes the checkout workload. It prevents long lines from forming during busy periods, improving satisfaction for everyone.
How does machine learning contribute to a store’s growth strategy?
Machine learning algorithms sift through vast amounts of transaction and customer behavior data to uncover deep insights. These models identify trends, forecast sales, and optimize pricing strategies. This intelligence empowers companies to make data-driven decisions that directly increase revenue and market share.
How Iottive Delivers End-to-End Smart Retail Solutions
1. Retail Strategy & Solution Design
Iottive collaborates with retail leaders, digital heads, store operations teams, and supply chain stakeholders to understand customer journeys, inventory challenges, and growth objectives. This phase includes retail use-case validation, omnichannel architecture design, IoT device selection, AI personalization planning, and defining measurable KPIs such as promotion ROI, stock accuracy, and conversion rates.
2. Smart Systems Engineering & Retail Integration
Iottive engineers scalable Smart Retail solutions by integrating IoT sensors, RFID, smart shelves, digital mirrors, edge devices, and cloud platforms. We ensure seamless connectivity between POS systems, ERP, CRM, warehouse systems, and e-commerce platforms. The focus is on real-time visibility, secure data flow, and unified customer and inventory intelligence across stores and digital channels.
3. Pilot Deployment in Stores & Warehouses
Before enterprise rollout, Iottive deploys pilot solutions in selected retail stores, warehouses, or pharmacy locations. This includes testing AI-driven recommendations, smart inventory tracking, cold chain monitoring systems, and digital try-on experiences. Retailers can validate performance, customer engagement impact, and operational feasibility in live environments before scaling across locations.
4. Customer Experience & Retail Intelligence
Iottive builds intuitive dashboards and retail intelligence platforms that provide real-time insights into:
Customer behavior & segmentation
Promotion performance & ROI
Store-level inventory accuracy
Warehouse efficiency metrics
Cold chain compliance tracking
Online conversion and upsell analytics
Advanced analytics, alerts, and AI-driven insights empower retail teams to make faster, data-driven decisions that improve revenue, reduce losses, and enhance customer satisfaction.
5. Enterprise Rollout & Retail Scale-Up
From MVP to multi-location deployment, Iottive supports solution hardening, cloud scalability, cybersecurity, and long-term support. Smart Retail solutions are designed for:
Multi-store expansion
Omnichannel integration
Regional inventory balancing
Cross-border retail operations
Continuous optimization using AI insights
Our approach ensures measurable ROI through improved customer engagement, reduced shrinkage, better inventory control, and operational efficiency.
Why Retailers Choose Iottive
Proven expertise in Smart Retail & IoT-driven transformation
Deep understanding of store operations, warehousing, and pharmacy compliance
Seamless integration with POS, ERP, CRM, and e-commerce platforms
Secure, scalable, and production-ready retail architectures
Strong focus on measurable business outcomes — not just technology
The industrial landscape is undergoing a profound transformation. Traditional production facilities are evolving into intelligent, interconnected ecosystems as manufacturers deploy data-driven technologies to stay competitive in a volatile global economy.
According to a Deloitte survey, 92% of executives at large manufacturing companies view digital transformation as a primary driver of competitiveness, and 85% expect it to fundamentally change how products are made (source: Deloitte Industry 4.0 survey).1 These figures reflect widespread industry commitment to smart manufacturing and investment in connected systems.
When factories combine sensors, cloud analytics, and automation, they unlock measurable gains: improved production output, higher product quality, and greater operational efficiency. For example, several manufacturers report production output increases in the 10–20% range after deploying integrated IoT and analytics stacks (see industry case studies).2
This guide explains how IoT and related technologies form the foundation for Smart Manufacturing Factories. We will walk through core components, practical use cases, and the steps manufacturers take to move from pilot projects to scaled production.
Key Takeaways
Smart manufacturing is widely recognized as essential for future competitiveness.
Intelligent, interconnected systems are replacing traditional production methods.
Companies are achieving significant improvements in output and productivity.
This transformation represents a fundamental shift in how products are designed and produced.
Real-time data-driven decision-making is central to operational excellence.
Connected factories enable faster responses to market demand while supporting sustainability goals.
See the section “How Iottive Pvt. Ltd. Supports End-to-End IoT Productization” near the conclusion for a practical partner example on product design, hardware, firmware, apps, testing, and commercialization support.
Next: we examine the core building blocks of IIoT systems and how they deliver operational intelligence across the factory floor.
Exploring the Future of IoT-Enabled Manufacturing
The blueprint for next-generation industrial operations is built on interconnected networks of intelligent devices. This foundation—commonly called the Industrial Internet of Things (IIoT)—creates a continuous stream of operational intelligence that drives smarter, faster decisions across the factory floor.
In practice, the internet of things connects equipment sensors, vision cameras, actuators, and robots with edge and cloud compute. Where available, high-bandwidth options such as private 5G or industrial Wi‑Fi increase throughput and lower latency, enabling more real-time controls and richer telemetry for analytics.
Defining IoT in Modern Production
IIoT integrates people, machines, and systems into a cohesive digital framework. Operational intelligence here means the continuous ingestion and interpretation of sensor and process data to support automated responses and human decisions. Typical flows look like: vibration sensor → edge pre-processing → anomaly detected → cloud model predicts failure → maintenance ticket created.
Typical IIoT stack (high-level):
Edge devices and sensors (temperature, vibration, vision)
Edge compute and gateways (local preprocessing, ML inferencing)
Cloud platforms and data lakes (storage, model training, orchestration)
Applications and dashboards (operator HMIs, executive analytics, mobile apps)
With this stack in place, real-time data flows drive predictive models and closed-loop controls. Facilities gain visibility into equipment performance, material flows, and product quality—information that directly improves production efficiency and reduces operating costs when teams act on the insights.
See how an IIoT stack is implemented in practice in the section “How Iottive Pvt. Ltd. Supports End-to-End IoT Productization” for an example workflow and toolchain.
Industry Trends and Developments in Smart Manufacturing
Contemporary production environments face a complex mix of market, regulatory, and economic pressures. Demand for personalized products and stricter environmental standards are reshaping how manufacturers design production systems and source materials.
Companies that embrace smart manufacturing technologies can shift from mass-produced, identical runs to more flexible, small-batch and customized production while maintaining cost discipline.
Evolving Market Demands and Sustainability
Mass production is giving way to customization: consumers increasingly expect unique products and faster delivery. This trend pushes manufacturers to adopt agile production techniques and modular systems that support frequent changeovers and short product runs.
Sustainability has moved from a nice-to-have to a business requirement. Regulations such as the EU Green Deal and retailer sustainability commitments are forcing manufacturers to report emissions and material provenance. IoT-driven energy monitoring and process optimization are proven solutions: connected sensors and analytics can cut energy use and waste, helping companies meet regulatory targets and deliver measurable environmental benefits.
Impact of Global Economic Factors
At the same time, global instability—geopolitical tensions, commodity shortages, and logistics disruptions—creates pressure on traditional supply models. The modern supply chain is more exposed to shocks, which increases the need for visibility and flexibility.
Manufacturers face several interrelated issues:
Fragile international logistics networks that extend lead times
Shortages of skilled labor in specialized production roles
Rising cost pressures from materials and transportation
Adopting advanced technologies and data-driven solutions is the practical path to resilience. Smart factories that combine sensors, analytics, and flexible automation can better anticipate supply disruptions, optimize resource use, and maintain consistent product quality—delivering both operational benefits and stronger market positioning.
Core Technologies Driving Smart Factories
Modern smart manufacturing relies on an integrated stack of data-first technologies that work together to deliver operational intelligence and continuous improvement. When combined correctly, these solutions give manufacturers the visibility and control needed to optimize production, reduce waste, and scale across sites.
Big Data, Cloud Integration, and the Internet of Things
Big data platforms ingest large volumes of time-series and event data from machines, sensors, and production systems to reveal patterns missed by manual analysis. Cloud computing supplies elastic storage and compute capacity for model training, cross-site analytics, and centralized dashboards—capabilities that are especially valuable for multi-site manufacturing operations.
IoT networks link sensors and devices across the factory: temperature, vibration, and current sensors provide equipment telemetry; vision systems capture quality data; and PLC/robot interfaces report process states. Edge gateways perform local filtering and preprocessing so only relevant telemetry and anomalies are sent to the cloud for deeper analysis and long-term storage.
Recommended high-level architecture: edge devices → connectivity (Ethernet, private 5G, industrial Wi‑Fi) → edge compute/gateways → cloud data & analytics → apps & dashboards. Each layer has distinct implementation and cost drivers—sensors and gateways are hardware-focused; cloud and analytics demand software and data engineering expertise.
Digital Twins and Advanced Sensor Systems
Digital twins are virtual models that mirror physical production assets, lines, or entire plants. Use cases include layout optimization, throughput simulation, scenario testing (e.g., change in product mix), and “what-if” analyses to validate process changes before applying them on the shop floor. Digital twins improve confidence in change management and reduce commissioning time for new lines.
Advanced sensor suites—especially machine vision combined with edge inferencing—enable automated quality inspection and near real-time defect detection. While no system guarantees absolute zero defects, vision plus ML-based analytics helps manufacturers approach zero-defect targets by catching subtle anomalies earlier than human inspection alone.
Sensor data feeds cloud-based analytics that retrain and refine digital twin models, creating a closed-loop improvement cycle: sensors → analytics → updated models → control or operator guidance. This synergy progressively increases throughput and product quality while reducing downtime.
Implementation Notes
Maturity & priorities: start with high-value use cases (predictive maintenance, quality inspection) before committing to full-scale digital twins.
Cost drivers: sensors, wiring, gateways, edge compute, cloud storage, and custom analytics development—budget for integration and change management.
Vendors & partners: expect to combine hardware suppliers, connectivity providers, cloud platforms, and system integrators; choose partners with manufacturing domain expertise.
Practical tip: include a short pilot that integrates sensors, an edge gateway, and a basic analytics dashboard to prove value before scaling. For help with digital twin modeling, sensor integration, and hardware-software co-design, see the section “How Iottive Pvt. Ltd. Supports End-to-End IoT Productization” later in this guide.
Enhancing Production through Automation and Robotics
Automation has shifted from a desirable upgrade to a strategic requirement for competitive manufacturing. Recent industry surveys show a strong focus on both process and physical automation investments, as companies prioritize faster cycle times, consistent product quality, and lower operational costs.
Automated Storage Systems and Material Handling
Automated storage and retrieval systems (AS/RS), conveyor automation, and robotic picking/packing form the backbone of modern material handling. These centralized systems manage inventory with precision and speed, reduce manual errors, and shorten lead times between storage and production.
Typical benefits include reduced throughput time, lower labor costs for repetitive tasks, and improved inventory accuracy—many adopters report measurable ROI within 12–36 months depending on scale and complexity.
Autonomous Mobile Robots in Action
Autonomous mobile robots (AMRs) and automated guided vehicles (AGVs) handle repetitive material transport tasks with accuracy while requiring minimal fixed infrastructure. Their route flexibility allows factories to reconfigure production lines faster than with fixed conveyors.
For example, in mixed-model production environments, AMRs enable shorter changeover times and smoother flows to assembly stations—helping maintain consistent production rates when product mixes change.
Integrating automation and robotics creates a more efficient material-flow ecosystem. Companies that combine AS/RS, AMRs, and process automation commonly see meaningful reductions in cycle times and operational costs, while freeing human workers to focus on higher-value activities such as quality control, supervision, and continuous improvement.
Human + Robot: Workforce Transition
Automation doesn’t replace workers so much as shift their roles. Manufacturers should plan upskilling programs focused on systems operation, robot supervision, basic programming, and maintenance. A successful transition includes defined career paths, hands-on training, and collaboration between engineering and HR to retain institutional knowledge.
AI and Machine Learning in Optimizing Manufacturing Processes
Advanced computational capabilities are turning traditional manufacturing methods into predictive, self-improving systems. Artificial intelligence (AI) and machine learning (ML) form the cognitive core of modern production environments, using operational data to detect patterns, forecast outcomes, and recommend corrective actions faster than manual analysis.
Machine learning models apply statistical and computational techniques to sensor and process data to identify subtle correlations that humans might miss. When deployed at the edge or in the cloud, these models enable real-time insights and automated interventions that improve uptime, product quality, and throughput.
Predictive Maintenance Strategies
Predictive maintenance uses ML to analyze equipment sensor data (vibration, temperature, current) and historical failure records to forecast when machines will need service. By scheduling maintenance during planned windows, manufacturers can significantly reduce unplanned stoppages and extend asset lifetimes.
Typical KPIs for predictive maintenance pilots:
Mean Time Between Failures (MTBF)
Mean Time To Repair (MTTR)
Reduction in unplanned downtime (targeted %)
Maintenance cost per asset
Industry reports commonly cite unplanned downtime reductions in the tens of percent after mature predictive programs—actual results vary by asset criticality and data quality. Implementation decisions (edge inferencing vs. cloud scoring) depend on latency requirements and bandwidth constraints.
Quality Assurance and Process Optimization
Computer vision and ML-driven analytics automate quality inspection, spotting defects and deviations that are difficult for human inspectors to detect consistently. ML continuously analyzes production data to surface root causes, enabling rapid corrective actions that improve product quality.
Process optimization uses AI to model complex relationships among temperature, speed, humidity, and other parameters to find operating settings that maximize throughput while maintaining product quality. These models can run in simulation or as live controllers to tune setpoints dynamically.
Selecting and Running an ML Use Case
Practical guidance for starting an ML initiative:
Choose a high-value, well-scoped use case (e.g., gearbox vibration prediction, visual defect detection of critical surfaces).
Assess data readiness: sensor density, historical logs, labeling effort required.
Run a short pilot (6–12 weeks) with clear success metrics: precision/recall for detection models, % downtime reduction for maintenance pilots.
Plan model lifecycle: retraining cadence, monitoring for drift, and integration with maintenance or MES systems.
Implementation caveats: ML success depends on data quality and representative labeling; latency-sensitive use cases often require edge ML, while broader analytics and retraining workflows fit cloud platforms. For organizations that need an ML readiness assessment or help designing pilots, consider evaluating partner services that combine data engineering, domain expertise, and deployment experience.
Smart Manufacturing Factories: Improving Efficiency and Flexibility
Operational excellence today depends on integrating digital technologies that boost productivity while preserving the flexibility to respond to changing demand. Smart manufacturing systems deliver measurable improvements across throughput, workforce productivity, and capacity utilization when deployed with clear objectives and governance.
Industry reports and case studies consistently document gains after successful pilots and rollouts. Typical improvement ranges observed across multiple implementations include:
Production output: units produced per shift or hourly throughput compared to baseline.
Employee productivity: output per labor hour, factoring out product mix changes.
Unlocked capacity: percent increase in available capacity without additional capital equipment.
“Nearly half of industry leaders prioritize operational benefits as their primary value driver when implementing advanced production technologies.”
Smart factories achieve reduced error rates through predictive maintenance, automated quality inspection, and closed-loop setpoint management. For example, combining machine vision with analytics often reduces escape rate of defects and decreases rework costs. Cost reductions also come from demand-driven procurement that lowers inventory carrying costs and shorter cycle times that reduce work-in-progress.
Before / After: A Mini Case
In a mixed-model assembly line pilot, a manufacturer combined targeted sensorization and a lightweight analytics dashboard. Within six months they reported a 12% increase in hourly throughput and a 15% reduction in rework—improvements driven by faster anomaly detection and quicker operator response.
Buyer Checklist: Pilot to Scale
Define clear success metrics (throughput, defect rate, ROI timeframe).
Scope a narrow pilot with measurable KPIs and a defined timeline (3–6 months).
Ensure data collection and quality before modeling or ML work begins.
Plan integration points with MES/ERP and maintenance systems.
Prepare an upskilling roadmap for operators and maintenance teams.
Workforce impact: automation removes repetitive tasks and shifts employees toward system operation, quality oversight, and continuous improvement. Upskilling programs should include hands-on training in HMI operation, basic troubleshooting, and data-driven decision-making.
For organizations seeking implementation support, a partner with both manufacturing domain expertise and systems integration capabilities can help design pilots, measure impact, and scale successful projects. See the section later in this guide, “How Iottive Pvt. Ltd. Supports End-to-End IoT Productization,” for an example of a partner-led approach to piloting and scaling smart manufacturing solutions.
Leveraging Data Analytics for Informed Decision Making
The strategic value of operational data has made analytics a top investment area for many manufacturers. Research indicates a growing share of companies prioritize analytics within near-term planning cycles as they recognize that connected systems generate high-velocity data streams that require advanced interpretation to deliver business value.
Without an analytics capability, large volumes of sensor and process data remain underused; with analytics, organizations convert raw telemetry into prescriptive actions that improve uptime, product quality, and supply responsiveness.
Real-Time Data Integration and Analysis
Modern data platforms ingest operational information from equipment sensors, vision systems, quality monitors, and material handling devices into unified repositories. A recommended ingestion architecture includes edge buffering and preprocessing, streaming pipelines (e.g., Kafka), time-series databases for telemetry, and cloud storage for historical analysis and model training.
Advanced analysis applies statistical methods, rule-based engines, and machine learning to detect anomalies, predict failures, and identify process optimization opportunities. These capabilities enable predictive maintenance and faster quality issue resolution by surfacing insights to operators and triggering automated workflows.
Typical analytics maturity steps for manufacturers:
Collect: instrument the right sensors and ensure reliable data capture at the edge.
Clean: establish data quality rules, standardize timestamps, and normalize units.
Analyze: apply dashboards, statistical monitoring, and ML models to detect patterns.
Operationalize: integrate insights into MES/ERP, create alerts, and automate corrective actions.
Suggested KPIs and dashboards:
Operator view: real-time alarms, asset health score, current throughput, immediate corrective steps.
Supervisor view: shift performance, defect rates by line, mean time to detect.
Define ownership for data sources, retention policies, and data quality SLAs before scaling analytics. Address compliance (local data laws) and cybersecurity controls for telemetry and cloud storage. Choose edge vs. cloud processing based on latency, bandwidth, and cost—edge for millisecond responses, cloud for heavy model training and cross-site correlation.
Micro-case idea: a pilot that layered an anomaly-detection model on top of vibration telemetry reduced average time-to-detect bearing issues from days to hours, allowing scheduled maintenance and preventing line stoppages. Track success with concrete metrics such as mean time to detect, false-positive rate, and % reduction in downtime.
For manufacturers seeking a practical analytics roadmap or a partner to run a pilot, consider vendors and systems integrators with combined experience in industrial data ingestion, cloud computing, and applied analytics solutions.
Addressing Challenges and Ensuring Cybersecurity in Manufacturing
Digital transformation delivers major benefits, but manufacturers must navigate significant challenges to realize them safely. Operational risks — including business disruption from system failures or cyber incidents — top the list of concerns for many organizations, so risk-aware planning is essential before scaling IIoT projects.
Survey figures cited throughout the industry highlight these worries; when using such statistics in the final article, cite the original source and date to provide context for regional or sector differences.
Risk Management and Compliance in Digital Environments
In highly connected factories, cybersecurity and risk management are central to maintaining continuous operations and protecting intellectual property. Increased connectivity increases the attack surface across OT and IT environments, so manufacturers must adopt a defense-in-depth posture.
Practical cybersecurity checklist for manufacturers:
Network segmentation and OT/IT isolation to limit lateral movement.
Strong identity and access management (least privilege, MFA for critical systems).
Encrypted communications for telemetry and remote access.
Regular patching and coordinated vulnerability management for both IT and OT assets.
Endpoint detection, monitoring, and anomaly detection tuned for industrial protocols.
Incident response plan and table-top exercises that include operations and engineering teams.
Recommended compliance frameworks and standards to reference: NIST Cybersecurity Framework, IEC 62443 for industrial control systems, and ISO 27001 for information security management. Start with a gap analysis against one of these standards, then prioritize mitigations that reduce operational risk quickly.
Workforce issues are another major barrier to Industry 4.0 adoption. Manufacturers often lack personnel with combined skills in OT, IT, data analytics, and process engineering. Addressing this requires a structured upskilling program and partnerships that extend internal capabilities.
Practical action plan for workforce readiness:
Map job families and identify new roles (data engineer, edge compute technician, ML ops for manufacturing).
Create reskilling pathways with short courses, on-the-job training, and vendor-led workshops.
Establish apprenticeship or rotation programs so operations staff gain exposure to analytics and automation systems.
Measure progress with KPIs: % of staff trained, reduction in mean time to resolve incidents, and time-to-competency for new roles.
Common pitfalls and mitigations:
Ignoring OT constraints: involve plant engineers early to avoid unrealistic IT-led changes.
Over-centralizing data without edge capabilities: use edge preprocessing for latency-sensitive controls.
Underestimating integration effort: budget time for MES/ERP/Maintenance system integration and validation.
Effective risk management goes beyond technology to include supply chain resilience, vendor risk assessments, and contractual safeguards that ensure continuity. For manufacturers without in-house security or analytics expertise, working with experienced systems integrators or managed security providers that understand industrial contexts is a pragmatic path forward.
How Iottive Pvt. Ltd. Supports End-to-End IoT Productization
Iottive Pvt. Ltd. is an end-to-end IoT product engineering company that helps manufacturers and product companies take IoT concepts from idea to market-ready product. Their multidisciplinary teams combine product strategy, hardware engineering, firmware, cloud and edge software, mobile/web apps, testing, and commercialization support to deliver accountable, production-grade solutions.
Services Offered
Product ideation & UX: user research, requirement definition, feature prioritization, and prototyping to validate market fit and use cases.
Electronics & PCB design: schematic capture, multi-layer PCB layout, component selection, BOM optimization, and DFx reviews to prepare designs for manufacturability.
Enclosure & mechanical design: industrial design, CAD, thermal and EMC considerations, and tolerance analysis for robust factory-grade products.
Firmware & embedded software: real-time firmware, bootloaders, OTA update frameworks, secure device identity, and edge inferencing support.
Mobile and web app development: operator HMIs, mobile supervision apps, and web dashboards with role-based access for operators, supervisors, and executives.
Cloud & edge platform integration: secure telemetry pipelines, time-series storage, model training and deployment, and integration with MES/ERP systems.
QA, validation & regulatory testing: environmental, EMC, safety testing plans, and support for certifications such as FCC/CE/UL where applicable.
Pilot deployments & small-batch manufacturing: pilot site installs, production validation test plans (PVT), test-jig design, and coordination with contract manufacturers.
Commercialization & supply-chain support: manufacturing partner selection, vendor onboarding, production BOM finalization, logistics planning, and handoff to scaled manufacturing.
Typical Engagement Workflow
A representative engagement follows a phased workflow designed to de-risk product development and accelerate time-to-market:
Discovery & feasibility: technical and business assessment, user journeys, and success metrics definition.
Prototype & alpha: rapid hardware prototypes (functional boards and enclosures), initial firmware, and a minimum viable cloud/backend plus operator app for validation.
Pilot & integration: deploy pilot units at one or more sites, collect operational data, refine edge/cloud analytics and digital twin models, and complete safety/EMC testing.
Certification & small-batch production: finalize BOM and gerbers, perform DFM/DFX reviews, execute certification testing, and produce a controlled small batch for field validation.
Scale & commercialization: establish contract manufacturing relationships, implement production test plans, support logistics and supply-chain onboarding, and provide maintenance and feature roadmaps.
Key handoffs emphasized during the workflow include BOM optimization and cost-down reviews, DFM/DFX documentation, production test-jig and validation plans, and release artifacts such as firmware images, signed binaries, and cloud deployment manifests.
Typical Deliverables
Functional prototype units and test reports
Production-ready schematics, PCB gerbers, and a finalized BOM
Production validation test plan (PVT) and test-jig designs
Stable firmware images and OTA update package
Mobile/web applications and operator dashboards
Cloud integration scripts, data schemas, and analytics dashboards
Certification support documentation and test certificates
The Iottive team structure typically combines hardware engineers, embedded/firmware developers, cloud engineers, data scientists, mobile/web developers, QA/test engineers, and product managers—delivering end-to-end accountability across product, systems, and operations.
Contact Iottive for a free IoT product feasibility review and pilot scoping session to assess readiness, estimated budget, and an initial timeline for a minimum viable deployment.
Conclusion
The consensus among industry leaders is unmistakable: digital transformation represents the definitive path forward for modern production. With 92% of companies recognizing this approach as essential for competitiveness, investment patterns confirm this strategic direction.
The comprehensive benefits span operational efficiency, supply chain resilience, and enhanced product quality. Industry 5.0 frameworks emphasize human-technology collaboration, where advanced systems handle data-intensive tasks while workers focus on creative problem-solving.
This evolution positions forward-thinking companies to thrive in tomorrow’s technology-driven landscape. The integration of intelligent technologies creates sustainable advantages that redefine competitive standards across the industry.
Frequently Asked Questions
What are the primary benefits of implementing IoT in a production facility?
The primary benefits include enhanced operational efficiency, superior product quality, and significant cost savings. IoT enables real-time monitoring of equipment and processes, leading to data-driven decisions that boost overall productivity and resource utilization.
How does machine learning contribute to maintenance strategies?
Machine learning algorithms analyze historical and real-time data from sensors to predict equipment failures before they occur. This predictive maintenance approach minimizes unplanned downtime, extends asset life, and reduces repair costs.
What role do digital twins play in modern industrial operations?
Digital twins create virtual replicas of physical systems, processes, or products. They allow for simulation, analysis, and control, enabling operators to test scenarios, optimize performance, and identify potential issues without disrupting the actual production line.
Why is cybersecurity a critical concern for connected factories?
As facilities become more interconnected through the Industrial Internet of Things (IIoT), they become larger targets for cyber threats. A robust cybersecurity framework is essential to protect sensitive data, ensure operational continuity, and safeguard intellectual property from attacks.
How does data analytics improve supply chain management?
Advanced analytics provide deep insights into supply chain dynamics, from raw material sourcing to final delivery. This visibility helps manufacturers anticipate disruptions, optimize inventory levels, improve logistics, and enhance responsiveness to market changes.
What is the impact of automation on the manufacturing workforce?
Automation transforms the workforce by handling repetitive, manual tasks. This shift allows human workers to focus on more complex, value-added activities like system management, problem-solving, and innovation, necessitating ongoing upskilling and training programs.
How do I choose a partner for IoT product development?
Choose a partner with proven manufacturing domain expertise, full-stack engineering capabilities (hardware, firmware, cloud, apps), strong cybersecurity practices, references or case studies, and established relationships with contract manufacturers and testing labs. Look for clear project governance, transparent cost estimates, and a plan for pilot-to-scale transition.
One evening in Los Angeles, a driver spent 20 minutes circling a single block. That extra time burned fuel
and frayed nerves, mirroring a citywide pattern where cruising makes up about 30% of urban traffic.
Modern smart parking systems use sensors, gateways, cloud platforms, and an app to turn live data
into spot availability and short routes. This cuts search time for drivers and trims congestion.
The result is both environmental and economic: less cruising means lower emissions and better use of existing
space. Cities can pilot small networks, scale to citywide coverage, and rely on partners like Iottive for BLE apps, cloud integration, and end-to-end solutions.
Key Takeaways
Real-time guidance from sensors and apps reduces search time for drivers.
Better availability data lowers traffic and cuts fuel use and emissions.
Scalable systems let cities grow from pilots to full deployments.
Dynamic pricing and demand forecasting improve space utilization.
Expert vendors provide integration across devices, cloud, and user interfaces.
The present-day parking challenge in U.S. cities and why it matters now
Cruising for a space now drives measurable congestion, higher emissions, and frustration for city
drivers.
Studies show roughly 30% of urban traffic comes from drivers searching for parking. In one Los Angeles business
district, cruising equaled 38 trips around the globe, burned 47,000 gallons of gasoline, and released 730 tons of
CO2 in a year.
The daily effects are clear. Drivers face longer time spent circling blocks, added stress, and unpredictable trip
times. That frays the user experience and can reduce foot traffic for local businesses.
Traffic and fuel waste: searching parking increases congestion and emissions across metro areas.
City operations: enforcement and revenue collection strain under uneven curb use.
Supply pressure: rising urban populations mean fixed space cannot keep up without better management.
Legacy systems lack live data and transparency. This creates pockets of empty stalls while other blocks
stay full. Modern data-driven systems and digital solutions are now essential to balance demand and guide drivers
quickly to open space.
Issue
Legacy systems
Data-driven outcome
Visibility
No real-time availability
Live spot status reduces search time
Enforcement & revenue
Manual checks, delays
Automated reports, fair billing
Space utilization
Uneven use, hotspots
Balanced occupancy across areas
What a smart parking system is and how AIoT makes it work
A modern system turns sensors, networks, and cloud logic into an on-demand guide for drivers.
In short:smart parking systems are AIoT platforms that link on-spot detectors, gateways,
cloud analytics, and a user-facing app to show live availability and simplify the journey.
From sensors to smartphones: the end-to-end loop
Sensors and cameras detect occupancy at the curb or lot. Gateways then relay those signals over LoRaWAN, NB‑IoT, or
Wi‑Fi to central cloud services.
Cloud engines fuse raw data, run pattern recognition, and produce real-time availability and short-term forecasts.
The mobile app and web portal present routes, pricing, reservations, and payments in one flow.
Accuracy: AI fuses multiple signals to spot anomalies and raise trust in availability.
Edge filtering: Local devices aggregate messages to cut latency and lessen cloud load.
Reservations & payments: Users can book a spot, navigate to it, and complete checkout
without leaving the app.
Modular rollout: Cities can pilot small zones, reuse legacy meters, and scale coverage as
demand grows.
Operations teams get dashboards that track KPIs and live status. That same architecture supports
reporting and optimization so operators can tune pricing, enforcement, and space use with real-time data.
AI & IoT smart parking architecture that scales for cities
A layered architecture ties user interfaces, edge devices, and back-end services into a single, scalable
city platform.
User-facing layers: mobile app and web portal
The user layer presents live availability, reservations, pricing, and account tools via a mobile app and web
portal. It guides drivers to an open space, handles payments, and offers operator dashboards for management.
Cloud platforms for real-time processing and storage
Cloud services ingest telemetry, store time-series data, and run ML models for short-term forecasts and alerts.
APIs expose those results so cities and vendors can build further solutions and integrate with transit systems.
Gateways and edge intelligence to reduce latency
Gateways filter messages, normalize payloads, and queue telemetry when backhaul is intermittent. Local edge logic
lowers round-trip time and reduces cloud load, while MQTT is used for efficient publish/subscribe messaging.
On-spot sensors and lot infrastructure
Stall-level sensors, cameras, barriers, signage, and power systems enable real-time operations at scale. Device
twins and autoscaling cloud resources support multi-site deployments, tenant isolation, and the security practices
cities require.
Core IoT sensors that detect vehicle presence accurately
Picking the correct detector mix is the first step to reliable vehicle occupancy data. Different
sensors suit curbside lanes, garages, and open lots. Choice depends on accuracy needs, weather, and installation
cost.
Magnetic, ultrasonic, infrared, radar, and inductive loops
Common field devices include ground-embedded magnetic probes, overhead ultrasonic units, infrared detectors, radar
modules, and inductive loops. Each modality senses a different physical change to detect vehicle presence.
Magnetic: senses disturbances in the earth’s magnetic field from a metal mass. Good for
curbside stalls and low power needs.
Ultrasonic: measures acoustic reflections from a vehicle under a canopy or ceiling. Works well
indoors but needs clear mounting.
Infrared: detects heat signatures and works for short-range occupancy checks in controlled
lighting.
Radar: uses radio wave reflections and performs robustly in harsh weather and varied lighting.
Inductive loops: count vehicles by measuring changes in inductance at the pavement. High
accuracy but invasive to install.
Computer vision and occupancy detection cameras
Video with computer vision adds licence-plate capture, lane analytics, and multi-space sensing from a
single device. Modern models tackle occlusion and low-light scenes to estimate which parking spaces are occupied.
Blending sensors and vision improves resilience. Vision fills gaps in sensor fields, while spot
sensors reduce false positives during weather or interference.
Sensor Type
Strengths
Trade-offs
Magnetic
Low power, low cost, good curb accuracy
Limited range, ground work for install
Ultrasonic
Ceiling-mounted for garage stalls, non-invasive
Sensitive to mounting, affected by noise
Infrared
Simple heat-based detection, compact
Less reliable in variable temperatures
Radar
All-weather, long range, robust
Higher cost, potential interference
Inductive loop
Very accurate per-stall detection
Pavement cuts, higher installation effort
Computer vision
Multi-space coverage, ALPR, analytics
Privacy concerns, bandwidth and compute needs
Calibration, routine health checks, and remote diagnostics keep data accurate over time. Operators should weigh
installation complexity, power draw, and network needs when selecting sensors for garages versus curbside
environments.
Data flow, protocols, and real-time updates that drivers can trust
Reliable data flow is the backbone that turns raw sensor events into timely guidance for drivers.
From LoRaWAN, NB‑IoT, or Wi‑Fi to MQTT and cloud ingestion
Sensors publish occupancy events over LPWAN or Wi‑Fi to local gateways. Gateways forward telemetry to cloud
services using MQTT or HTTPS for low-latency delivery.
Turning raw signals into dependable availability
Cloud pipelines run de-duplication, filtering, and aggregation to convert noisy inputs into a single availability
state per stall.
Confidence scoring fuses sensor and camera signals to reduce false positives and false negatives.
Edge inference reduces round-trip time for guidance when drivers approach a destination.
Defined SLAs for data freshness keep updates within seconds for high-demand zones.
Observability—metrics, traces, and dashboards—verifies correctness and aids troubleshooting.
Standardized APIs enable integration with navigation providers, enforcement platforms, and city data hubs.
Stage
Function
Outcome
Device
Detect occupancy events
Low-power, local signals
Gateway
Normalize and forward
Resilient telemetry delivery
Cloud
Clean, fuse, score
Reliable availability for user displays
Edge
Inference and caching
Lower latency for guidance
Connected parking analytics: using AI to optimize space and time
Data-driven models convert historical patterns and live feeds into forecasts that guide daily
operations and long-term planning.
Predictive availability forecasts stall occupancy so operators can align staffing, enforcement, and
signage. Drivers gain better confidence about arriving times and likely availability.
Predictive availability and demand forecasting
Machine learning blends time-series and live telemetry to forecast short-term demand by block and hour. That
forecast helps cities reduce cruising and improve space utilization.
Dynamic pricing aligned with live demand patterns
Price signals respond to occupancy to smooth peaks and boost turnover. Dynamic rates increase revenue stability
while keeping access fair near key destinations.
Traffic flow analysis and heatmaps for planning
Ingress/egress counts and curb activity produce heatmaps that reveal hotspots and time-of-day trends. Planners use
these visuals to reallocate curb rules and coordinate with broader traffic flow systems.
Definition: application of ML to reveal patterns, forecast occupancy, and optimize space
utilization.
Outcomes: less time searching, lower emissions, and steadier revenue for operators.
AI mobility apps that elevate the driver experience
When discovery, booking, and checkout live in one place, drivers spend less time circling and more time
arriving.
Modern AI mobility apps consolidate discovery, reservations, navigation to parking spots, and
contactless payments into one cohesive flow. Real-time availability detection feeds the map so the user can reserve
a slot and head straight to it with turn-by-turn guidance via Google Maps or Mapbox.
Reservations, navigation, and contactless payments
Secure payment flows support stored methods and fast checkout. Many solutions use Stripe or PayPal for tokenized
cards and digital receipts.
Reserve a slot in seconds and store multi-vehicle profiles for quick selection.
Navigation hands off to maps for precise routing and ETA updates.
Voice search and accessibility options speed discovery in multi-level facilities.
ALPR for seamless entry and ticketless operations
License plate recognition enables automatic gate opens and ticketless billing. Plate recognition
reduces queues at entry and exit and ties sessions to a user account for smooth invoicing.
Predictive guidance suggests arrival windows or nearby alternatives when availability looks tight. Push
notifications and trip history keep the driver informed and in control.
smart parking IoT, AI mobility apps, connected parking analytics
A three-part system links field sensors, a user-facing app, and real-time models to cut cruising and
improve curb use.
The first layer captures ground truth occupancy with on-stall detectors and cameras. This field telemetry gives
operators accurate, second-by-second data for each stall.
The second layer delivers that availability to drivers through a convenient app. Users get turn-by-turn guidance,
reservations, and live status so they arrive with confidence.
The third layer runs models that turn behavior and history into policy. Forecasting and dynamic pricing adjust
rates, curb rules, and signage to match demand.
Feedback loops keep the triad adaptive: user choices feed models, the models update guidance, and
the system tunes supply-side levers like time limits or rates.
Function
Input
Outcome
Sensing
Stall telemetry
Accurate occupancy
User layer
Real-time availability
Faster arrivals, less cruising
Analytics
Behavior + history
Dynamic pricing, better turnover
Platform interoperability matters. Sharing anonymized feeds with transit, micromobility, and venues supports
coordinated demand management.
KPIs to track include reduced cruising time, higher turnover per stall, revenue per space, and
user satisfaction. Robust privacy, security, and governance keep public trust as deployments scale.
Operational benefits for municipalities, operators, and drivers
Real-time visibility turns scattered curbside activity into clear operational choices for cities and
vendors.
City teams gain centralized dashboards that show occupancy, revenue, and alerts in one view. This improves response
time and helps prioritize maintenance or enforcement without guesswork.
Reduced congestion, fuel use, and emissions
Lower cruising cuts emissions: deployments in busy corridors have shown up to a 40% drop in
vehicle emissions by reducing search time.
Fewer vehicles circling means less fuel burned and lower traffic congestion, supporting municipal climate goals.
Higher space utilization and better parking operations
Higher turnover raises effective capacity so cities get more use from existing assets without new construction.
Better space utilization and targeted pricing increase revenue and save capital and time on expansion projects.
Stronger security and enforcement with real-time alerts
Automated compliance, ALPR, and rule-driven alerts reduce unauthorized use and speed violation handling.
Operators and enforcement teams work from the same evidence, making enforcement fairer and less intrusive for the
user.
Implementation hurdles and how to address them
A clear rollout plan can turn resistance into momentum for citywide deployments. Start with
governance that names roles across departments, operators, and the public. Publish transparent KPIs and a phased
timeline to build trust.
Organizational readiness, cost, and stakeholder buy-in
Mitigate budget concerns with a pilot-to-scale financing model. Use SaaS pricing, hardware leasing, and measured
pilots that show benefits in reduced search time and lower traffic.
Data privacy, correctness, and standard tool availability
Privacy-by-design limits collection, anonymizes records, and enforces retention rules. Maintain
correctness with sensor fusion, routine calibration, and continuous validation so users trust live availability.
Bridging legacy systems and talent gaps
Integrate meters, gates, and back offices via APIs and adapters to avoid rip-and-replace. Close talent gaps through
vendor partnerships and training programs that upskill staff in cloud and edge management.
Practical checklist:
Governance, KPIs, and phased rollout plans.
Pilot financing and cost-to-benefit tracking.
Data minimization, compliance controls, and validation routines.
API-led integration and workforce development partnerships.
Business models and revenue levers for smart parking solutions
Monetization mixes subscriptions, device sales, and per-use charges to fund deployments.
Recurring SaaS revenue typically comes from tiered subscriptions for operations dashboards, API access,
and data analytics. Fees scale with deployment size and feature sets, giving predictable income for operators and
cities.
Hardware sales add upfront revenue. Sensors, gateways, meters, and access controllers sell with optional warranties
and maintenance packages to extend lifetime value.
Transaction fees and premium user features drive per-use income. Operators can charge a small percentage on digital
payments, offer fleet accounts, or sell subscriptions for priority access in an app.
Additional levers include dynamic pricing to match demand, short-term space rentals, premium services like EV
charging and valet, and revenue from digital signage and geotargeted advertising.
Revenue Lever
Model
Typical Outcome
SaaS subscriptions
Tiered access, APIs, dashboards
Recurring predictable ARR
Hardware & services
Device sales, install, maintenance
Upfront cash + service margins
Transactions & premium
Payment fees, fleet plans, VIP passes
Variable, scales with usage
Data & reporting
Custom reports, forecasting
High-margin enterprise contracts
Demand levers
Dynamic pricing, rentals, ads
Higher yield per parking space
Integrating with smart city infrastructure and mobility systems
When curb availability feeds traffic centers in real time, signal timing can adapt to reduce congestion. This link
turns stall-level status into actionable control across urban systems.
Data sharing across traffic, public transit, and urban planning
Traffic management platforms ingest stall and garage feeds to avoid spillback and smooth traffic flow. Coordinated
signals and dynamic lane controls keep entry points clear and reduce queuing.
Transit partners receive availability feeds so their app can suggest park-and-ride options when downtown supply is
low. That improves multimodal choices and lowers single-occupant trips.
Planners use longitudinal data to refine curb rules, set price schedules, and allocate accessible space for equity
goals. Heatmaps and KPIs help evaluate policy outcomes over months and years.
Event and interoperability benefits
Pre-stage guidance and surge pricing around venues to smooth arrivals and departures.
Open standards and APIs prevent vendor lock-in and enable city-wide solutions to interoperate.
From MVP to full rollout: a practical development roadmap
Begin pilots with a narrow zone and a tight scope to prove value quickly. Start by validating core
features that matter most to drivers and operators: live availability, reservations, and secure payments. Use a
single lot or a short curb corridor to collect real-world data and KPIs.
Defining scope, UX, and core features for a pilot
Define clear KPIs—reduce time to find parking, increase adoption, and meet accuracy targets.
Design the user flow so discovery and booking take seconds. Test a lightweight mobile app with real users and
iterate on UI based on session metrics and surveys.
AI model integration, payments, and security hardening
Choose detection models like YOLO or MobileNet for stall-level inference and forecasting. Host
model training and deployment on AWS, Azure, or GCP and monitor drift with MLOps tools.
Integrate mapping (Google Maps or Mapbox) and payments (Stripe or PayPal). Enforce PCI compliance, use OAuth 2.0
and JWT for identity, and apply data minimization across the lifecycle.
Scaling, monitoring, and continuous improvement
Move from pilot to production using containerization (Docker) and orchestration (Kubernetes). Implement CI/CD
pipelines for safe releases and automated tests.
Set up observability, SLOs, and incident response. Use analytics to collect feedback and run iterative releases
that improve accuracy, uptime, and user satisfaction.
Feature set and tech stack to build a future-ready parking platform
A clear feature plan and a modular stack let cities deliver reliable curb services today and scale
tomorrow.
Must-have features include real-time availability, stall-level occupancy detection, reservations,
contactless payments, and ALPR for ticketless entry. Add account management, billing, and robust reporting so
operators can do day-to-day management with confidence.
Advanced capabilities lift the user experience: AR indoor guidance for garages, conversational
chatbots for support, ML demand forecasting, and anomaly detection to catch fraud or sensor drift. Include computer
vision where wide-area sensing or plate recognition adds value.
Recommended modular stack
Layer
Examples
Notes
Client
React Native, Flutter, Swift, Kotlin
mobile app + web UI
Backend
Django / Node.js, PostgreSQL, MongoDB
API-first, multi-tenant
ML & Edge
TensorFlow, PyTorch, MQTT, edge Python
computer vision, forecasting
Cloud & DevOps
AWS/Azure/GCP, Docker, Kubernetes, Jenkins
scalable, observable
Security &ops demand OAuth/JWT, SSL, cert management, encrypted OTA updates, and PCI-compliant
payment flows (Stripe/PayPal). Test performance under event surges and multi-lot scale to ensure uptime and smooth
user experience.
About Iottive: your partner for end-to-end IoT, AIoT, and mobile parking solutions
Iottive’s engineering teams focus on secure, scalable platforms that
fuse device telemetry with clear user flows. The company builds BLE-enabled mobile solutions, cloud
integration, and custom hardware to help cities and operators manage curb and lot space more effectively.
Expertise in BLE app development and cloud integration
Iottive delivers rapid prototypes and MVPs that reduce
risk and speed time-to-value. Their teams craft BLE app experiences, APIs, and back-end services that turn sensor
signals into actionable status for drivers and operators.
A focused deployment that ties sensors to user guidance can quickly prove value for drivers and operators
alike. AIoT-powered smart parking aligns real-time sensing, routing, and forecasting to cut
cruising, lower emissions, and save time.
Across stakeholders the benefits are clear: less time to find a spot for drivers, higher utilization and revenue
for operators, and reduced congestion for cities. Durable impact requires scalable systems,
privacy-by-design, and integration with broader city infrastructure.
Start with a narrow MVP, measure KPIs, and iterate using live data and user feedback. For end-to-end support—from
sensors to mobile and cloud—engage expert partners like Iottive: www.iottive.com
| sales@iottive.com. They help cities deliver robust solutions that reclaim curb space and improve daily life.
FAQ
What problems do modern cities face with on‑street parking and why act now?
Urban areas in the U.S. face rising vehicle counts, limited curb space, and unpredictable demand. These issues increase search time, congestion, emissions, and lost revenue for cities. Deploying availability detection and real‑time guidance reduces cruising time and improves curb management, making traffic flow smoother and streets safer.
How does an end-to-end system detect and show available spaces to drivers?
Sensors at the curb or in lots detect vehicle presence and send signals via low‑power networks or Wi‑Fi to gateways. Edge processing filters data, then cloud services aggregate and publish availability to mobile and web interfaces. The loop closes when navigation or reservation features direct drivers to the confirmed spot.
Which on‑spot detection technologies are most reliable for occupancy sensing?
Inductive loops, magnetic sensors, ultrasound, and radar provide robust presence detection in many settings. Camera‑based computer vision adds plate recognition and lane‑level accuracy. Choosing the right mix depends on installation cost, lighting, weather, and desired features like ALPR.
What communication protocols keep real‑time updates dependable?
Networks such as LoRaWAN and NB‑IoT offer long range and low power for sensors, while Wi‑Fi and LTE support higher throughput. MQTT and HTTPS move telemetry to cloud platforms, where APIs feed apps with low latency and high availability for drivers and operators.
How do analytics and machine learning improve space utilization?
Historical occupancy and transaction data let models predict peak demand, forecast availability windows, and suggest dynamic pricing. Heatmaps and flow analysis reveal bottlenecks so cities can reallocate curb space, adjust signage, and optimize enforcement for better utilization.
What user features should a driver expect from a modern mobility app?
Core features include live availability maps, turn‑by‑turn navigation to reserved or nearest space, contactless payment, and booking. Advanced functions add estimated time to spot, expansion of AR guidance, and automated entry/exit via license plate recognition for ticketless operation.
How does license plate recognition (ALPR) enhance operations?
ALPR automates entry, exit, and payment reconciliation, reducing queuing and manual checks. It supports permit checks, enforcement alerts, and event management. Proper privacy controls and secure storage are essential when using plate data.
What operational benefits do cities and operators gain after rollout?
Benefits include reduced congestion and emissions, higher turnover and revenue from better utilization, faster enforcement with real‑time alerts, and improved traveler satisfaction. Data also supports long‑term planning and coordination with transit and traffic systems.
What common implementation hurdles should be expected and how can they be mitigated?
Challenges include upfront hardware cost, stakeholder alignment, integration with legacy systems, and data governance. Start with a focused pilot, define clear KPIs, choose interoperable standards, and set privacy policies to build trust and measure value before scaling.
Which business models make deployments financially viable?
Typical models combine SaaS subscriptions for software, hardware sales or leases, transaction fees for payments, and premium services like analytics. Dynamic pricing, reserved spaces, and advertising also create recurring revenue streams for operators and municipalities.
How do you ensure data privacy and accuracy in these systems?
Implement encryption in transit and at rest, role‑based access, and data retention limits. Validate sensor feeds with cross‑checks—camera verification or loop sensors—to reduce false positives. Regular audits and transparent privacy notices help maintain compliance and public trust.
How do these systems integrate with broader city mobility and traffic platforms?
Use open APIs and standardized data formats to share availability, demand forecasts, and curb usage with transit agencies and traffic management centers. Shared datasets enable coordinated signal timing, multimodal routing, and smarter curb allocation across agencies.
What roadmap steps deliver a successful pilot to full city rollout?
Start by defining scope, user experience, and KPIs for a small area. Deploy sensors and a minimal app with reservation and payment. Integrate edge filtering and cloud analytics, then iterate on ML models and security. Scale by expanding geographies, adding features, and automating operations.
What core features and tech stack are recommended for a future‑ready platform?
Must‑have features include real‑time availability, reservations, and payments. Recommended stack: resilient sensors, edge gateways for preprocessing, cloud platforms for storage and ML, MQTT/REST APIs, and mobile/web front ends. Add monitoring, DevOps, and fraud detection for reliability and security.
Which industries and use cases benefit from this technology beyond municipal curb management?
Commercial operators, airports, hospitals, retail centers, and campuses gain from reduced search time, better revenue capture, and improved user experience. Industries like automotive and logistics use these systems for fleet routing and loading zone management.
Who can enterprises contact for end‑to‑end product and integration services?
Look for firms with experience in BLE apps, cloud/mobile integration, hardware design, and custom deployments. Check vendor portfolios for cross‑industry projects in healthcare, automotive, and industrial IoT, and request references to verify delivery and support.
On a humid morning in Boston, a coach handed a novice a pair of smart shoes and a phone app. The
runner laughed at first, then paused at the first report. Within a mile, stride gaps and pressure points showed up
as clear, usable analysis.
That small moment shows how modern shoes translate each step into meaningful data. Embedded sensors like accelerometers, gyroscopes, and pressure arrays feed
lightweight Bluetooth LE links. The result is fast syncing and long battery life.
Today’s category bridges performance needs and health use cases. From gait deviation detection to rehab tracking,
the tech helps athletes and patients alike. This section previews product features, buyer criteria such as battery
life and app quality, and market trends.
Iottive brings expertise in BLE app development and cloud
integration for device makers. For product integrations and custom platforms, visit www.iottive.com or email sales@iottive.com.
Key Takeaways
Embedded sensors turn steps into actionable analysis for users.
Bluetooth LE enables efficient, real-time syncing with apps.
Design choices—battery, comfort, and app UX—drive buyer value.
Use cases span performance coaching to medical monitoring.
Look for solutions that balance specs with everyday usability.
Why Smart Running Footwear Matters Now
Advances in sensor accuracy have turned everyday footwear into a real-time movement lab.
Modern shoes capture subtle motion and pressure signals that help runners improve efficiency and
cut injury risk.
Smartphone ubiquity makes setup and syncing simple. That means more users get immediate cadence cues, pace nudges,
and form alerts while they train.
Behind the scenes, better sensors and refined algorithms translate raw signals into clear analysis. Runners see actionable tips mid-run or a concise report after finishing.
The same data foundation supports practical health features: temperature or pressure warnings can flag a developing
sore or ulcer early.
Today’s value is in usable insights, not generic step counts. Reliable Bluetooth links, accurate timing, and
contextual feedback separate helpful products from gimmicks.
Iottive builds Bluetooth-enabled app and cloud pipelines that lift the UX of this technology
without compromising comfort or durability.
Actionable in-ride guidance and post-run reports
Health alerts layered on performance tracking
Reliability and fit remain non-negotiable
IoT Smart Shoes Buyer’s Guide: Features That Provide Real-Time Value
Choosing the right feature set starts with understanding which sensors deliver real-time benefits
you’ll actually use. Focus on what improves gait insight, comfort, and timely feedback.
Must-have sensors: Pressure arrays map contact timing and load distribution. IMUs (accelerometers
and gyros) track motion, cadence, and stride length. Temperature sensors flag hot spots that may indicate
inflammation or ulcer risk.
Sensor fusion blends these inputs to improve gait monitoring. Fusion reveals pronation patterns, ground contact
time, and subtle asymmetries that single signals miss.
Connectivity vs. battery: Bluetooth LE gives low power and steady mobile syncing. Wi‑Fi offers
more bandwidth but drains batteries faster and complicates pairing.
Battery trade-offs: Duty cycle, sampling rate, and on-shoe processing drive autonomy. Local
processing extends life versus continuous streaming.
Comfort and durability: Look for robust insole layers, encapsulated electronics, and flexible
interconnects that preserve comfort.
Feature
Benefit
Trade-off
When to pick
Pressure arrays
Contact timing & load maps
Added cost, placement sensitivity
Injury prevention, gait monitoring
IMU (accel + gyro)
Motion, cadence, stride data
Sampling affects battery
Form coaching, cadence feedback
Temperature sensor
Localized inflammation cues
Requires calibration, privacy rules
Health monitoring, diabetic care
Bluetooth LE vs Wi‑Fi
Mobile pairing vs bandwidth
Power vs data rate
Daily use vs high-data labs
Test onboarding, pairing, and firmware updates. Check privacy settings for health features. Iottive’s BLE app
development and cloud integration expertise helps brands balance connectivity, battery autonomy, and user experience
to maximize long-term value.
Product Roundup: Best IoT Smart Shoes for Running Performance
A hands-on product roundup helps buyers match sensor depth to training goals and budget.
Top picks span clinical platforms like Pedar and F-Scan to wearable systems such as Moticon
OpenGo. Pedar and F-Scan offer dense pressure arrays and high sampling rates for clinical-grade analysis. Moticon
prioritizes wireless convenience and easier field use.
Top running picks with stride, ground contact time, and form analysis
Choose based on what you need: high sampling for precise ground contact time or on-shoe processing for real-time
form cues. Higher sample rates improve interval feedback but reduce battery life.
Smart insoles vs. fully integrated options
Insoles retrofit many shoes and deliver detailed pressure maps. Integrated designs win on ergonomics and seamless
tracking during long runs.
Solution
Strength
Trade-off
Best for
Pedar
Calibrated pressure arrays
Higher cost, lab focus
Clinical gait labs
F-Scan
High sampling fidelity
Complex setup
Research & rehab
Moticon OpenGo
Wireless autonomy
Lower sensor density
Field testing & athletes
Consumer insoles
Easy retrofit
Variable durability
Data-curious runners
Selection tip: test fit alignment, check firmware cadence, and favor products with stable apps and
reliable BLE/mobile-cloud stacks. Iottive supports teams
building these pipelines to speed go-to-market and lift long-term user value.
Connected Running Analytics: What Data Runners Actually Use
Not every metric is equally useful. Runners and coaches focus on a short list that changes
training and prevents injury.
Key gait metrics are cadence, stride length, ground contact symmetry, and pronation tendencies. These
numbers show form, reveal imbalance, and guide shoe choice or drills.
Stride, cadence, pronation, and pressure maps for injury prevention
Pressure and IMU data map foot loading and cadence. Pressure maps expose hotspots that often match overuse risks.
Those maps help decide insoles, shoes, or technique tweaks.
Training load, recovery, and calories burned accuracy
Training load blends session intensity, volume, and impact surrogates to suggest recovery windows. Calories burned
vary by model; consistency beats raw accuracy for trend tracking.
Actionable insights: cadence nudges, midfoot strike cues, and asymmetry alerts after injury.
Watch contact time and vertical oscillation for fatigue signals during a run.
Validate new metrics against perceived exertion and race results.
Iottive’s mobile-cloud integration delivers clean dashboards and trend visualizations so users act
on analysis without overload. Keep sensors calibrated and alerts context-aware to preserve trust in the data.
AI Sports Footwear Innovations Shaping the 2020s
Putting models on the insole changes how systems balance latency, battery life, and personalization. Designers must
choose between instant, on-device cues and richer cloud-based profiling.
On-shoe inference gives near-zero delay for coaching cues. It reduces uplink needs and protects
short-term privacy. Cloud analysis enables deep personalization and long-term trend models that adapt to a
user over weeks or months.
How deep learning reads motion
Multivariate models fuse accelerometer and pressure streams to classify gait, flag anomalies, and estimate injury
risk. Sampling rates and chosen features directly affect model accuracy and power draw.
Approach
Benefit
Cost
Best use
On-device inference
Low latency, instant cues
Higher local compute, power use
Real-time coaching
Cloud analytics
Deep personalization, large models
Latency, bandwidth needs
Long-term trend analysis
Hybrid updates
Firmware model refreshes
Complex deployment
Balance reliability & improvements
Energy-harvesting systems
Extended autonomy
Added hardware complexity
Low-power, long-term use
Privacy by design limits raw data transfer and uses on-device summaries.
Personalization loops build baselines to refine fatigue and asymmetry thresholds.
Fail-safes revert to rule-based cues when model confidence is low.
Iottive builds embedded inference and cloud pipelines that match model placement to battery and performance goals,
while keeping firmware updates and user privacy front of mind.
Inside the Tech: Sensors, Connectivity, and Energy in Smart Shoes
Sensor choice and system design determine how well a product turns motion into useful signals.
Engineers must balance sensitivity, durability, and power to support accurate monitoring without bulky
batteries.
Pressure sensing options
Pressure arrays come in four common types: piezoresistive, capacitive, piezoelectric, and resonant. Piezoresistive
sensors are cost-effective and simple to read but drift over time.
Capacitive types offer higher sensitivity and lower drift but need careful encapsulation. Piezoelectric sensors
suit dynamic loads; resonant elements give high fidelity in labs yet raise integration cost.
IMUs for motion intelligence
IMUs merge accelerometers and gyroscopes to detect steps, orientation, and stride dynamics. Axis alignment and
mounting repeatability are critical to reliable data.
On-device fusion reduces uplink needs by extracting step events and features before wireless transfer.
Temperature and sweat biosensing
Temperature options include RTD, NTC, thermocouple, IR thermopile, and digital ICs. IR sensors can be useful when
contact is inconsistent.
Sweat biosensors can hint at hydration or glucose trends but require calibration and comfort-aware placement for
valid health signals.
Connectivity and energy realities
Bluetooth LE is the common link for low-power data transfer. Designers must handle packet
loss, burst buffering, and sync strategies during intense sessions.
Energy harvesting—mechanical-to-electrical—can extend battery life but complicates hardware and cost. Firmware
power modes, compression, and edge feature extraction deliver the best autonomy per gram of battery.
Mechanical and lifecycle considerations
Use flexible PCBs, robust encapsulation, and strain relief to survive repeated loading and moisture. Component
choices affect maintenance, warranty costs, and long-term value.
Iottive’s BLE app development and hardware-software integration expertise helps teams achieve
robust syncing, low-latency telemetry, and efficient battery usage across these trade-offs.
From Adidas “1” to AIoT: The Evolution of Smart Footwear
A. The journey from microprocessor cushioning to full-stack personalization spans two decades of hardware and app
milestones.
In 2005, the Adidas “1” introduced microprocessor-controlled cushioning and proved consumer footwear could embed
real control logic. By 2012, Nike+ used smartphones to scale tracking to millions and normalized app-driven
experiences.
In 2016 Under Armour added built-in tracking to mainstream models, tightening the link between sensors and daily
use. The 2020s brought deeper machine learning, broader device ecosystems, and device-grade health features.
Key shifts include component miniaturization for comfort, BLE standardization for reliable
pairing, and firmware updates that extend product life. Community data now refines models and guides product
updates.
Trace: from cushioning control to sensor-rich platforms
Scale: smartphone adoption unlocked cloud services and better apps
Future: healthcare validation and sustainability will shape new milestones
Milestone
Year
Impact
Adidas “1”
2005
Introduced on-device control for comfort
Nike+
2012
Made phone-linked tracking mainstream
Under Armour smart models
2016
Embedded sensors in consumer lines
AIoT era
2020s
Personalization, health features, and OTA model updates
Iottive helps brands modernize legacy concepts with today’s BLE, machine learning, and cloud
stacks to deliver reliable, wearable technology experiences that users trust.
Healthcare teams increasingly rely on localized pressure and temperature readings
to guide care for vulnerable feet. Precise deltas in load and warmth can flag early tissue stress and reduce ulcer
risk in diabetes through timely intervention.
Rehabilitation use cases include step-quality scoring, asymmetry detection, and adherence tracking
that clinicians review remotely. IMU thresholds and pattern recognition enable reliable fall detection and
real-world event capture for older adults.
Clinical deployment needs documented repeatability, validated accuracy, and clear protocols for data handling.
Privacy, consent, and secure transmission are essential to preserve patient trust and meet regulatory guidance for
health monitoring.
Integration: EHR and telehealth dashboards allow remote clinician review and
clinician-configured alerts.
Wearability: Comfort, washable encapsulation, simple charging, and long battery life drive
long-term adherence.
Accessibility: Large-text interfaces, voice prompts, and caregiver notifications improve
outcomes for diverse users.
Design note: durable, repeatable sensors and validated analysis are prerequisites before clinical use.
Iottive’s IoT & AIoT Solutions and compliance-aware cloud integration support healthcare-grade deployments that
prioritize data privacy, reliability, and clinician workflows.
Industrial and Occupational Use Cases for Smart Shoes
Workplace movement data turns everyday tasks into measurable signals that safety teams can act on.
In construction, logistics, and manufacturing, pressure and motion streams reveal risky patterns such as
overreaching, twisting, or long static loading.
Ergonomics monitoring, posture insights, and worker safety
Pressure maps and IMU-derived features detect prolonged time on feet and unsafe postures. Those signals feed
role-based dashboards so supervisors and individuals see different views of the same data.
Practical outcomes include fewer musculoskeletal injuries, smarter task allocation, and targeted training
programs that reduce strain. Operations teams use these insights to improve scheduling and reduce overtime fatigue.
Rugged design: slip resistance, sealed sensors, and impact-rated housings for real sites.
Operational needs: shift-long battery life, reliable syncing in RF-noisy environments, and
fleet firmware management.
Policy: clear privacy, consent, and labor rules to protect workers and maintain trust.
Iottive delivers custom systems and mobile dashboards that turn
movement signals into safety and productivity insights. Framing benefits as cost savings and reduced incident rates
helps win support from safety and operations leaders in the market.
The consumer market is moving fast. North America leads adoption while APAC growth is picking up as incomes rise
and more people move to cities.
Buyers want three things: simple setup, dependable syncing, and clear everyday insights. Social features like
challenges and shared milestones boost engagement and retention.
Platform ecosystems that link shoes, watches, and fitness apps make products stickier. Price tiers are emerging:
entry-level trackers, mid-range lifestyle models, and premium analytics systems for serious users.
Retail and e-commerce education reduces returns by setting fit and feature expectations.
Durability, transparent warranty terms, and visible firmware support give shoppers confidence.
Consumer Need
Why it Matters
How Brands Win
Example KPI
Easy pairing
Reduces setup friction
Robust BLE apps, clear guides
First-run success rate
Social sharing
Boosts motivation
Integrated leaderboards
Monthly active users
Privacy & updates
Builds trust
Transparent settings, firmware roadmap
Churn rate
Durability & warranty
Drives purchase confidence
Longer warranty, rugged design
Return frequency
Iottive partners with consumer brands to scale
mainstream-ready platforms with dependable BLE apps and mobile-cloud pipelines. Clear data controls and influencer
outreach help normalize these products in daily fitness routines.
Smart Shoe Market Outlook: Size, Segments, and Growth
Two headline forecasts highlight how assumptions change projections for the next decade.
Market size and CAGR through 2032
One estimate values the market at USD 155M in 2023, growing to USD 270.9M by 2032
at a 6.40% CAGR (2024–2032).
Another study projects a larger expansion: from USD 269M in 2023 to USD 2.1B by
2033 at a 22.7% CAGR. These gaps show why methodology and scope matter for any market forecast.
Segment leaders and user mix
Running products hold the largest share, and male end-users lead adoption and spend. Price tiers—from basic
trackers to premium platforms—shape who buys and why.
Drivers, restraints, and ecosystem opportunities
Health awareness, habitual fitness tracking, and richer app ecosystems drive demand. Key restraints include
hardware durability, sensor reliability, and ongoing software maintenance.
Opportunities: interoperable ecosystems that link apps, watches, and cloud analysis.
Regional note: North America leads now; APAC is the fastest-growing market.
Design priorities: comfort, battery life, accurate metrics, and clear consumer value.
Iottive helps brands capture growth with scalable mobile-cloud backends, BLE apps, and custom product
development that align features to segment needs and support robust analysis at scale.
Regional Insights: Where Adoption Leads and Why
Where consumers live and shop matters as much as what a product can measure. North America leads the market thanks
to deep fitness ecosystems, broad retail distribution, and strong mobile infrastructure.
APAC is the fastest-growing region. Urbanization, rising disposable income, and wide e-commerce reach push demand
for entry models that scale quickly.
Europe balances growth with strict data rules. Consumers expect wellness features, clear privacy controls, and
regional certification before trust builds.
Localization: language, sizing standards, and privacy norms change product expectations and UI
needs.
Partnerships: local retailers and running communities speed adoption through demos and trials.
Logistics & support: reliable after-sales, repair networks, and warranty plans reduce
returns and boost lifetime value.
Price sensitivity in emerging markets favors simpler entry models, while mature markets pay for richer analysis and
integration. Regulatory nuances for health-leaning features affect rollout timing and required clinical evidence.
Iottive supports localized app rollouts and regulatory alignment across North America, Europe, and
APAC to help brands stagger features and scale by region.
Integration Playbook: Bringing Footwear, Apps, and Cloud Together
Bridging on-device firmware with cloud services is what turns prototypes into reliable products. A clear
architecture keeps teams aligned and reduces field issues.
BLE app development and mobile-cloud pipelines
Map the stack: on-shoe firmware → BLE transport → mobile SDK → cloud analytics and secure APIs. Tune connection
intervals, MTU, and buffering to balance power and throughput.
Design mobile-cloud pipelines that convert raw packets into indexed features for fast analysis and long-term trend
models. Add clock-drift correction, loss recovery, and telemetry quality checks.
Data privacy, security, and compliance for consumer health data
Encrypt in transit and at rest, enforce role-based access, and define retention policies for
health-adjacent records. Use consent flows, granular permissions, and transparent policies as default.
Area
Best practice
Why it matters
Example KPI
BLE transport
MTU tuning & reconnection logic
Stable syncing, lower drops
Pair success rate
Telemetry
Time sync & buffering
Accurate analysis
Packet loss %
Security
Encryption & access control
Regulatory compliance
Audit pass rate
Delivery
CI/CD for app & firmware
Safe rollouts
Crash-free sessions
Iottive specializes in BLE app development, cloud & mobile integration, and end-to-end
solutions that link devices, systems, and user experience. For platform support and integration smart services,
contact www.iottive.com or sales@iottive.com.
User Experience Meets Biomechanics: Designing for Comfort and Insight
Designing a product that people wear every day starts with balancing human comfort and precise
biomechanics. Good material stacks preserve sensor fidelity while keeping the insole soft and supportive.
Material choices, insole design, and sensor placement
Layer cushioning to isolate sensors from shear while maintaining normal pressure patterns under
the foot. Use thin, durable encapsulation over pressure arrays to prevent drift and protect electronics
from moisture.
Place arrays under the heel and forefoot and mount IMUs on a stable midsole region to capture repeatable motion patterns. Offer trim lines on insoles so sizing matches anatomical landmarks.
Reducing friction: charging, updates, and pairing reliability
Favor ergonomic charging—wireless pads or pogo pins that align easily—and OTA firmware that resumes after
interruption. Build pairing flows that handle interference, re-authentication, and multi-device scenarios to keep
the user experience smooth.
Area
Design choice
User benefit
Material stack
Encapsulated cushion layers
Comfort + sensor fidelity
Sensor layout
Heel/forefoot arrays, midsole IMU
Repeatable pressure & motion patterns
Charging & OTA
Wireless/pogo + resumable updates
Higher compliance, low disruption
Iottive helps teams prototype UX flows that balance biomechanics accuracy with everyday
convenience. Test across diverse users to validate insight clarity and long-term hygiene of the platform.
Challenges to Watch: Fit, Complexity, and Cost vs. Value
Product teams often discover that every added capability brings trade-offs in fit, assembly, and price. Design
choices can erode comfort and push a product above its target price if not carefully scoped.
Compute and sensor selection affect the bill of materials, manufacturing steps, and serviceability. High-sample
sensors and on-device inference raise component cost and test complexity, increasing returns risk when pairing or
updates fail.
Field validation is essential: lab results must translate into user-perceived benefits in real
conditions. Without robust trials, market claims on accuracy and analysis become a liability, not an advantage.
Value-first roadmap: start with reliable core metrics, then layer advanced insights that users
actually use.
Modularity: design replaceable modules to simplify repairs and extend product life.
Regulatory & privacy: health-leaning features add overhead for compliance and secure data
handling.
Supply chain: specialized sensors and flexible electronics require vetted suppliers to avoid
delays and quality issues.
Iottive’s end-to-end approach helps teams de-risk complexity, optimize BOM, and align features to user value. Transparent marketing and continuous feedback loops keep expectations realistic and improve
long-term product trust in the market.
Partner with Iottive to Build Your Next Smart Shoe Platform
Brands accelerating from prototype to production rely on partners who can own firmware, mobile, and cloud
workstreams.
Iottive delivers end-to-end support for smart shoe projects. Our services cover firmware, mobile
SDKs, analytics pipelines, and admin portals. We focus on stable connectivity, battery-friendly
telemetry, and dependable OTA updates.
We offer co-design on sensor selection, placement, and calibration so gait and health analysis are
reliable in real use. Workflows include PoCs, pilot programs, and scaled rollouts with observability built-in.
Integration: firmware → BLE transport → mobile SDK → cloud APIs
Compliance: security and privacy frameworks for consumer and healthcare-grade data
Platform links: Apple Health, Google Fit, and third-party training integrations
Block
What we deliver
Benefit
When to engage
Firmware
Low-power sampling & feature extraction
Longer battery life, robust telemetry
Prototype → pilot
Mobile SDK
Pairing flows & UI components
Higher first-run success, lower churn
Pre-launch & updates
Cloud & Admin
Dashboards, device fleet management
Operational visibility, secure storage
Pilot → scale
Validation
Sensor calibration & clinical-grade testing
Trustworthy metrics for users and clinicians
Health market entry
We draw on experience across Healthcare, Automotive, Consumer Electronics, and Industrial systems to reduce
time-to-market. Expect measurable outcomes: improved user retention, fewer pairing failures, and lower return rates.
Get started: schedule a discovery session or scoping workshop at www.iottive.com or email sales@iottive.com. Partner with Iottive to turn device concepts into
market-ready products that users trust.
Conclusion
strong, The latest platforms focus on usable metrics, reliable pairing, and long-term value for
users in the evolving market for smart shoes.
Modern shoes convert each step into clear analysis that improves training and lowers injury risk. Integrated
sensors capture pressure, IMU motion, and temperature, then turn raw data into timelier cues.
Buyers should weigh sensor fidelity, connectivity and battery life, comfort, and app quality when comparing
footwear. AI helps personalize guidance, while healthcare and industrial uses prove the tech’s reach beyond simple
fitness tracking.
Fit, cost, and system complexity remain real constraints. Choose products with robust firmware, strong privacy
policies, and ecosystem interoperability. For platform design, trials, or scaled rollouts, contact Iottive: www.iottive.com | sales@iottive.com.
FAQ
What key metrics do these intelligent running shoes track?
Most models measure cadence, stride length, ground contact time, and pressure distribution. Many also add IMU-based motion data (accelerometer and gyroscope) for gait and pronation analysis, plus temperature or sweat sensing for basic health signals.
Which sensors should I look for when buying performance-focused footwear?
Prioritize pressure sensors, an IMU suite (accelerometer and gyroscope), and a reliable temperature sensor. These give the core inputs for gait analysis, load monitoring, and early signs of overheating or localized pressure that can lead to injury.
How do connectivity choices affect battery life and data quality?
Bluetooth Low Energy (BLE) conserves power and works well for live sync to phones. Wi‑Fi moves larger datasets faster but drains battery sooner. On‑shoe processing reduces wide data transfers and saves energy, while cloud uploads enable deeper analytics at the cost of more frequent syncing.
Are integrated sensor shoes better than sensor insoles?
Integrated shoes offer seamless data capture and consistent sensor placement, improving reliability. Insoles are modular and cost-effective, letting you upgrade existing footwear. Choose based on budget, desired durability, and whether you need multi‑shoe flexibility.
How accurate are calorie and training load estimates from footwear?
Estimates vary by algorithm and sensor quality. When motion data is combined with individual metrics (weight, age, VO2 estimates), accuracy improves. Expect close approximations for activity-based calories but some variance for metabolic rate estimates compared with lab tests.
Can these products help prevent injuries?
Yes. Pressure maps, asymmetry detection, and abnormal gait alerts can identify risk patterns early. Paired with coaching features that suggest cadence changes or strength work, they support injury prevention but don’t replace professional medical advice.
Do on‑shoe AI features work without internet access?
Some shoes run inference on-device for latency‑sensitive feedback, so basic coaching and alerts work offline. Advanced personalized models and long‑term trend analysis often require cloud connectivity to process larger datasets.
What are the practical maintenance and durability concerns?
Expect to manage battery charging, firmware updates, and occasional sensor recalibration. Water resistance, sole wear, and connector longevity matter—choose brands known for build quality and clear maintenance guidance.
How is health data protected when apps sync with cloud services?
Look for end‑to‑end encryption, clear privacy policies, and compliance with regional health data standards like HIPAA where applicable. Reputable vendors publish security practices and allow users to control data sharing.
Which brands have led the evolution of intelligent footwear?
Major milestones include Adidas’s early connected models, Nike’s fuel‑tracking efforts, and Under Armour’s partnerships around wearables. Today, several athletic and medical device companies advance on‑shoe sensing and analytics.
Are there clinically validated options for medical use?
A few systems target clinical markets with validation studies, particularly for diabetic foot care and rehabilitation. For medical applications, choose devices with peer‑reviewed evidence and regulatory clearances.
How should developers integrate shoe data into mobile and cloud platforms?
Use BLE for near‑real‑time sync, implement robust mobile SDKs, and design a scalable pipeline to cloud analytics. Prioritize low‑power data formats, user consent flows, and secure storage for personal health metrics.
What performance trade-offs exist between comfort and sensing capability?
Adding sensors, batteries, and rigid housings can affect fit and weight. The best designs place sensors to minimize pressure points and use lightweight power systems to preserve comfort while retaining accurate measurements.
How do temperature and sweat sensors add value beyond motion data?
Thermal and moisture signals help detect overheating, localized inflammation, or blister risk. Combined with pressure maps, they enrich context for injury prevention and recovery monitoring.
What should a buyer consider about price versus features?
Match features to goals: casual runners need basic cadence and distance; competitive athletes benefit from detailed ground contact and form analytics; clinicians require validated metrics. Higher price often buys durability, better sensors, and stronger app ecosystems.
A short story: At a busy U.S. hospital, a nurse once rushed between floors hunting for a vital
infusion pump. A real-time tag pinged from a laptop, and the pump was found in minutes. That small win turned a long
delay into immediate care.
This guide explains how connected sensors, devices, and platforms turn real-time clinical and operational
data into safer, higher-quality patient care. You will learn foundational concepts, reference architectures, and
high-value use cases that matter to American providers.
We describe RTLS with BLE, RFID, and Wi‑Fi, plus environmental monitoring and wearables that capture vitals. Cisco
Catalyst and Meraki access points can act as gateways, helping centralize device visibility and alerts across sites.
Why now: Aging populations, rising chronic disease, and staffing gaps push hospitals to adopt
resilient, network-friendly technologies that scale. This section sets the stage for practical steps to improve
outcomes, speed interventions, and avoid vendor lock-in.
Key Takeaways
Connected devices and sensors make real-time monitoring actionable for providers.
RTLS, wearables, and environmental sensors reduce delays and improve outcomes.
Network gateways like Cisco Catalyst and Meraki simplify deployments.
Open ecosystems and centralized management ease scaling across systems of care.
Security, compliance, and interoperability are non-negotiable for U.S. adoption.
What Is Healthcare IoT and Why It Matters Now in the United States
Real-time device telemetry and sensor feeds turn episodic visits into continuous patient observation across care
sites.
Defining the system
Healthcare iot healthcare is a network of connected devices and sensors that stream clinical and
operational data into workflows. These signals enable continuous monitoring, automated alerts, and faster decisions
that improve patient care.
Present-day pressures
U.S. systems face aging populations, rising chronic conditions, and persistent staffing shortages. COVID-19 showed
the need to scale remote-ready technologies to manage capacity and cost.
Continuous monitoring captures vitals, behavior, and environmental context so providers intervene earlier
and cut unnecessary readmissions.
Device Type
Data Collected
Primary Benefit
Clinical wearables
Heart rate, SpO2, activity
Early warning of decline
Environmental sensors
Temp, humidity, air quality
Compliance and infection control
RTLS tags & telemetry
Location, equipment status
Faster time-to-care and asset use
Why timing matters: value-based payment and capacity limits reward technologies that boost
visibility and reduce time to treatment. Strong connectivity and device management keep data reliable and equitable
across rural and urban populations. The next section maps how sensors, networks, and analytics form a secure,
scalable architecture.
Inside an IoT Healthcare Architecture: From Sensors to Insights
A layered architecture turns raw sensor signals into clinical alerts and operational dashboards.
Perception layer
Perception layer: sensing vitals and equipment state
Wearables, biosensors, RFID tags, cameras, and GPS modules collect heart rate, blood pressure, glucose, movement,
temperature, humidity, and asset location.
These inputs help teams monitor patients and track equipment in real
time.
Network layer
Network layer: moving signals reliably
BLE handles low-power proximity tasks. Wi‑Fi delivers high throughput across campuses. RFID supports precise
tracking.
LPWAN (NB‑IoT/LoRaWAN) spans long range with low power, while 4G/5G provides mobility and resilience.
Application and analytics
Application layer and data: turning streams into workflows
Dashboards, alert rules, and API-based integration feed EHRs and service desks. Edge computing reduces latency for
critical monitoring and lowers bandwidth needs.
AI/ML on curated data enables anomaly detection and predictive
maintenance of equipment.
Layer
Key Components
Primary Benefit
Perception
Wearables, biosensors, RFID, cameras
Continuous vitals and asset telemetry
Network
BLE, Wi‑Fi, LPWAN, 4G/5G, RFID
Reliable signal transport across facilities
Application & Data
Dashboards, edge nodes, AI/ML, APIs
Actionable alerts and integrated workflows
Governance and integration matter. Role-based access, encryption in transit and at rest, and audit
logs protect sensitive data.
Using Cisco Catalyst and Meraki access points as gateways can reduce additional
hardware and speed deployment across existing infrastructure.
Core Technologies Powering Smart Hospitals and Remote Care
Modern hospitals depend on a set of complementary technologies to track equipment, monitor conditions, and
keep patients safe. These building blocks turn raw signals into timely actions that reduce delays and cut
costs.
RTLS with BLE and RFID
Real-time location systems use BLE tags, RFID, and Wi‑Fi to map assets, tagged patients, and staff. This
reduces search time for medical equipment and speeds responses during critical events.
Environmental monitoring
Temperature, humidity, and air-quality sensors stream data for pharmacy refrigerators, labs, ORs, and patient
rooms. Automated alerts protect medications and keep compliance logs for audits.
Clinical wearables
Wearables capture heart rate, blood pressure, glucose, and movement for remote monitoring and fall detection. These
devices support early intervention and fewer unnecessary visits.
Gateways, onboarding, and analytics
Using existing Wi‑Fi access points as gateways simplifies deployments and enforces secure onboarding and
segmentation. Wayfinding and occupancy analytics guide visitors, reduce missed appointments, and focus cleaning on
high-traffic areas.
Lifecycle and governance: battery life, calibration, firmware updates, and centralized maintenance
keep sensors and equipment reliable. Together, these technologies boost staff efficiency and improve the patient
experience across hospital and remote care systems.
High-Impact Use Cases for Healthcare Providers and Patients
High-value use cases link patient-facing devices and facility sensors to dashboards that drive faster
treatment and lower costs.
Remote patient monitoring and real-time alerts
At-home blood pressure cuffs, glucose monitors, and smart inhalers capture health data and send it to care teams.
Clinician dashboards surface prioritized alerts when thresholds are crossed.
That real-time visibility enables prompt outreach, medication changes, or clinic visits that cut
readmissions and speed treatment.
Operations: space use, predictive maintenance, and safety
Sensors track room occupancy, equipment use, and environmental status to plan cleaning and allocate staff.
Predictive maintenance flags failing medical equipment before it causes downtime.
Asset tracking and inventory
RFID and BLE tagging reduces lost equipment and manual searches. Faster device location shortens time-to-care and
trims unnecessary reorders.
Telemedicine, medication management, and assisted living
Reliable connectivity supports video consults and remote diagnostics alongside continuous monitoring. Automated
dispensers and reminders improve adherence for chronic conditions.
Passive sensors detect falls and track sleep patterns to support aging in place while reducing caregiver burden.
Measurable outcomes: faster interventions, fewer adverse events, and higher patient and caregiver
satisfaction when devices and dashboards integrate with clinical workflows.
Tangible Benefits: Outcomes, Operational Efficiency, and Cost Control
Streams of location and condition data let teams find equipment fast and fix problems before they affect care.
Proactive care delivery: Continuous monitoring enables earlier detection and faster intervention.
That leads to better patient outcomes and fewer costly readmissions.
Operational efficiency improves when routine checks are automated. Fewer manual rounds, faster access to
devices, and occupancy insights shorten wait times and boost throughput.
Staff relief: clinicians spend more time with patients and less on searches and paperwork.
Cost control: tracked assets reduce loss and prevent excess purchases.
Medicine protection: monitored storage cuts spoilage and waste.
“Automated, time-stamped logs simplify audits and make compliance more reliable.”
Compliance and safety: Environmental alerts, staff duress signals, and audit-ready records reduce
risk. Standardized dashboards give providers consistent data to benchmark operations and improve treatment across
sites.
Implementing an IoT Smart Healthcare Solution: Integration, Security, and Scale
Start with a clear integration plan that maps device roles, data flows, and clinical touchpoints across
sites.
Adopt an open ecosystem to preserve device choice and cut pilot time. Cisco Spaces works with Catalyst and Meraki
access points as gateways to use existing wireless infrastructure and avoid extra hardware.
Open ecosystems in practice
Choose pre-certified vendors to speed deployment. A supported BLE framework with 50+ vendors reduces
vendor lock-in and helps providers pick the best devices for tracking, environmental monitoring, and staff safety.
Centralized device management
Central dashboards show device status, connectivity, firmware state, and alerts. That visibility reduces downtime,
lowers mean time to repair, and improves operational efficiency.
Avoiding vendor lock‑in
Leverage network-friendly onboarding, segmentation, and APIs to integrate data with EHRs and service desks. Build
governance with runbooks, SLAs, and cross-functional ownership to sustain operations.
Start with assess → pilot → measure → expand.
Embed security by design: segmentation, strong authentication, and encryption aligned to HIPAA.
Use gateways on existing infrastructure to speed rollouts and reduce capital expense.
Challenges Today and What’s Next: Security, Interoperability, and Emerging Technologies
Securing patient trust and connecting diverse systems remain the top obstacles as hospitals scale device
fleets and analytics. Providers must build controls that protect data and still let clinicians act
quickly.
Security and privacy by design
Encrypt data in transit and at rest, require device authentication, and apply network segmentation
to reduce risk. Regular firmware updates and patching close common attack paths.
HIPAA-aligned controls—least-privilege access, detailed audit logs, and role-based policies—help meet
compliance and protect patients.
Interoperability and data standards
Fragmented formats slow integration. Adopt open APIs and common protocols to let devices and systems share
real-time alerts and clinical state without silos.
Standardized feeds improve clinical workflows and speed evidence gathering for pilots and scale-up.
Regulatory and reimbursement considerations
Policy gaps and unclear reimbursement can block projects. Align pilots to measurable outcomes and collect evidence
to support funding and wider adoption.
Future trends to watch
5G and improved connectivity enable higher device density and low-latency use cases. Edge computing keeps critical
processing local for faster alarms and privacy. AI on streaming data supports early warning scores and predictive
maintenance. Where appropriate, blockchain can add tamper-proof audit trails for consented sharing.
“Resilience planning ensures monitoring and alerts persist during outages or disasters.”
Encrypt and authenticate everywhere.
Use open APIs for integration.
Design pilots to prove outcomes and funding.
Plan for edge, AI, and resilient infrastructure.
Conclusion
Connecting device fleets, analytics, and clinical workflows turns scattered signals into clear, timely actions for
patients and staff. , Devices and sensors feed trusted data that helps providers detect decline earlier, shorten response time, and improve patient outcomes.
Open ecosystems and centralized management reduce complexity and speed time to value. They also make operations
more efficient and deliver clear benefits for care teams and patients.
Security, interoperability, and governance must guard trust while programs scale. Prioritize high-impact pilots—patient monitoring, asset tracking, and environmental compliance—then expand based on measured results.
Assess readiness, run strategic pilots, and build a roadmap to scale patient monitoring and operations confidently. As networks, analytics, and edge compute mature, iot solutions will deepen impact on health, costs, and experience.
FAQ
What is healthcare IoT and why does it matter now in the United States?
Healthcare IoT refers to connected devices, sensors, and systems that collect real‑time clinical data to support patient care. It matters now because rising chronic disease, workforce shortages, and post‑pandemic demand for scalable remote care push providers to adopt remote monitoring, telehealth, and automated workflows to improve outcomes and reduce costs.
How does a typical connected healthcare architecture work from sensors to insights?
The architecture starts with a perception layer of clinical wearables, biosensors, and telemetry on medical equipment. Data travels via a network layer using BLE, Wi‑Fi, RFID, LPWAN, or 4G/5G to gateways and edge nodes. Application layers provide dashboards, alerts, and workflow integration, while analytics and AI/ML on secure pipelines turn raw signals into clinical insights.
Which network technologies are best for real‑time monitoring in hospitals?
Choice depends on the use case. BLE and Wi‑Fi suit indoor patient monitoring and RTLS. LPWAN covers low‑power, wide‑area sensors. 4G/5G enables high‑bandwidth telemetry and low‑latency remote procedures. A hybrid approach often delivers the best balance of latency, coverage, and power consumption.
What types of clinical wearables and sensors are commonly used?
Common devices include heart rate monitors, blood pressure cuffs, continuous glucose monitors, pulse oximeters, and motion trackers. Environmental sensors for temperature, humidity, and air quality also support infection control and compliance. These devices feed continuous data for early intervention and better care plans.
How do asset tracking and RTLS improve hospital operations?
RTLS with BLE or RFID locates equipment and patients in real time, reducing time spent searching for devices, shrinking downtime, and improving workflows. That leads to faster treatment, lower capital expenses through better utilization, and enhanced patient safety by preventing equipment shortages.
What are high‑impact use cases for providers and patients?
Key use cases include remote patient monitoring with real‑time alerts, smart operations such as predictive maintenance and space optimization, inventory and asset management, telemedicine integration, medication adherence tracking, and ambient assisted living for chronic care.
What measurable benefits can hospitals expect from deploying connected systems?
Providers can achieve earlier interventions and improved clinical outcomes, streamlined workflows and reduced delays, lower operational costs from optimized asset use, and stronger compliance through automated reporting and audit trails.
How should organizations approach integration and scale to avoid vendor lock‑in?
Adopt open ecosystems and standards, use gateways that support multiple protocols, and select interoperable platforms. Centralized device management with multi‑site visibility helps maintain control, while choosing pre‑certified vendors accelerates deployment and reduces proprietary dependency.
What security and privacy measures are essential for connected deployments?
Security by design is critical: strong encryption, device authentication, network segmentation, and continuous monitoring. Align systems with HIPAA and other regulations, enforce role‑based access, and maintain secure data pipelines from edge to cloud to protect patient information.
How do analytics like edge computing and AI add value?
Edge computing reduces latency and preserves bandwidth by processing data locally for immediate alerts. AI and machine learning analyze trends, predict deterioration, and prioritize workflows, enabling proactive care and reducing clinician burden.
What regulatory and reimbursement hurdles affect adoption?
Providers must meet HIPAA and FDA requirements where applicable, demonstrate clinical validity for remote monitoring, and navigate reimbursement policies for telehealth and RPM. Clear pathways and pilot data often support sustainable adoption and payer coverage.
What emerging technologies will shape the next phase of connected care?
Next‑gen trends include expanded 5G use, more sophisticated edge analytics, AI‑driven clinical decision support, enhanced device interoperability, and explorations of blockchain for auditability. These advances promise lower latency, better insights, and tighter security.
How can facilities ensure compliance and safety with environmental monitoring?
Deploy calibrated temperature, humidity, and air‑quality sensors linked to alerting systems and automated logs. Integrate environmental data into compliance workflows to support sterile storage, infection control, and audit readiness.
On a rainy Tuesday in Tampa, a commuter tapped his brake less and smiled more. His dashboard had warned of a sudden hazard ahead, and a nearby signal adjusted to ease congestion. That brief moment showed how modern systems can change a commute.
The story is a snapshot of how vehicles and roadside equipment share information to cut crashes and calm traffic. Real-time, two-way data helps spot hazards, tune signals, and guide drivers toward safer choices.
VICAD—the link between vehicle sensing, roadside systems, cloud analytics, and governance—turns raw data into timed actions. Pilot projects in the U.S. show fewer emergency brakings and modest travel-time gains when these systems work together.
Companies like Iottive bring end-to-end expertise in connected sensors, BLE apps, and cloud/mobile platforms to help scale these deployments. This guide will map the key systems, real-world benefits, and the governance needed for safe development.
Key Takeaways
Real-time data exchange links vehicles and infrastructure to improve safety and ease traffic.
Cooperative systems like VICAD turn sensor inputs into actionable, safety-focused outcomes.
Pilot results show measurable drops in forward collisions and emergency braking events.
Deployment needs clear governance for privacy, encryption, and trusted data flows.
Vendors such as Iottive offer end-to-end solutions for scaling deployments across cities.
The state of AI-powered V2I and IoT smart roads in the United States today
Cities and highways are upgrading to systems that sense conditions and alter signal timing in real time.
Why this matters: American road infrastructure is shifting from fixed assets to adaptive, sensor-rich platforms. Embedded sensors, connected signals, and gateways now continuously sense, compute, and coordinate movement for safer travel.
Why real-time data exchange is the new backbone of transportation systems
Real-time information between vehicles, signals, and management systems underpins safety-critical applications. Live feeds reduce surprises for drivers and help control traffic flow during peak periods.
From static roads to adaptive infrastructure: what’s changed and why it matters
Pilots show measurable gains: highway travel times improve about 10.4% and intersection queues shrink nearly 20%. Adaptive signals can cut CO2 by up to 30% and raise overall traffic efficiency by more than a third.
Baseline assets: roadside sensors, connected signals, and vehicle gateways.
Funding: federal grants and PPPs speed development and scale.
Operational shift: agencies move from static timing plans to continuous, data-driven management.
Vendors such as Iottive build end-to-end solutions—pairing BLE, mobile, and cloud to link roadside devices, vehicles, and platforms for U.S. agencies. Standards alignment and workforce development remain key to citywide deployment.
V2X fundamentals: How vehicles, infrastructure, and networks communicate
V2X is the umbrella for vehicle communication with other vehicles, roadside systems, pedestrians, and cloud services. It defines how information moves and which messages get priority when seconds matter.
V2V, V2I, V2P, and V2N in practice
V2V shares speed, position, and direction for collision avoidance. NHTSA estimates V2V and V2I safety apps could eliminate or mitigate up to 80% of non‑impaired crashes, especially at busy intersections.
V2I sends green‑light speed advisories and optimized signal timing. V2P warns drivers of pedestrians and cyclists via phones and wearables. V2N links vehicles to cloud systems for rerouting and fleet coordination.
Where edge analytics amplify situational awareness
Edge computing lives in vehicle ECUs and roadside units to fuse sensor streams and act on real‑time data. Ultra‑reliable, low‑latency channels carry safety messages with strict priorities so warnings reach drivers in time.
Message types: status, warning, and control — prioritized by time sensitivity.
Perception boost: shared intent extends line‑of‑sight and aids cooperative maneuvers.
Data governance: authentication, anonymization, and minimal fields keep exchanges safe.
Iottive’s BLE app development and cloud/mobile integration enable secure edge‑to‑cloud data exchange for pilots and production programs that test these systems in real traffic.
AI V2I connectivity, IoT smart roads, autonomous mobility integration
When on-vehicle sensors meet roadside processing and cloud analytics, detection confidence rises and false alerts fall.
Core components: sensors, roadside units, traffic signals, and cloud platforms
Perception layers use cameras, radar, and LiDAR to gather local views. Roadside units handle short‑range processing and messaging.
Signals and cloud link local insights to citywide optimization and operator dashboards for real‑time management.
VICAD architecture: Vehicle, Infrastructure, Cloud, and Data working together
The VICAD model syncs on‑board intelligence with field sensing and cloud analytics. This mix boosts detection of occluded hazards and improves decision quality.
“Merging infrastructure sensing with vehicle perception adds a vital layer of redundancy for intersection safety.”
From ADAS to cooperative driving: enabling safer autonomous driving
Shared intent messages help vehicles negotiate merges and unprotected turns. Operators use dashboards to monitor KPIs, send updates, and manage device health.
Layer
Function
Benefit
Perception
Cameras, radar, LiDAR
Hazard detection, blind‑spot coverage
Edge units
Local fusion & messaging
Low latency warnings
Signal control
Adaptive timing
Reduced delay, clearer routing
Cloud
Analytics & dashboards
Citywide optimization, OTA updates
Iottive designs custom platforms that connect sensors, RSUs, and cloud services with BLE and mobile apps to support pilots and production deployments.
5G, DSRC, and C‑V2X: The communications stack enabling real-time responsiveness
Modern transport relies on layered wireless links to deliver life‑critical alerts in milliseconds. The communications stack blends 5G and short‑range radio protocols to move information that prevents collisions and clears intersections.
Why latency matters: millisecond‑level delays separate a near miss from a crash. Short‑range radios like DSRC and IEEE 802.11p offer predictable range and low delay for intersection use. C‑V2X delivers broader coverage and longer reach but needs spectrum and vendor alignment.
5G brings ultra‑low latency and high bandwidth for real time HD map updates, remote operation, and scaling connected devices in dense urban canyons. Edge preprocessing prioritizes safety messages while the cloud aggregates data for learning and system development.
Interoperability and security: regions use ITS‑G5, C‑V2X, and IEEE variants, so multi‑mode gateways ease transitions. Architectures must include mutual authentication and signed messages to keep networks and infrastructure trusted during peak traffic and emergencies.
DSRC vs C‑V2X: spectrum, range, and deployment trade‑offs for city vs corridor use.
Edge + cloud: prioritize safety messages at the edge, aggregate in cloud for updates.
Cybersecurity: authentication, message signing, and robust failover across systems.
Iottive integrates mobile and cloud services with roadside communication stacks to support DSRC and C‑V2X pilots and enable scalable rollouts.
AI and data pipelines: Turning sensor streams into decisions in real time
Sensor streams must be turned into clear actions within fractions of a second to prevent crashes and ease delays. The end-to-end pipeline ingests, cleans, fuses, infers, decides, and acts across vehicle, roadside edge, and cloud tiers.
Edge vs. cloud analytics for time-critical safety and traffic flow
Edge handles sub-100 ms safety decisions and local alerts. It filters and forwards key information to the cloud.
Cloud supports fleet learning, long‑range optimization, and policy management. Iottive’s cloud & mobile integration links edge devices to secure data lakes and dashboards.
HD maps, predictive maintenance, and signal optimization
HD map streaming and change detection keep vehicles and signals aligned with work zones and incidents.
Predictive maintenance cuts repair costs by about 25% and spots needs up to 90% faster than manual methods.
Data governance, privacy, and public trust
“Transparent retention, minimal collection, and role-based access build citizen confidence.”
Encrypt data in transit and at rest.
Apply anonymization and differential privacy.
Run audits, red-team tests, and clear public communications.
Stage
Role
Outcome
Ingest & Clean
Edge/vehicle
Reduce noise, keep latency low
Fuse & Infer
Edge
Sub-100 ms safety alerts
Decide & Act
Edge/Signal
Immediate warnings, adaptive timing
Aggregate & Learn
Cloud
Citywide optimization, maintenance planning
Proven benefits: Safety, efficiency, and sustainability outcomes you can measure
Real-world trials reveal that targeted alerts and adaptive signal timing drive measurable safety and energy wins on busy corridors.
Crash prevention and hazard detection in busy intersections
Targeted warnings and anomaly detection reduce conflict points where pedestrians, bikes, and vehicles meet. Tampa’s pilot cut forward collision conflicts by 9% and emergency braking incidents by 23%.
Improved traffic flow, reduced idling, and lower emissions
Adaptive signals smooth arrivals and enable platoons, lowering stops and delays. The same pilot showed travel times fell by 2.1% and idle minutes by 1.8%.
Optimized timing can cut emissions by roughly 32–40%, which trims fuel consumption and greenhouse gases while easing driver stress.
Energy optimization and EV charging strategies on connected corridors
Systems that steer electric vehicles to available chargers and to off‑peak windows reduce grid strain and improve charge access. Energy-aware lighting and roadside equipment can dim or shift schedules to cut operating costs.
“Outcome-based KPIs — crash surrogates, person-throughput, idle minutes, and emissions per mile — help cities measure real progress.”
Quantify intersection safety gains from alerts and anomaly detection.
Link adaptive control to fewer stops, smoother traffic flow, and emission drops.
Reduce fuel consumption, tire/brake wear, and improve transit on-time performance.
Steer electric vehicles to chargers and off-peak windows to balance the grid.
Use energy-aware lighting to trim operational cost and emissions.
Iottive’s end-to-end solutions support energy-aware applications and electric vehicle integrations across roadside and mobile apps, making these outcomes measurable and repeatable.
Real-world case studies and pilots shaping deployment
Field pilots reveal how coordinated signaling and in-vehicle alerts change driver behavior at busy intersections.
Tampa connected vehicle pilot: signal prioritization and conflict reduction
Architecture and message sets: Tampa’s THEA pilot linked vehicle beacons and roadside signal controllers to prioritize phases and send timely warnings. Message logic gave proactive green timing to reduce conflict points and warn drivers of potential hazards.
Metrics: The deployment yielded 9% fewer forward collision conflicts, 23% fewer emergency braking events, 2.1% reduced travel time, 1.8% lower idle time, and 56% participant satisfaction.
Bus signal priority improved transit reliability while keeping cross‑traffic safe. Operators used dashboards to track performance and validate outcomes.
Michigan lessons: unified datasets and common languages
Michigan pilots stressed model alignment, shared semantics, and governance to avoid vendor lock‑in. Agencies adopted common schemas, API contracts, and phased testing to speed development and cut integration delays.
“Standardized data and repeatable testing protocols are the glue for scale.”
Translate Tampa patterns into reusable data schemas and API contracts.
Validate systems in realistic field conditions before citywide rollout.
Use BLE apps and cloud reporting to link participants, verify KPIs, and support pilot-to-scale execution.
Challenges to scale: Reliability, security, bandwidth, and power constraints
Large-scale rollouts stress networks in ways that lab tests rarely reproduce, especially under peak traffic and severe weather.
Communication reliability in dense urban settings and adverse weather
Urban canyons and heavy rain create multipath, blockage, and fading that hurt message delivery. Antenna diversity, sectorized radios, and cellular fallback reduce outages.
Designers should layer short‑range links with wide‑area links and plan for physical obstructions. This mix preserves safety messages when the environment degrades.
Cybersecurity, encryption, and authentication for resilient networks
Security must be baked in: a stack of PKI, certificate revocation, signed messages, and zero‑trust access keeps roadside and cloud edges trusted.
Regular certificate rotation, logging, and tamper detection help operations spot compromises and restore service fast.
Bandwidth, latency, and edge strategies for peak-load performance
Prioritize safety and control messages during spikes and compress or delay telemetry that is non‑critical. Dynamic bandwidth allocation and QoS rules maintain low latency for urgent alerts.
Edge buffering and local decision logic allow systems to act for seconds or minutes when backhaul drops, avoiding degraded safety at intersections.
Energy‑efficient devices and maintenance at roadside scale
Energy tactics lower OPEX: solar‑assisted cabinets, duty‑cycled sensors, and efficient compute modules extend field life. Remote diagnostics and OTA updates cut truck rolls.
Iottive designs low‑power IoT hardware and secure mobile/cloud pipelines to minimize maintenance cycles and protect sensitive mobility data.
“Resilience is as much about lifecycle management as it is about peak performance.”
RF mitigation: antenna diversity and fallback paths for urban blockage.
Security stack: PKI, revocation lists, signed messages, and zero‑trust policies.
Bandwidth tactics: prioritize safety, compress telemetry, and use edge buffering.
Lifecycle ops: remote health checks, OTA, and spare‑parts planning at scale.
Policy, funding, and PPPs: Accelerating smart infrastructure adoption
Public trust and clear liability rules often determine whether a pilot grows into citywide development.
Federal grants and programmatic funding map the first steps for infrastructure upgrades. BUILD grants and corridor investments, such as the I‑70 Mountain Corridor private upgrades, show how public dollars plus private capital speed deployment and reduce taxpayer burden.
Federal grants, standards, and adaptive regulatory frameworks
Standards enable cross-vendor interoperability, secure networks, and long-term maintainability. Adaptive regulation that shortens approval cycles can cut repair and rollout costs by roughly 25%.
Public-private partnerships and economic development impacts
PPPs blend public oversight with private innovation to fund large-scale development. These models create construction jobs, attract tech firms, and improve logistics efficiency.
Liability, insurance, and building public confidence
Clear liability allocation helps insurers price risk for vehicles and field equipment. New insurance approaches are emerging as a key part of the market, which some forecasts place near $1.5T by 2030.
Map funding avenues to safety, efficiency, and sustainability outcomes.
Use standards to protect security and long-term management.
Structure PPPs to de-risk pilots and document ROI through phased reporting.
Engage the public with privacy policies, open dashboards, and independent audits.
“Staged pilots and transparent reporting de-risk implementation and build political will.”
Iottive partners with agencies and OEMs to meet standards, document ROI, and de-risk implementation through staged pilots and clear reporting. That approach helps scale development while keeping data and safety central to transportation systems planning.
Implementation roadmap: From pilot to citywide autonomous mobility integration
A phased approach reduces risk, limits cost overruns, and speeds measurable benefits.
Start with readiness: run an asset and data readiness review to match architectures to corridor priorities and budgets.
Align stakeholders early—transportation agencies, vendors, and community groups—so governance, procurement, and privacy policies move in step.
Pilot design and KPIs
Co‑create MVP pilots with clear safety and efficiency KPIs such as conflict surrogates, idle‑time reduction, and citizen feedback loops.
Use unified datasets and common communication languages to avoid vendor lock‑in and speed validation, as demonstrated in Michigan pilots.
Scaling and operations
Define iteration cadence, scaling thresholds, and interoperability tests before expansion. This prevents delays that can raise costs by up to 150% per lane annually.
Establish 24/7 management for incident response, device health, and configuration. Integrate continuous improvement with model updates, firmware patches, and seasonal playbooks.
Align procurement, privacy compliance, and workforce training with long‑term sustainability.
Document KPIs and handoffs so operations and vendors share one source of truth.
“Pilot programs refine strategy before larger rollouts; clear KPIs and managed services turn lessons into repeatable deployment.”
Iottive offers readiness assessments, architecture recommendations, MVP pilots, KPI frameworks, and managed services to operate and evolve these systems and vehicle‑to‑field programs.
Where V2I meets industries: Healthcare, logistics, and smart city ecosystems
Hospitals, freight depots, and city control centers now rely on vehicle-to-field links to speed response and cut delays. These cross-sector ties let operators clear corridors, sync intersections, and move goods with fewer stops.
Healthcare and emergency response: Preemption and precision routing
Emergency preemption clears lanes and holds cross traffic so ambulances and fire services reach incidents faster. Precision routing factors in closures, weather, and demand to reduce response times and improve outcomes.
Freight and fleet: Platooning, fuel consumption, and operational efficiency
Platooning stabilizes headways, lowers drag, and trims fuel consumption for long hauls. Fleet telematics linked to city signals cut dwell at loading docks and boost schedule reliability.
Example: Iottive connects emergency vehicles, fleet apps, and roadside controllers via BLE and cloud APIs to support preemption, routing, and telematics. Shared data across agencies and private operators unlocks network-level gains in traffic flow and overall efficiency for transportation systems in U.S. cities.
Why Iottive for end-to-end IoT/AIoT smart road solutions
Iottive delivers complete systems that move from sensors to apps with clear KPIs and rapid pilots. Our work pairs rugged field devices, BLE-enabled gateways, and cloud platforms to make data useful for operations teams and vendors.
Our expertise: BLE app development, cloud & mobile integration, custom IoT products
We build BLE apps and mobile clients that link vehicles and field devices to secure cloud services. Our engineering teams deliver firmware, backend APIs, and mobile UX focused on reliability and fast deployment.
From sensors to apps: Vehicle connectivity and data exchange at scale
Standards-based APIs and interoperable architectures let agencies scale device fleets and networks. We operationalize vehicle connectivity, encrypted data pipelines, and certificate management to meet agency and OEM requirements.
Contact us to accelerate deployment
Services include discovery workshops, proof-of-concept builds, and phased citywide rollouts. Reach us: www.iottive.com | sales@iottive.com
Offering
Benefit
Use Case
Rugged sensors & gateways
Field reliability, low OPEX
Corridor sensing, EV charging detection
BLE & mobile apps
Driver alerts, fleet apps
Emergency preemption, fleet routing
Cloud & APIs
Analytics, KPI reporting
Pilot validation, ROI storytelling
Conclusion
Real‑world programs tie local sensing to signal logic, turning raw observations into faster, safer traffic responses. Pilots show clear wins: fewer conflicts and emergency brakings in Tampa, shorter travel and idle times, lower queues, and emissions down as much as 30% in tested corridors.
Standards, low‑latency links, and governed data pipelines make deployments resilient and trustworthy. Funded pilots and PPPs unlock scale while unified datasets and encryption keep systems reliable and auditable.
Assess, pilot, prove KPIs, and scale with continuous improvement and transparent reporting. Iottive
stands ready to partner across strategy, engineering, and operations to deliver measurable safety, efficiency, and sustainability outcomes. Contact: www.iottive.com | sales@iottive.com
FAQ
What is the role of real-time data exchange in modern transportation systems?
Real-time data exchange enables vehicles and roadside systems to share timely information about traffic, road conditions, signal status, and hazards. This continuous flow helps traffic managers optimize signal timing, reduces congestion, and supports faster emergency response. By combining sensor feeds, edge analytics, and cloud platforms, cities can improve safety and energy efficiency while lowering fuel consumption and emissions.
How do vehicles, infrastructure, and networks communicate in a V2X setup?
Vehicles communicate with each other, with roadside units, with pedestrians, and with network services using a layered communication stack such as 5G, DSRC, or C‑V2X. Messages include position, speed, and intent for collision avoidance and signal phase information for smoother intersections. Edge computing and machine learning amplify situational awareness by processing local sensor data before sending summarized insights to the cloud.
What are the key components of a roadside system that supports connected and cooperative driving?
Core components include roadway sensors (cameras, radar, LIDAR), roadside units and traffic signal controllers, centralized cloud platforms, and APIs for vehicle and fleet integration. Together these parts collect telemetry, run analytics, and deliver actionable alerts to vehicles and traffic operations centers, enabling cooperative functions like signal priority and platooning.
How does edge analytics differ from cloud analytics for time-critical decisions?
Edge analytics processes data close to the source, minimizing latency for safety-critical functions such as collision avoidance and emergency vehicle preemption. Cloud analytics handles longer-term tasks like HD map updates, predictive maintenance, and city-wide traffic optimization. A hybrid pipeline balances immediate responsiveness with scalable model training and historical trend analysis.
What communication technologies enable ultra-low latency for collision avoidance and alerts?
Ultra-low latency is achieved using cellular networks such as 5G and dedicated short-range communications (DSRC), or cellular-based C‑V2X. These options support rapid message delivery, high reliability, and prioritized traffic for public safety. Network slicing and edge compute also help guarantee timely performance during peak loads.
How do connected systems improve energy use and EV charging integration?
Connected infrastructure optimizes traffic flow to reduce idling and stop-and-go conditions, cutting fuel consumption and emissions. For electric vehicles, platforms can coordinate charging schedules, provide route-aware range predictions, and manage smart charging stations to balance grid demand and reduce peak loads, enhancing sustainability and operational efficiency.
What measurable safety benefits have pilots demonstrated in the United States?
Pilots like the Tampa connected vehicle program have shown reduced signal conflicts and faster emergency vehicle clearance. Michigan pilots have highlighted the value of unified datasets for consistent messaging. These tests report fewer near-misses, better intersection awareness, and improved response times—translating to lower crash risk and better public safety outcomes.
What are the main cybersecurity and privacy concerns for connected road systems?
Key concerns include secure message authentication, encryption, and device hardening to prevent spoofing or tampering. Data governance policies must control access, protect personal information, and maintain transparency to build public trust. Regular audits, patching, and multi-factor authentication help maintain resilience against attacks.
How do standards and interoperability affect regional deployments?
Interoperability ensures vehicles and roadside equipment from different vendors work together across cities and states. Aligned standards reduce integration costs and simplify scaling. Regional coordination of protocols, message sets, and certification processes helps avoid fragmentation and speeds wider adoption.
What factors should cities consider when moving from pilot projects to citywide deployment?
Cities should perform readiness assessments, align stakeholders, select scalable architectures, and define KPIs for safety, congestion, and emissions. Pilot design must include iterative scaling, maintenance plans, and operations teams for real-time management. Public-private partnerships and sustainable funding models are also critical for long-term success.
How can freight and fleet operators benefit from connected road infrastructure?
Freight and fleet operators gain from platooning, optimized routing, reduced fuel consumption, and predictive maintenance. Real-time data exchange improves ETA accuracy, lowers idle time, and boosts operational efficiency. Integration with telematics and cloud services helps fleets scale these benefits across routes and terminals.
What role do public-private partnerships and federal funding play in deployment?
Federal grants and adaptive regulations can accelerate infrastructure upgrades by lowering upfront costs. Public-private partnerships provide technical expertise, shared investment, and faster procurement. Together they support economic development, encourage innovation, and spread risk while building public confidence in new systems.
What are common technical challenges to scaling connected road solutions?
Common challenges include maintaining communication reliability in dense urban areas and adverse weather, ensuring sufficient bandwidth and low latency, and powering roadside devices efficiently. Solutions include redundancy, edge strategies for peak loads, efficient device design, and robust encryption to meet security and performance needs.
How do data governance and transparency influence public acceptance?
Clear policies on data use, retention, and anonymization build trust. Open communication about how data improves safety and reduces emissions helps gain public buy-in. Independent oversight, privacy safeguards, and accessible reporting on outcomes reinforce accountability and foster acceptance of connected services.
How can cities measure the ROI of connected infrastructure projects?
Cities can track metrics such as crash rates, emergency response times, vehicle hours of delay, fuel consumption, and emissions. Measuring changes in traffic throughput, signal efficiency, and EV charging utilization provides quantifiable evidence of safety, environmental, and economic benefits to justify continued investment.
Imagine a coach at halftime tapping an app and seeing real-time workload and recovery for every player.
Last season a college runner shared how a simple wrist readout cut her injury risk and boosted race pace. That moment showed how connected wearables can turn raw sensor streams into coaching-grade insight.
This Ultimate Guide will define an IoT fitness band, a wearable sports tracker, and a BLE athlete device. It will explain how BLE-centered links and edge-to-cloud analytics turn sensors into action during workouts.
Market momentum matters: forecasts show the wearables and iot market rising sharply through 2029. Whether you build hardware, pick SDKs, or plan a cloud pipeline, this guide bridges strategy and hands-on engineering.
Iottive is introduced as an end-to-end partner for BLE apps, cloud/mobile integration, and secure, scalable data systems. Contact: www.iottive.com | sales@iottive.com
Key Takeaways
Real-time insights come from fast connectivity, edge analytics, and clean data flows.
Market growth and shipment forecasts make now the time to invest in wearables.
The guide covers sensors, connectivity, AI coaching, security, and OTA reliability.
Examples like Apple Watch, WHOOP, and Garmin show real-world use cases.
Iottive offers practical help for apps, firmware, and cloud integration.
Why Wearable Sports Tech Matters Today
Real-time readouts are turning raw sensor output into actionable coaching advice.
User intent here is simple: learn how to plan, build, or integrate connected gear that improves performance, recovery, and safety.
User intent and what you’ll learn in this Ultimate Guide
This guide walks product leaders and engineers through market trends, sensor stacks, connectivity, edge/cloud pipelines, AI coaching, and coach-facing dashboards.
Outcomes include better training decisions, proactive recovery, in-session adjustments, and higher engagement in consumer fitness apps.
Clarify use cases and map metrics like heart rate, HRV, acceleration, and sleep to KPIs.
Choose the right category of devices, SDKs, and APIs to speed development and cut risk.
Address privacy, secure data flows, and OTA updates as core requirements.
Sector
Example Use
Key Benefit
Healthcare
Remote patient monitoring
Reduced readmissions
Retail & Logistics
AR-assisted workflows, tap-to-pay
Faster operations
Fitness industry
Real-time coaching and recovery
Improved performance
Iottive helps stakeholders prioritize features, define MVP scope, and design scalable app and cloud architecture aligned to measurable outcomes.
The Evolution and Market Momentum of Wearables and IoT
A decade ago step counts ruled; today sensors, edge AI, and cloud sync shape training decisions. The pace of change matters for product teams and brands planning scale.
From pedometers to AI-powered smart wearables
Early pedometers tracked steps. Modern sensor suites measure heart, motion, and sleep. On‑device processing now reduces latency and protects privacy while surfacing actionable guidance.
Key 2024–2025 stats: shipments, adoption, and trendlines
Market value is projected from $70.30B (2024) to $152.82B (2029). IDC reports ~538M shipments in 2024 with growth past 600M by 2028. The fitness tracker market alone was $55.5B in 2024 and may exceed $94B by 2027.
What rapid growth means for app builders and brands
Growth forces focus on interoperability, privacy, and OTA reliability to keep users engaged. Popular names like Apple Watch and Garmin set expectations for precision and battery life.
Broaden personas as rings, smart clothing, and AR expand the product set.
Prioritize flexible app architecture and measurable rollout metrics—active units, sync reliability, retention, and subscription conversion.
Take look at partnering with experienced IoT partners to speed development and avoid costly rewrites.
Choosing the right hardware begins with clear definitions of common product classes and their trade-offs. Each class targets different goals: long battery life, high-fidelity streams, or comfort for continuous wear. Iottive helps teams map those trade-offs to budget, roadmap, and KPIs.
IoT fitness band: A lightweight, sensor-focused piece built for long uptime and continuous monitoring of core metrics like heart rate and sleep. It favors battery life and simple sync intervals.
Wearable sports tracker: Multi-sensor hardware—wrist, chest, or apparel—that often adds GPS/ANT+, sport modes, and richer analytics for performance tracking.
BLE athlete device: A performance-grade Bluetooth Low Energy strap or pod made for low-latency, high-reliability streaming during sessions and matches.
Overlap and contrasts: All three capture biometrics and motion, but they differ in form factor, connectivity options (BLE, Wi‑Fi, 5G, LPWAN), SDK openness, and battery trade-offs. Examples include Oura Ring, WHOOP Strap, and medical products like FreeStyle Libre.
Mobile and cloud implications: Choice affects data models, sync cadence, storage policies, and compliance. Wellness-class products often use relaxed validation, while medical-grade offerings require strict integrity, testing, and regulatory controls.
Sensor Stack and Athlete Metrics That Matter
Good metric design starts with picking sensors that match the training question you want to answer.
Core biosensors capture physiology: optical heart rate for continuous pacing, HRV proxies for recovery, ECG for rhythm checks, SpO2 for oxygen saturation, body temperature trends, and respiration for load.
Motion and biomechanics
Accelerometers and gyroscopes map movement and form. GPS provides speed and distance outdoors. RFID offers low-latency position tracking indoors.
Linking metrics to outcomes
HRV guides recovery windows. Sleep quality affects next-day power and injury risk. Temperature shifts can flag illness or overtraining.
Sampling rates and on-device filtering matter during high movement; validation harnesses improve accuracy.
GPS trades range for latency; RFID gives precise indoor location with lower delay.
Fusing biometric and motion data raises confidence in load, fatigue, and injury estimates.
Consumer and medical products differ in calibration, accuracy targets, and regulatory controls. Iottive builds sensor integrations and validation harnesses to ensure metric accuracy across heart rate, HRV, SpO2, body temperature, respiration, GPS, and RFID.
Metric
Typical Sensor
Key Outcome
Heart rate
Optical HR / ECG
Intensity control, recovery pacing
HRV
RR intervals from optical/ECG
Daily recovery readiness
SpO2
Optical sensor
Oxygen monitoring, altitude adaptation
Motion & biome
Accel + gyro + GPS/RFID
Form analysis, speed, and position
Sleep & temp
Actigraphy + temp sensors
Recovery tracking, illness detection
Connectivity Deep Dive: Why BLE Leads for Sports Wearables
Choosing the right radio and protocol decides whether real-time metrics reach a coach or die in a noisy arena.
Low-energy Bluetooth dominates because it balances power and throughput for continuous heart and motion streams. Many modern devices also include ANT+ for multi-sensor pairing and classic Bluetooth or Wi‑Fi for higher-bandwidth transfers like bulk sync or firmware updates.
Protocol trade-offs in real-world use
Compare options in practice:
Protocol
Strength
When to use
Low-energy Bluetooth
Low power, good latency
Real-time HR/IMU streaming, long sessions
Classic Bluetooth / Wi‑Fi
High throughput
Bulk sync, firmware downloads, cloud uploads
ANT+
Robust multi-sensor broadcast
Broadcasting to head units and multiple receivers
LoRaWAN / LPWAN
Long range, tiny payloads
Endurance tracking, remote asset telemetry
Practical trade-offs for sessions and arenas
High sample rates for HR and IMU need more power. Tune sampling to the training question to preserve battery life.
In crowded RF environments, use adaptive retries, larger MTU sizes, and managed connection intervals to reduce packet loss.
“Reliable pairing and encrypted channels are non‑negotiable when personal health data flows in real time.”
OTA management matters: use staged rollouts over BLE and Wi‑Fi to limit field risk and ensure secure firmware updates.
Iottive optimizes connection intervals, MTU settings, and retry policies as part of multi-protocol development. That tuning balances latency, throughput, and battery so teams get consistent, secure data during training and matches.
From Device to Insight: Data Pipeline Architecture
A clear data pipeline turns raw telemetry into coach-ready insight in seconds. A robust flow maps sampling, preprocessing, transfer, and storage so teams get fast, reliable feedback during training.
On‑device processing, mobile app sync, and edge analytics
Run basic filtering and feature extraction on the hardware to cut bandwidth and latency. Send summarized packets to the app for buffering when the connection pauses.
Edge analytics handles immediate alerts and low-latency coaching cues. The mobile app can host heavier fusion work before cloud ingestion.
Cloud ingestion, secure data storage, and real-time dashboards
Ingest buffered streams into queues and store in time-series stores and feature repositories. Role-based dashboards show live metrics for coaches, players, and admins.
Encrypt in transit and at rest, tokenize sessions, and rotate keys to protect sensitive metrics. Iottive unifies cloud and mobile integration to deliver consistent models and scalable analytics.
OTA updates and firmware management for reliability
Use versioning, delta updates, staged rollouts, and Nordic DFU-style flows to reduce field risk. Plan rollbacks and monitor update success rates.
“Reliable OTA and strong encryption keep real-time streams trustworthy.”
Map end-to-end: sampling → preprocess → transfer → cloud ingestion.
Monitor sync success, crash reports, and degraded streams.
Design dashboards for low-latency monitoring and clear action cues.
AI and AIoT: Personalized Coaching and Injury Prevention
Personalized coaching is shifting from hindsight reports to moment-by-moment guidance. Iottive builds AIoT solutions that fuse heart, motion, and context to provide personalized recommendations and proactive risk alerts.
Adaptive training plans use HRV, heart rate, fatigue markers, and biomechanics to tune load per session. Models interpret HRV trends and motion signatures to suggest training intensity and rest windows.
Early warning and modeling
Impact sensors and IMU streams spot spikes that precede soft-tissue strain or concussion risk. Feature engineering extracts peak acceleration, load symmetry, and fatigue drift. Sleep and stress context raise prediction accuracy.
“Explainable models help coaches trust recommendations and act with confidence.”
Edge models for low latency; cloud for continual learning and model updates.
Fairness and transparency ensure outputs are explainable to users and coaches.
Mental health trends are flagged as guidance, not diagnosis, with recovery protocols suggested.
Capability
Signal
Benefit
Adaptive load
HRV, HR
Safer progression
Strain detection
IMU peaks
Early intervention
Readiness scoring
Sleep + stress
Better session timing
Iottive integrates these AI workflows into mobile and cloud apps with MLOps, monitoring, and secure updates for reliable production development.
Real-Time Game and Training Insights for Coaches and Teams
Coaches need crisp, live feeds to spot fatigue before a player slows down. Low-latency streams let staff act the moment a pattern emerges, not after the match ends.
Live speed, distance, acceleration, and load monitoring
GPS, RFID, and IMU streams combine to show speed, distance, acceleration, and player load. Sewn-in chips and team kits deliver position and peak‑g forces to coach dashboards in seconds.
In-session decisions: substitutions, tactics, and workload balance
Use these metrics to time subs, tweak press intensity, and balance minutes across lines. Clear thresholds and color coding make alerts glanceable during fast play.
Reliability: adaptive retries, antenna placement, and RF zoning reduce packet loss in crowded stadiums.
UI best practices: simple thresholds, big color cues, and one-tap actions for quick decisions.
Privacy: role-based access and consent frameworks keep medical data restricted to staff.
Post-session: export cleaned datasets and sync highlights with video review tools.
Resilience matters: offline caching and eventual sync prevent data loss during connectivity dips. Iottive builds low-latency pipelines and coach-facing apps that prioritize clarity and stable monitoring for real match use cases.
Sports Use Cases Across Levels: Pros, Colleges, and Everyday Athletes
From varsity fields to neighborhood tracks, connected tools are shaping training at every level. Pro leagues pair goal-line sensors and VAR to give referees fast, reliable evidence during high-pressure calls.
Colleges and academies use GPS vests and RFID tags to monitor load, speed, and positional work. Those programs focus on development and injury prevention with daily monitoring and tailored drills.
Consumers rely on rings, smart watches, and bands for health monitoring and daily goals. Products like Apple Watch and Samsung Galaxy Watch offer ECG, SpO2, and GPS. Oura and WHOOP emphasize sleep and recovery, while medical wearables such as FreeStyle Libre and Zio Patch support continuous clinical monitoring.
Integration notes: SDKs from Apple, Garmin, and others shape app strategies. Wellness apps should avoid medical claims unless cleared by regulators.
Grassroots access improves equity — affordable trackers bring pro-level insights to more users.
Pick hardware by sport, age, and competition level: GPS for outdoor team play, IMU for form, rings for sleep focus.
Iottive unifies diverse ecosystems into consistent, scalable apps across pro, college, and consumer tiers.
Level
Common Tools
Primary Benefit
Professional
Goal-line, VAR, GPS vests
Accurate officiating and tactical choices
College/Academy
GPS vests, RFID, IMU
Development insights, injury prevention
Consumer
Rings, watches, bands, medical devices
Daily health monitoring and recovery
Designing the Companion Mobile App Experience
A focused mobile interface helps users glance at readiness and sleep quality without confusion. The companion app should surface key metrics fast and teach what each one means.
Visualizing heart rate, sleep, and training load simply
Show a clear timeline for data heart signals and HRV. Use compact charts for short sessions and exploded views for deep dives.
Keep color, labels, and one-tap tooltips so users interpret sleep quality and load quickly.
Gamification, community, and privacy-first UX
Engagement features like streaks, badges, and leaderboards boost retention. Social feeds and challenges encourage referrals.
Pair those with granular consent screens, easy sharing controls, and simple deletion options to protect user trust.
“Design for quick decisions, clear consent, and gradual learning — users will stick with what feels fair and helpful.”
Onboarding: auto-calibrate sensors, set baselines, and tailor goals with minimal steps.
Accessibility: high contrast, scalable text, and voice support for inclusive use.
Notifications: action-driven prompts, limited frequency, and smart quiet hours.
Modular architecture: iterate on features and experiments without heavy rewrites.
Feature
Benefit
Example Pattern
Heart & HRV view
Instant intensity cues
Mini timeline + peak markers
Sleep quality card
Better recovery decisions
Score + actionable tips
Community challenges
Higher retention
Weekly goals + leaderboards
Security, Privacy, and Compliance in Wearable Data
Protecting personal telemetry starts with simple, enforced controls across transport, storage, and admin tools. Sensitive health streams demand layered defenses from the sensor link to cloud analytics.
Encryption, key management, and access control
Encrypt in transit and at rest using TLS 1.2+/AES-256. For transport over short-range radios, use authenticated pairing and session keys.
Rotate keys, enforce HSM-backed key storage, and require MFA for admin consoles. Role-based access limits who can view raw health records.
Minimization, anonymization, and consent
Store only needed metrics and use deterministic or differential anonymization for analytics. Keep raw PHI separate and tokenized for lookup only when required.
Design consent flows, parental controls, and easy deletion to honor data subject rights under CCPA and similar laws.
“Security-by-design and periodic penetration testing make data protections real, not just policy.”
Control
Best Practice
Benefit
Transport encryption
TLS / Authenticated session keys
Protects streams in transit
Data storage
AES-256 + tokenization
Limits exposure of PII
Admin access
MFA + RBAC + audit logs
Prevents insider misuse
Compliance
HIPAA & CCPA alignment
Reduces legal risk
Iottive implements encryption, anonymization, role-based access, and compliance-ready architectures for both medical devices and wellness products. We run vendor due diligence, build incident response playbooks, and provide breach notification support to keep teams and users safe.
Building Your Wearable Solution: Development Roadmap
Begin by mapping the coach and player journeys, then convert those flows into clear success metrics. Use a short discovery sprint to define target personas, priority use cases, and the minimal set of metrics that prove value.
Discovery, selection, and early planning
Identify which equipment and devices meet your use cases. Score options by accuracy, battery life, SDK maturity, and integration cost.
Deliverables: persona maps, success KPIs, chosen device category, and an MVP scope for app development.
Multi-platform SDK and API strategy
Evaluate third-party SDKs, prefer those with clear docs and stable APIs. Abstract raw streams to a common schema to handle fragmentation across vendors.
Integration patterns and connectivity resilience
Design GATT profiles for compact telemetry and retries for intermittent links. Buffer and sync logic in the app avoids data loss during short dropouts.
QA, release engineering, and cloud scale
Test metric accuracy, end-to-end latency, and battery under real sessions. Build OTA firmware pipelines, mobile CI/CD, and staged rollouts to reduce field risk.
Phase
Primary Outcome
Key Checks
Discovery
Validated use cases & KPIs
Persona tests, success metrics
Integration
Stable multi-vendor sync
SDK evaluation, schema mapping
QA & Release
Reliable in-field behavior
Accuracy tests, latency profiling, OTA success rate
Scale & Governance
Secure, real-time analytics
Schemas, retention, lineage, RBAC
Data governance matters: define schemas, retention, and lineage early to support both real-time and batch analytics. Decide which ML features to build and which to license.
“Ship small, measure fast, and iterate on metrics that drive behavior.”
Iottive offers end-to-end support—from discovery and device selection to SDK/API integration, QA, and scalable cloud analytics—to keep development on schedule and aligned to measurable outcomes.
Monetization and Business Models in Fitness Wearables
Turning sensor streams into steady income starts with a simple value ladder. Offer clear, incremental value so users upgrade when benefits are obvious.
Subscriptions, AI coaching, and B2B partnerships
Subscription tiers work well: free basic metrics, mid-tier recovery insights, and premium AI coaching plus team dashboards.
Positioning tip: sell outcomes — better recovery, lower injury risk, and time saved for coaches.
License dashboards to teams, insurers, or gyms for stable B2B revenue.
Offer data-driven services like benchmarking and predictive maintenance for gym equipment.
Bundle hardware with retail partners or employer wellness programs to widen reach.
“Monetization must map to measurable user value and easy upgrade paths.”
Model
Offer
Success Metric
Subscription
Recovery + AI coaching
ARPU, churn
B2B licensing
Team dashboards
LTV, contract value
Data services
Benchmarking
engagement, referrals
Common hurdles include development costs, privacy compliance, SDK fragmentation, and battery limits. Mitigate these with staged rollouts, strong encryption, API standardization, and careful app development.
Iottive helps teams design pricing experiments, instrument analytics, and attribute revenue to features so product and business decisions stay aligned with real user outcomes in the fitness industry.
Interoperability, Device Fragmentation, and Vendor Lock-In
When products speak different protocols, a clear abstraction layer keeps feature velocity high.
Fragmentation comes from varied radios, SDK quality, firmware cadence, and inconsistent data schemas. Left unchecked, this raises integration costs and risks long-term lock-in.
Best practices to future-proof your stack
API-first design and modular adapters make onboarding new products fast. Normalize incoming streams so analytics and the app see a single schema.
Map fragmentation sources: protocols, SDKs, firmware schedules, and schemas.
Use versioned contracts and tolerant parsers to allow schema evolution without breaking reports.
Favor open standards and document fallbacks for proprietary constraints.
Run contract tests and vendor monitoring to catch regressions early.
Procure with portability clauses to avoid single-vendor reliance and protect data access.
Iottive implements abstraction layers and adapter patterns that let teams support heterogeneous fleets while keeping development pace steady. Roadmaps stay flexible to add rings, smart clothing, or other emerging categories without rework.
“Design for many vendors, not just one — it saves time and protects value.”
Trends to Watch: Smart Clothing, Rings, AR/VR, and Beyond
New form factors—textile sensors, discreet rings, and head-mounted AR—are expanding where and how we capture meaningful body signals. These shifts will change coaching, recovery, and daily monitoring across the fitness industry.
Where the industry is headed next
Smart clothing now captures posture, muscle activation, and form for coaching-grade feedback. Smart rings continue to gain adoption because they work 24/7 and excel at sleep and readiness signals.
AR glasses and VR platforms create guided form correction and immersive classes. These interfaces lift home engagement and add new training contexts for coaches and users.
Sensor miniaturization and battery advances let sensors move to new wear locations with better comfort.
On‑device AI reduces reliance on connectivity and makes real‑time guidance more reliable.
Privacy expectations rise as always-on wearables enter more life contexts.
Integration tips: add new categories with adapter layers, normalize schemas, and validate SDK maturity before wide rollout. Iottive evaluates vendor SDKs, roadmap fit, and total cost of ownership to help teams adopt smart apparel, rings, AR/VR, and other emerging devices without refactoring core systems.
Why Iottive: End-to-End IoT, AIoT, and BLE App Development for Sports
From prototype to global rollout, Iottive guides teams through product development that connects sensors, apps, and cloud analytics. We focus on practical outcomes: reliable telemetry, clear dashboards, and secure data flows for coaches and users.
Our expertise: IoT & AIoT solutions, BLE apps, cloud & mobile integration
Core strengths: BLE app development, multi‑device SDK integrations, and scalable cloud data pipelines that feed real‑time dashboards.
We build OTA firmware pipelines (Nordic DFU patterns), web BLE integrations, and MLOps for AI‑driven personalization.
Industries served and how we deliver secure, real-time data products
We serve Healthcare, Automotive, Smart Home, Consumer Electronics, and Industrial sectors. Our teams ship secure, compliant platforms with encryption, RBAC, and privacy‑first UX.
QA & field testing: sensor accuracy, latency profiling, and battery endurance under real training conditions ensure products work at scale.
Contact
Engagement models: discovery and rapid prototyping, pilot deployments, then global scale‑out with ongoing support.
“Validate your roadmap, scope an MVP, or scale existing products with a partner who knows end‑to‑end integration.”
When telemetry is reliable and fast, training choices shift from guesswork to evidence. Clear, timely data helps coaches, players, and staff see readiness, load, and recovery in the moment.
Recap: sensors, low-latency connectivity, and edge-to-cloud pipelines turn signals into real-time performance insight. The benefits iot shows across pro, college, and consumer fitness include better training decisions, faster recovery plans, and safer play. Iottive supports end-to-end delivery of secure, real-time products.
Take a look at interoperability to avoid vendor lock-in as new devices and technology arrive. Prioritize privacy-first UX, strong encryption, compliance readiness, and robust OTA management. Define top use cases and success metrics before choosing SDKs.
Business models like subscriptions, AI coaching, and B2B services sustain growth when backed by accurate, timely analytics. Contact Iottive for a discovery session and technical assessment: www.iottive.com | sales@iottive.com.
FAQ
What metrics do modern wearables track for sports and health?
Modern trackers capture heart rate, heart rate variability (HRV), ECG, SpO2, skin temperature, and respiration. They also record motion data with accelerometers and gyroscopes, GPS for speed and distance, and sleep stages to assess recovery. These signals help coaches and users monitor training load, fatigue, and overall well‑being in real time.
How does Bluetooth Low Energy compare to Wi‑Fi or ANT+ for real‑time sports use?
Bluetooth Low Energy (BLE) balances low power draw with sufficient data throughput and device compatibility, making it ideal for continuous heart rate and sensor sync during activity. Wi‑Fi offers higher bandwidth but drains batteries faster. ANT+ is reliable for some sports sensors but has narrower ecosystem support. BLE’s ubiquity in phones and companion apps is a major advantage.
How accurate are heart rate and HRV readings from wrist sensors?
Optical heart rate sensors perform well for steady-state exercise and daily monitoring but may lose accuracy during very high‑intensity, rapid wrist movement. Chest straps and ECG-capable wearables deliver higher precision. For HRV, on-wrist readings are useful for trends and recovery guidance, while clinical-grade ECG remains the gold standard for diagnostics.
Can these systems provide real‑time coaching and injury risk alerts?
Yes. With on‑device processing and edge analytics, systems can deliver adaptive training cues and flag early signs of injury risk using patterns in HRV, load, and biomechanical data. AI models analyze trends and trigger alerts or modified plans in the companion mobile app for coaches and athletes.
What is the typical data flow from sensor to dashboard?
Data usually flows from the sensor to a paired smartphone via BLE, where initial processing and buffering occur. The app syncs with cloud services for further analytics, long‑term storage, and dashboard visualization. Secure APIs enable real‑time dashboards for teams and OTA updates to manage firmware.
How is user data secured and what compliance should I consider?
Secure implementations use encryption in transit (TLS) and at rest, role‑based access control, and anonymization for analytics. For medical or quasi‑medical features, HIPAA and local privacy laws like CCPA must be considered. Regular audits and strong key management reduce breach risk.
What are best practices to maximize battery life without losing essential data?
Balance sampling rates and on‑device processing: perform initial feature extraction on the sensor, batch sync to the phone, and use event‑driven high‑rate sampling only when needed. Optimize BLE connection intervals and enable adaptive sensing profiles for different activity modes.
How can app builders support multiple vendor products and avoid lock‑in?
Use vendor SDKs and open standards where possible, design a modular SDK/API layer, and implement a device abstraction that normalizes sensor outputs. This lets you add new hardware without heavy rework and reduces vendor dependency over time.
Are these wearables suitable for clinical monitoring or medical use?
Many consumer products provide wellness insights but are not medical devices. For clinical use, choose FDA‑cleared or CE‑marked hardware and follow regulatory requirements for data handling, validation, and reporting. Medical deployments usually require stricter accuracy, documentation, and privacy controls.
What analytics and AI features deliver the most value to athletes and teams?
Useful features include personalized training plans based on HRV and recovery, fatigue prediction, workload balancing, and biomechanical risk detection. Visual dashboards with live metrics like speed, acceleration, and load help coaches make in‑session decisions and substitutions.
How do you validate sensor accuracy and system latency before launch?
Conduct lab and field tests comparing sensors to reference instruments (ECG, spirometers, motion capture). Measure end‑to‑end latency from sensing to dashboard and test across network conditions. Run user trials to evaluate real‑world performance and battery impact.
What monetization models work best for companion apps?
Successful models include subscription tiers for advanced coaching, paywalled analytics dashboards for teams, one‑time hardware bundles with premium app features, and B2B partnerships with clubs or health providers. Data‑driven services and AI coaching often drive recurring revenue.
How can developers ensure good UX for visualizing heart rate and sleep data?
Prioritize clear, concise visuals with trend indicators and actionable advice. Use color and simple thresholds to show zones (rest, aerobic, peak). Offer summaries and deep dives, let users customize goals, and keep privacy settings prominent and easy to manage.
What trends should product teams watch for in the next 2–3 years?
Expect growth in smart clothing and rings, tighter AR/VR integrations, improved on‑device AI for faster insights, and broader interoperability standards. Advances in low‑power sensors and biometric accuracy will expand use cases for both elite sports and everyday wellness.