How Iottive Outage Detection Systems Enable Instant Fault Localization in Smart Grids

A neighborhood can go from normal to tense in seconds when the lights drop. Stores pause card readers, traffic signals blink, and phones light up with the same question: “How long will this take?” In that moment, grid reliability feels personal, and customer trust starts to slip with every minute.

Utilities face the same clock, but with higher stakes. Crews need more than a rough outage map—they need real-time outage alerts that point to the likely fault location, fast. That is the difference between a broad patrol and a targeted fix, especially across complex smart grids in the United States.

Outage Detection Systems, Smart Energy Solution, Instant Outage Detection

This is where Iottive brings a connected-operations model to outage detection systems. By linking field devices at the edge with edge-to-cloud analytics, operators can move from “something is out” to instant fault localization in minutes, and often seconds. The same loop supports cloud dashboards for system-wide visibility, mobile access for field coordination, and OTA updates that keep devices current without rolling trucks.

In practice, outage detection becomes an operations problem, not just a hardware install. Fast sensing, fast analytics, and secure alert delivery work together so teams can isolate issues, reduce risk, and restore service with confidence. And when local networks degrade during major events, resilient, cellular-based notification paths help keep critical signals moving.

Across the next sections, you will see why instant detection matters in U.S. operations, how a smart energy solution turns grid events into clear actions, what architecture supports low-latency decisions, and how connectivity strategies protect awareness when networks fail.

Key Takeaways

  • Iottive combines edge devices, cloud dashboards, mobile visibility, and OTA updates into one operating loop.
  • Real-time outage alerts reduce guesswork and speed safe, targeted dispatch.
  • Edge-to-cloud analytics helps pinpoint faults quickly for instant fault localization.
  • Grid reliability improves when detection, analysis, and response are coordinated in seconds.
  • A smart energy solution must stay resilient when local connectivity drops during disruptions.
  • Over-the-air improvements let utilities scale fixes across fleets without delays.

Why Instant Outage Detection Matters for Smart Grids in the United States

In many regions, U.S. smart grid outages are no longer rare events. They are part of routine planning, especially when reliability targets stay high and patience runs thin.

Instant detection helps utilities act with clarity instead of guesswork. It also helps customers understand what’s happening when the lights go out and time suddenly matters.

How severe weather and grid complexity increase outage risk and restoration pressure

Severe weather outages can move fast and hit wide areas at once. Wind, ice, heat, and flooding push the system past normal limits, raising outage risk on both transmission and distribution lines.

At the same time, grid complexity keeps rising. More sensors, more distributed energy, and more automated switching can improve performance, but they also add more states to interpret under operational pressure.

When alarms stack up, every minute counts toward utility restoration time. Instant detection shortens the time between a fault and a safe, targeted response.

What “reliable outage alerts” prevent in real operations, from equipment damage to service disruption

A fast, reliable outage notification is not just about convenience. It reduces avoidable losses like food spoilage in freezers, damage to sensitive IT equipment, and safety risks when buildings sit dark and unattended.

Alerts also need to keep working during the blackout itself. When power fails, home Wi‑Fi often fails too, so resilient signaling becomes part of service continuity for customers and a planning constraint for utilities.

For operations teams, trustworthy alerts can reduce repeat truck rolls and limit unnecessary switching. That matters when call volume spikes and crews are stretched across multiple circuits.

Operational moment What can go wrong without instant detection What instant detection supports
Storm-driven feeder trips during severe weather outages Higher outage risk from delayed isolation and cascading interruptions Faster triage that limits spread and protects service continuity
Customer reporting during U.S. smart grid outages Conflicting reports and slow outage notification, increasing uncertainty Verified alerts that align field response with actual grid state
Network disruption after power loss Loss of local Internet signals, extending utility restoration time Resilient alert delivery even when Wi‑Fi drops
Mixed assets and switching paths from grid complexity Longer diagnosis cycles and more operational pressure on operators Cleaner fault boundaries to support safer, targeted dispatch

Why speed to locate faults is the key driver of customer impact, safety, and utility performance

Fault location speed shapes almost every outcome people care about. It influences how long customers sit without heat or cooling, how long critical loads run on backup, and how quickly crews can move from patrol to repair.

In safety-critical systems, decisions often happen in fractions of a second because raw signals get turned into an actionable model. On the grid, faster fault localization reduces time spent in unstable conditions and lowers exposure for lineworkers near damaged equipment.

Speed also has to be dependable. Redundancy, rigorous validation, and secure authenticated updates help keep automated decisions trustworthy when the system is under stress and operational pressure is at its peak.

Outage Detection Systems, Smart Energy Solution, Instant Outage Detection

Modern outage detection systems work best when they act like one connected nervous system. With Iottive’s approach, BLE-enabled edge devices watch local power conditions, then pass clean signals upstream for fast action. That stack supports a smart energy solution that reduces guesswork when the grid gets noisy.

instant outage detection

How edge sensors, gateways, and cloud analytics work together to detect and pinpoint faults fast

At the edge, edge sensors capture voltage loss, restore events, and rapid changes that often precede a trip. Nearby IoT gateways collect those readings, time-sync them, and keep traffic light so it moves even in constrained field networks.

From there, cloud analytics compares patterns across feeders and devices to separate a single fault from a wider disturbance. That correlation speeds fault pinpointing because operators see where the first loss occurred and how the event propagated.

How instant notifications enable rapid switching, isolation, and targeted dispatch

Instant outage detection is only useful if the message reaches the right person fast. Iottive-style devices that plug into power can alert the moment service drops and again when power is restored, using text messages or phone calls to cut delay.

Those real-time alerts support rapid switching and isolation because crews are not dispatched blind. The same notifications help supervisors assign the closest truck to the narrowed location, instead of sending a wide patrol.

How edge-to-cloud visibility turns raw grid events into actionable decisions in seconds

When telemetry streams into operational dashboards, teams can watch status changes live and confirm what is still energized. Mobile apps extend that view to field leaders, so switching plans and safety checks stay aligned with the latest signals.

Over time, synchronized data builds actionable grid intelligence. Teams can review anomalies, validate assumptions, and refine detection logic using the same edge-to-cloud trail that drove the initial response.

Layer Primary role in the stack What it delivers to operators
BLE-enabled edge devices Detect local loss/restore and fast electrical changes at the source Clean event markers that reduce uncertainty during first response
IoT gateways Aggregate, time-sync, and forward telemetry from many endpoints Consistent signals that support fast correlation across a circuit
Cloud analytics Fuse events, compare patterns, and flag likely fault zones Accelerated fault pinpointing instead of broad “area outage” assumptions
Operational dashboards and mobile apps Visualize live status and push workflows to the field Shared situational awareness that turns alerts into coordinated action

Architecture: Edge Sensors, Cloud Dashboards, and Over-the-Air Updates for Grid Reliability

Reliable outage response starts with a clear division of labor between devices in the field and tools in the control room. In Iottive deployments, local intelligence handles time-critical signals, while centralized views help teams act with shared context. That split keeps decisions fast, coordinated, and consistent across the grid.

edge compute

Edge compute for low-latency detection when every second counts

With edge compute, sensors and gateways can flag abnormal current, voltage, or breaker behavior right where it happens. That local logic supports low-latency outage detection even when backhaul links are congested. It also reduces noise, since only high-value events and summarized telemetry need to travel upstream.

Local decisions help operators isolate likely fault zones sooner, instead of waiting for a full cloud round trip. That speed matters when switching actions and crew dispatch depend on minutes, not hours.

Cloud dashboards for system-wide situational awareness and operational triage

Cloud dashboards turn streaming device data into a single operational picture across feeders, substations, and edge endpoints. That view strengthens situational awareness by showing what changed, where it changed, and what else is affected. It also supports utility operations triage, so teams can prioritize the biggest customer impact and the most urgent safety risks first.

When event timelines, device health, and alarm states live in one place, dispatch and engineering can work from the same facts. That reduces back-and-forth calls and speeds up coordinated switching plans.

Over-the-air firmware and configuration updates to roll out fixes and improvements fleet-wide

Modern grid devices cannot rely on truck rolls for every improvement. OTA firmware updates let utilities deploy detection-rule refinements, bug fixes, and performance tuning as fleet-wide updates, with controlled scheduling and audit trails. Good configuration management keeps settings consistent across territories while still allowing site-specific parameters when needed.

For secure updates, best practice includes cryptographic signing of update packages, verification before install, and secure boot checks that prevent tampered code from running. That protects reliability and helps avoid unsafe or unapproved configurations after an update window.

Mobile access for field crews and operators to coordinate response from anywhere

Mobile operations extend the same event context to crews in trucks and supervisors in the field. Alerts, device status, and work notes can travel with the responder, so decisions do not stall when people leave the control room. With role-based access, teams can review changes tied to configuration management and confirm whether recent updates align with the current operating state.

Architecture layer Primary job in outage response What operators gain day-to-day Security and integrity focus
Field devices with edge compute Detect local anomalies and trigger low-latency outage detection at the source Faster alerts, fewer false alarms, clearer fault boundaries Hardened device identity and integrity checks before actions execute
Cloud dashboards Aggregate telemetry for situational awareness and utility operations triage across many assets Unified timelines, cross-asset correlation, priority-based dispatch Access controls, logging, and protected data flows for operational visibility
OTA firmware updates and configuration management Deliver reliability fixes and policy changes as fleet-wide updates without truck rolls Consistent behavior across devices, faster rollout of improvements Cryptographic signing, validation gates, and secure updates to block tampering
Mobile operations tools Keep crews synced with alarms, device status, and restoration steps from anywhere Fewer delays, clearer handoffs, faster confirmations in the field Authenticated sessions and least-privilege access to prevent unsafe changes

Instant Fault Localization Workflows in Smart Grid Operations

In smart grid operations, speed depends on a clear fault localization workflow that moves from signal to action without guesswork. When a device reports loss of voltage, abnormal current, or a breaker trip, alerts land in the control room fast. That first ping sets the outage response process in motion, with time-stamped context operators can trust.

fault localization workflow

Triage is where teams stop chasing noise. Dashboards roll up alarms by feeder, segment, and device health so operators can narrow the fault zone and reduce false calls. With incident logging in place, each event keeps its chain of evidence, from the first alert to the last operator note.

From there, decisions turn into coordinated work. Control-room switching plans guide isolation and switching so healthy sections stay energized while crews focus on the likely faulted span. Targeted dispatch improves safety and pace because trucks roll with a location, recent readings, and a short list of probable causes.

Verification closes the loop in real time. As voltage returns and readings stabilize, restoration confirmation messages help operators verify service is back on the right devices and the right customers. Operational playbooks also define what to do when data conflicts, such as when a meter shows power but a line sensor still flags an anomaly.

Improvement happens after the lights are on, not months later. With Iottive-style telemetry feeding reports, teams can review timing, device behavior, and crew actions to tune alert thresholds and refine the outage response process. Over-the-air changes can then standardize the updated fault localization workflow across the fleet while incident logging preserves traceability for audits and training.

Loop Step Operator View in Smart Grid Operations Field and Control Actions Data Captured for Incident Logging
Detect Loss-of-power and abnormal readings grouped by feeder and time Acknowledge alerts; validate signal quality before escalation Event timestamp, device ID, last-good reading, alert type
Decide Mapped fault zone with impacted devices and likely upstream point Choose isolation and switching steps; set targeted dispatch priority Decision notes, priority level, affected segments, assumptions used
Act Switching status and crew progress tracked against the outage response process Remote switching where allowed; field isolation, patrol, and repair Switch operations, crew arrival time, hazards observed, work orders touched
Verify Restoration confirmation signals across sensors and downstream devices Confirm backfeed risk cleared; validate readings stay stable under load Restore time, voltage stability window, exceptions, customer call trends
Improve Trends that show repeat faults, slow handoffs, or noisy devices Update operational playbooks; adjust thresholds; apply OTA configuration Root-cause tags, rule changes, before/after performance, training notes

Connectivity and Resilience When Networks Fail

Smart grid alerts only help if they arrive during the hardest moments. When a feeder drops or a storm hits, local broadband can go dark fast. That is why resilient connectivity has to be designed in, not added later.

resilient connectivity

Utilities also need signals they can trust at scale, from a single meter to a whole county. The goal is simple: get clear, time-stamped events without delay, even when normal paths fail.

Why “no Wi‑Fi required” alerting models matter during outages when local Internet drops

Outage conditions create a basic problem: when power fails, Wi‑Fi will too. If alerts depend on a home router, they may vanish right when crews need them most. That is why no Wi‑Fi outage alerts are built to bypass local Internet entirely.

In practice, this supports faster triage and fewer blind spots. It also reduces confusion for customers who assume “no internet” means “no reporting,” even though the grid still needs status signals.

Using cellular networks for reliable outage notifications and restoration confirmations

Cellular outage notifications keep flowing when Wi‑Fi is down, because the device can send events over the carrier network. Many systems can notify stakeholders by text, voice, or email, and some models treat email as a free channel. With unlimited phone numbers, operations teams can notify dispatch, supervisors, and critical facility contacts without rationing recipients.

Modern cellular IoT options like eMTC and NB‑IoT are designed for wide coverage and long device life. eMTC is positioned for nationwide reach in the United States, while both approaches target deployments that can run for 10+ years, and often closer to 20+, with careful power design. That long runway supports consistent restoration confirmation messaging, not just first-alert reporting.

Design need What it looks like in the field Why it helps during major incidents
no Wi‑Fi outage alerts Device reports without relying on local routers or broadband Keeps event visibility when premises Internet drops after a power interruption
cellular outage notifications Text or voice alert paths ride the carrier network Delivers updates to broad call trees, even when neighborhoods lose Internet
NB‑IoT Cellular IoT mode tuned for coverage and low power Improves reach in challenging locations while supporting long service life
eMTC Cellular IoT mode positioned for full U.S. coverage Supports consistent alerting across large territories and mixed terrain
restoration confirmation Clear “power restore” event sent after service returns Reduces repeat truck rolls and helps close tickets with verified status

Defense-in-depth reliability: redundancy, health monitoring, and secure alert delivery

Resilience also depends on defense-in-depth. That means redundancy across alert paths, plus health monitoring that watches signal strength, latency, and missed check-ins. When a device trends toward poor reception, teams can correct placement or antennas before the next storm.

Secure alert delivery is part reliability and part security. Encrypted links protect event data in transit, while signed firmware helps ensure only authenticated updates run on the device. Similar to network segmentation and intrusion detection in enterprise systems, these controls reduce the risk that a compromised update degrades outage detection performance.

Reliable systems also show discipline at the factory. Practices like 100% burn-in testing, a functional test that can run up to 30 minutes before shipping, and strict screening for low signal quality turn “should work” into “does work.” That operational rigor supports consistent alerts for both power interruption and power restore events.

Conclusion

Smart grids in the United States cannot rely on slow, manual checks when the lights go out. Utilities need instant outage detection and tight fault localization to cut risk, limit damage, and restore service fast. Outage detection systems that surface clear, verified events help operators act with confidence under pressure.

The Iottive smart grid model ties together edge devices, gateways, cloud dashboards, and mobile access so teams see the same facts at the same time. This smart energy solution turns field signals into prioritized actions, from isolation to targeted dispatch. With this workflow, crews spend less time searching and more time fixing.

Grid resilience is also about staying online when local networks fail. “No Wi‑Fi required” design and cellular alerts keep outage notifications and restoration confirms moving even when cable and fiber are down. That continuity supports safer switching, better coordination, and fewer blind spots during storms.

Finally, performance should improve as the grid grows more complex. Secure, authenticated OTA updates and fleet-wide configuration control keep outage detection systems current without waiting for truck rolls. Telemetry and event history sharpen settings over time, so instant outage detection and fault localization stay dependable season after season.

FAQ

What does Instant Outage Detection mean in a U.S. smart grid?

Instant Outage Detection means the grid recognizes a power interruption and pushes an alert within seconds, not minutes. It combines fast sensing at the edge, rapid analytics, and immediate notification so utilities can start isolation and restoration with minimal delay.

How does Iottive support end-to-end outage detection and faster fault localization?

Iottive applies an end-to-end IoT platform model that links BLE-enabled edge devices, IoT gateways, mobile apps, and cloud dashboards. Telemetry streams from the field to the cloud for real-time visualization, while mobile visibility and over-the-air (OTA) updates keep operations fast, coordinated, and continuously improving.

Why is instant detection an operations problem, not just a hardware problem?

Outage performance depends on a full loop: fast sensing, fast analytics, fast alerting, and fast configuration changes at scale. Hardware detects signals, but operations turn signals into decisions, dispatch, switching actions, and verified restoration across thousands of devices.

Why does Instant Outage Detection matter more in the United States?

Severe weather and storm-driven disruptions are common, and reliability expectations are high. Faster detection and pinpointing reduce restoration time and help utilities manage pressure on crews, control rooms, and customer communications during widespread events.

What real-world losses do “reliable outage alerts” help prevent?

They help limit costly damage and safety risks, including food spoilage in freezers, harm to sensitive IT equipment, and broader property safety concerns when people are away. The faster the alert, the faster customers and operators can act.

Why is speed-to-locate faults such a critical safety and performance factor?

Modern safety-critical systems reduce risk by turning raw signals into an actionable model in fractions of a second. In grid terms, faster fault localization reduces time exposed to unsafe conditions, supports safer field operations, and improves utility performance through quicker isolation and targeted dispatch.

How do edge sensors, gateways, and cloud analytics work together to pinpoint faults?

Edge sensors capture local conditions and events, gateways aggregate and forward synchronized telemetry, and cloud analytics correlate signals across assets. That end-to-end view reduces “area outage” uncertainty and accelerates fault detection and pinpointing at feeder and segment levels.

What role does edge compute play when every second counts?

Edge compute enables low-latency decisions without waiting on cloud round-trips. Local processing can trigger immediate outage signals and reduce time-to-alert, which helps utilities move faster on switching, isolation, and crew dispatch.

How do cloud dashboards improve outage triage?

Cloud dashboards aggregate events into a system-wide operational picture. Operators can visualize streaming telemetry in real time, prioritize affected segments, reduce false alarms, and coordinate response across many assets instead of troubleshooting one site at a time.

How do instant notifications translate into faster restoration work?

Instant notifications give operators early confirmation of power loss and context to narrow where it occurred. That supports rapid switching and isolation, plus targeted dispatch so crews arrive with clearer fault location, fewer blind checks, and safer conditions.

What does the Iottive “edge + cloud + OTA + mobile app” operational loop look like in practice?

Devices detect and stream signals, cloud analytics and dashboards clarify what is happening, mobile apps deliver visibility to teams in the field, and OTA updates roll out improvements at fleet scale. The loop supports a “detect → decide → act → verify → improve” workflow designed for decisions within seconds.

Why must outage alerting work when local Internet fails?

Because when power fails, Wi‑Fi will too. If alerting depends on local routers or broadband, notifications can disappear during the very moment they are needed most, delaying restoration and increasing operational risk.

How do “no Wi‑Fi required” models keep notifications flowing during blackouts?

They rely on independent connectivity, most often cellular, so the alert path does not collapse with local power. This design keeps outage awareness dependable for utilities and customers during widespread failures.

What cellular options support resilient outage notifications in the field?

Cellular-based devices can send notifications through text message or calls even during outages. Modern IoT cellular technologies such as eMTC and NB‑IoT are designed for wide coverage and long device life, with claims of 10+ years (likely 20+) depending on duty cycle and network conditions.

What kinds of notifications can an instant outage model deliver?

It can alert on both power interruption and power restore events. Common delivery options include text, voice calls, and email, with some implementations supporting free email alerts and unlimited phone numbers so stakeholders stay informed during large incidents.

Why are OTA updates essential for outage detection systems at scale?

OTA updates let utilities roll out detection-rule improvements, configuration changes, and reliability fixes across a deployed fleet without truck rolls. That fleet-wide control helps systems improve over time instead of drifting into inconsistent settings and missed events.

What security controls should protect OTA firmware and configuration updates?

Strong programs use cryptographic signing for OTA packages, authenticated update flows, and secure boot concepts to prevent unsafe or malicious configurations. These controls protect outage detection integrity and reduce the risk of compromised updates affecting restoration decisions.

What is “defense-in-depth” for outage detection and alert delivery?

Defense-in-depth layers protections such as encrypted communications, signed firmware, segmentation concepts, redundancy, and continuous health monitoring. The goal is to keep detection accurate and alerts trustworthy even when networks degrade or systems are under stress.

What reliability practices matter for dependable outage alert devices?

Operational reliability is earned through quality controls like 100% burn-in testing, a functional test before shipping (up to 30 minutes), and strict attention to signal strength with rejection of units that show low signal quality. Those practices reduce field failures and improve alert delivery during real outages.

How does mobile access change outage response for operators and field crews?

Mobile apps provide anywhere visibility to outage events, restoration confirmations, and device status. That supports faster coordination, safer field decisions, and consistent execution when teams are spread across a service territory.

How does telemetry help utilities improve outage detection over time?

Streaming, synchronized telemetry supports auditing anomalies, validating assumptions, and refining detection logic based on real incidents. Logs and traceability improve accountability, while dashboards and OTA updates enable rapid iteration after each event.

How Iottive Delivers End-to-End Smart Monitoring Solutions for Electrical Utilities


1. Grid Strategy & Solution Design

Iottive collaborates with electrical utility providers, grid operators, substation managers, and digital transformation teams to understand challenges across power transmission and distribution networks.

This phase focuses on:

  • Power loss, cable faults, and grid reliability issues
  • Transformer failures and substation monitoring gaps
  • Regulatory compliance and outage management

We design a custom IoT & AIoT-based electrical monitoring architecture, including:

  • Sensor selection: voltage, current, temperature, load, vibration
  • Smart meter and feeder monitoring design
  • AI-driven fault and anomaly detection models
  • KPI definition: outage reduction, energy efficiency, fault detection time, asset uptime

2. Smart Systems Engineering & Grid Integration

Iottive engineers scalable Smart Electrical Monitoring systems by integrating:

  • IoT sensors for transformers, feeders, and substations
  • Smart meters and energy monitoring devices
  • Edge computing gateways for real-time processing
  • Firmware-enabled monitoring units
  • Cloud platforms with AI analytics

We ensure seamless integration with:

  • SCADA systems
  • Energy Management Systems (EMS)
  • Distribution Management Systems (DMS)
  • Utility dashboards and billing systems

This enables:

  • Real-time grid visibility
  • Secure and continuous data flow
  • Centralized monitoring of distributed electrical infrastructure

3. Pilot Deployment Across Grid Infrastructure

Before large-scale rollout, Iottive deploys pilot solutions across selected electrical infrastructure, such as:

  • Substations and transformers
  • Distribution feeders
  • Industrial power networks
  • Urban and rural utility grids

Pilot testing includes:

  • Real-time fault detection systems
  • Load and energy consumption monitoring
  • Transformer health and temperature monitoring
  • Edge analytics for outage prediction
  • Remote grid telemetry systems

Utilities can validate:

  • Fault detection accuracy
  • System stability
  • Operational impact
  • Integration feasibility

4. Grid Intelligence & Operational Monitoring

Iottive develops smart dashboards and electrical intelligence platforms providing:

  • Real-time voltage, current, and load monitoring
  • Fault detection and outage alerts
  • Transformer health and performance insights
  • Energy consumption analytics
  • Grid load balancing visibility
  • Predictive maintenance alerts

With AIoT analytics, mobile apps, and web dashboards, utility teams can:

  • Detect faults before outages occur
  • Reduce downtime and energy losses
  • Improve grid reliability
  • Optimize load distribution

5. Enterprise Rollout & Utility Scale-Up

From pilot to full deployment, Iottive supports:

  • Cloud scalability for utility data platforms
  • Edge device and firmware management
  • Secure infrastructure monitoring
  • Multi-region grid deployment

Solutions are designed for:

  • Power transmission networks
  • Distribution utilities (urban & rural)
  • Smart grid infrastructure
  • Renewable energy integration

Continuous optimization is enabled through AI-driven insights and predictive analytics.


Why Electrical Utilities Choose Iottive

  • Proven expertise in IoT & AIoT-based electrical monitoring solutions
  • Deep understanding of grid infrastructure, substations, and distribution systems
  • Seamless integration with SCADA, EMS, and utility platforms
  • Secure, scalable, and production-ready architectures
  • Strong focus on outage reduction, efficiency, and grid reliability

Contact Us: sales@iottive.com

Why Retail Refrigeration Failures Cause Major Losses & How Iottive Predictive Maintenance Prevenent

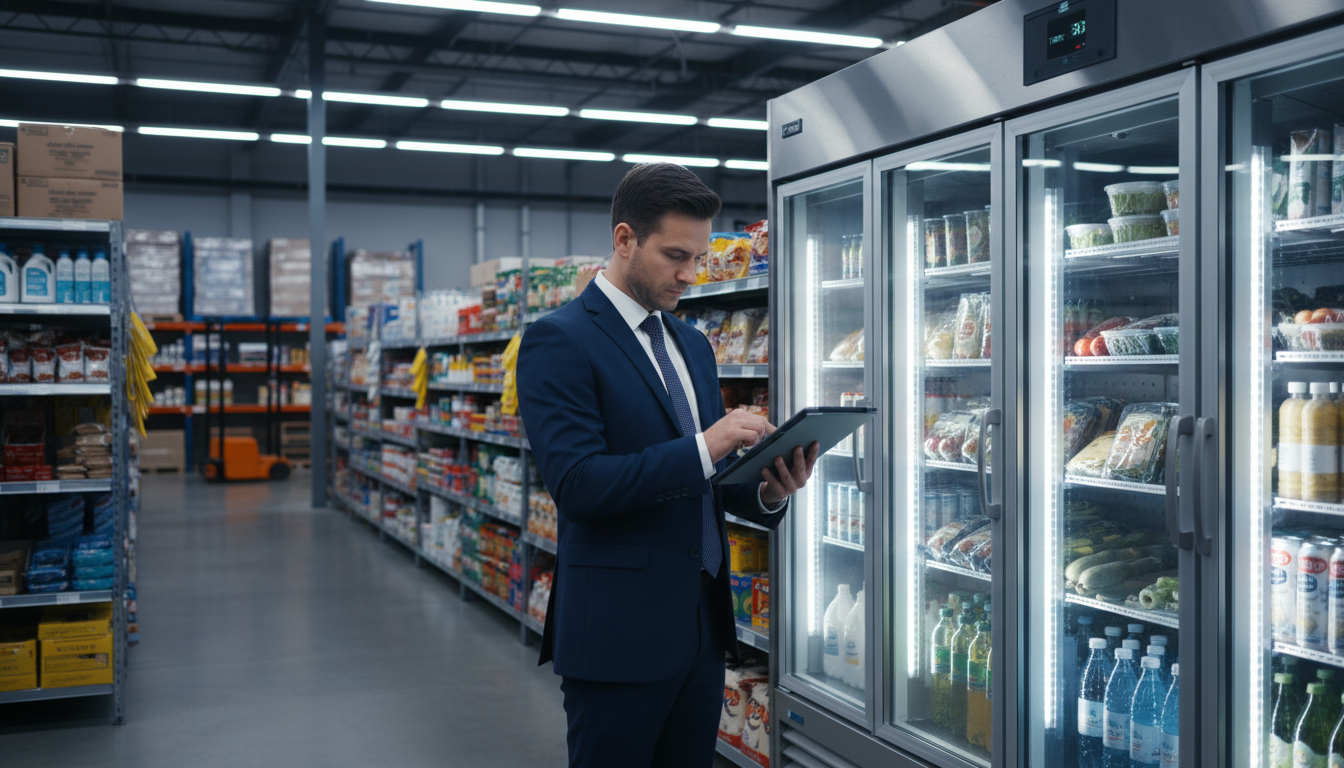
It’s 6 a.m. when the store manager walks into the frozen food aisle. The compressor hums quietly, but the display case feels warm. By noon, thousands of dollars in ice cream, frozen meals, and specialty items are ruined. Emergency repair crews arrive too late, and customers leave disappointed.

This scenario plays out across thousands of grocery stores, supermarkets, and convenience outlets every week. Retail refrigeration failures drain billions annually through spoiled inventory, compliance violations, and lost shopper trust. Traditional approaches to equipment failure prevention simply react after damage occurs.

commercial refrigeration monitoring system

Industry leaders like Amazon and Walmart recognize this vulnerability. They’ve invested heavily in smart retail technology and commercial refrigeration monitoring to protect their operations. Now, businesses of all sizes can access this same protection.

Iottive delivers enterprise-level safeguards through advanced IIoT sensors combined with predictive analytics. The platform tracks temperature, vibration, and performance patterns continuously. Edge analytics spot tiny anomalies and trigger alerts long before a unit fails, transforming refrigeration from hidden risk into controlled asset.

Key Takeaways

  • Refrigeration breakdowns cost billions annually through spoiled inventory and emergency repairs
  • Traditional reactive approaches leave stores vulnerable to catastrophic equipment failures
  • Connected sensors provide real-time visibility into cooler and freezer performance
  • Early warning systems detect problems before breakdowns occur, enabling scheduled fixes
  • Leading companies invest in monitoring technology to protect products and customer satisfaction
  • Modern platforms make enterprise-level protection accessible to operations of all sizes

The Hidden Crisis: Retail Refrigeration Failures Cost Billions Annually

Retail refrigeration failures constitute an underestimated threat that drains billions from the industry annually through spoilage, downtime, and emergency interventions. These refrigeration-dependent operations face mounting pressure as equipment ages and operational demands increase. Without real-time monitoring capabilities, retailers operate in the dark until catastrophic failures force immediate action.

The problem extends beyond isolated incidents. Equipment breakdowns create ripple effects that impact product quality, customer satisfaction, and bottom-line profitability. Most retailers lack the visibility needed to detect small issues before they escalate into major system failures.

Traditional maintenance approaches leave critical gaps in protection. Reactive strategies guarantee maximum losses, while scheduled maintenance misses developing problems between service intervals. This vulnerability exposes retailers to unnecessary risk and preventable financial damage.

Understanding the Massive Infrastructure Investment at Risk

The scale of commercial cooling systems in retail environments represents a staggering capital investment. A typical grocery store operates between 20 and 40 separate refrigeration units across various departments. These include walk-in coolers, reach-in refrigerators, display cases, and dedicated cold storage facilities.

Multi-location retail chains manage thousands of critical cooling assets simultaneously. The total equipment value can reach millions of dollars for regional operators and tens of millions for national chains. This infrastructure requires constant performance optimization to deliver acceptable return on investment.

Each refrigeration unit serves as a critical point of failure. When one system goes down, it threatens the inventory it protects and creates operational disruptions throughout the store. Retail equipment downtime in refrigerated sections directly impacts the most profitable departments where margins on fresh and frozen products drive overall store performance.

The dependency on these systems makes equipment reliability non-negotiable. Retailers cannot afford extended outages in refrigerated sections without significant product loss and revenue impact. Yet many organizations still lack the monitoring infrastructure to protect these valuable assets effectively.

Technical Breakdown: What Actually Causes Equipment to Fail

Refrigeration system failures stem from multiple technical and operational factors. Understanding these equipment failure causes enables better prevention strategies. The most common failure modes each carry distinct warning signs that predictive systems can detect.

Compressor degradation represents the most expensive failure type. Inadequate maintenance allows wear and contamination to reduce compressor efficiency until complete failure occurs. This single component often accounts for 40-50% of total system replacement cost.

Refrigerant leaks develop from corrosion, vibration, or connection failures. These leaks gradually reduce cooling capacity before causing complete system shutdown. Even small leaks compromise temperature control and energy efficiency long before they become obvious.

Additional maintenance challenges include:

  • Condenser coil fouling that blocks heat transfer and forces systems to work harder
  • Evaporator fan motor failures that prevent proper air circulation
  • Thermostat malfunctions that create temperature swings and product damage
  • Door seal deterioration that allows warm air infiltration and frost buildup
  • Electrical component breakdowns in control boards and contactors

Each failure mode connects to specific operational triggers. Deferred maintenance allows preventable problems to worsen. Environmental stress from extreme weather or poor ventilation accelerates component wear. Equipment age naturally increases failure probability as parts reach end of service life.

Operational overload also contributes significantly. Commercial cooling systems pushed beyond design capacity experience accelerated degradation. Overloaded units run longer cycles with inadequate rest periods, leading to premature component failure.

Failure Type Primary Cause Warning Signs Average Downtime
Compressor Failure Wear, contamination, inadequate lubrication Unusual noise, reduced cooling, increased runtime 4-8 hours
Refrigerant Leak Corrosion, vibration, connection failure Gradual temperature rise, frost patterns, hissing sounds 2-6 hours
Condenser Issues Dirt accumulation, blocked airflow High discharge pressure, frequent cycling 1-3 hours
Fan Motor Failure Bearing wear, electrical problems Poor air circulation, temperature stratification 2-4 hours
Control System Fault Sensor failure, wiring issues, board damage Erratic operation, incorrect readings, alarms 1-5 hours

retail equipment downtime caused by refrigeration system failures

The Critical Flaws in Conventional Maintenance Strategies

Traditional maintenance approaches fundamentally fail to prevent costly refrigeration system failures. These outdated methods leave retailers vulnerable to unexpected breakdowns despite regular service investments. The gap between conventional practices and actual equipment needs creates unnecessary risk.

Reactive maintenance represents the worst-case scenario. This “fix it when it breaks” approach guarantees maximum retail equipment downtime and product loss. Emergency service calls typically cost 150-300% more than scheduled maintenance due to after-hours premiums and rush parts ordering.

Time-based preventive maintenance offers improvement but still falls short. Scheduled service occurs at fixed intervals regardless of actual equipment condition. This approach wastes resources on unnecessary service while missing problems that develop between scheduled visits.

The core problem is lack of visibility. Maintenance teams operating without real-time performance data cannot distinguish healthy equipment from units approaching failure. They rely on inspection snapshots that miss gradual degradation occurring between service calls.

This blind operation creates several critical vulnerabilities:

  1. Developing problems go undetected until they cause failures
  2. Service resources get allocated inefficiently across equipment inventory
  3. Critical units receive the same attention as low-priority equipment
  4. No baseline exists for comparing current performance against historical norms

Commercial cooling systems require continuous monitoring to catch early warning signs. Temperature fluctuations, runtime increases, and efficiency losses all signal developing problems. Traditional maintenance misses these indicators entirely.

The result is predictable: unexpected failures that could have been prevented with proper monitoring. Retailers continue losing product, revenue, and customer confidence because their maintenance strategy cannot identify problems before they escalate. This fundamental limitation makes the case for predictive approaches that leverage real-time data and analytics.

Financial Impact: Breaking Down the True Cost of Refrigeration Downtime

Refrigeration failures trigger a cascade of costs that extend far beyond the initial equipment repair invoice. The true financial burden encompasses immediate inventory destruction, premium service charges, lost revenue opportunities, and long-term brand equity erosion. Understanding these layered retail financial losses helps business owners recognize why preventive strategies deliver such compelling returns on investment.

Many retail operators focus exclusively on repair bills when calculating refrigeration downtime costs. This narrow perspective dramatically underestimates the actual financial impact. A comprehensive cost analysis reveals multiple expense categories that compound quickly during equipment failures.

The Immediate Sting: Product Loss and Spoilage

When a walk-in cooler stops maintaining safe temperatures, the clock starts ticking on thousands of dollars in perishable inventory. A single refrigeration unit failure typically generates $5,000 to $25,000 in immediate product spoilage losses for average-sized retail locations. Larger facilities or widespread system failures affecting multiple units can exceed $100,000 in destroyed inventory from a single incident.

These losses represent far more than wholesale replacement costs. The calculation must include embedded labor expenses, transportation fees, and the retail markup value that vanishes when products hit the dumpster instead of reaching customers.

refrigeration downtime costs impact on retail operations

Different product categories face varying vulnerability timeframes during temperature control failures:

  • Fresh meat and seafood – Safe holding period of just 24-72 hours before mandatory disposal
  • Dairy products – Shelf life typically ranges from 1-2 weeks under proper refrigeration
  • Prepared foods and deli items – Extremely short safe window, often less than 24 hours
  • Frozen goods – Can withstand brief temperature fluctuations but suffer quality degradation
  • Temperature-sensitive pharmaceuticals – Strict storage requirements with zero tolerance for deviations

Grocery retailers stock an average of 3,000-5,000 refrigerated SKUs at any given time. Even partial inventory loss creates significant financial strain. Product spoilage losses accumulate especially rapidly in high-volume operations during peak shopping periods.

Premium Pricing: Emergency Repair Expenses and Urgent Labor

Equipment failures rarely occur during convenient business hours. When refrigeration systems go down on weekends, holidays, or overnight, emergency repair expenses command premium rates that dwarf standard service costs. After-hours service calls typically carry 150-200% price premiums compared to scheduled maintenance appointments.

Expedited parts shipping adds another costly layer. Specialized refrigeration components often require overnight or same-day delivery to minimize downtime. These rush shipments can cost 3-5 times standard shipping rates.

Overtime labor charges compound the financial burden. Technicians called in during off-hours earn premium wages, and complex refrigeration repairs often require multiple specialists. A repair that might cost $800 during regular business hours can easily exceed $2,500 as an emergency callout.

Emergency repairs frequently address immediate symptoms rather than underlying root causes. This reactive approach leads to repeat failures and additional service calls. The equipment limps along until the next breakdown, creating an expensive cycle of crisis management.

Cost Category Emergency Scenario Preventive Maintenance Financial Difference
Service Call Fee $350-$600 $125-$200 180% premium
Labor Rate (per hour) $175-$250 $85-$125 105% premium
Parts Shipping $150-$400 $25-$75 300% premium
Average Total Repair $2,500-$5,000 $600-$1,200 315% premium

The Silent Killer: Long-Term Revenue Erosion and Reputation Damage

While immediate costs grab attention, the long-term revenue impact of refrigeration failures often inflicts deeper financial wounds. Customers who encounter empty shelves or limited selection due to equipment downtime don’t simply wait for restocking. They redirect their purchasing to competitors, and many never return.

Each stock-out incident chips away at customer loyalty and brand equity. Research shows that 37% of customers switch to competing retailers after encountering out-of-stock conditions on desired products. These defections represent permanent revenue loss, not just delayed purchases.

Brand reputation damage accelerates through social media amplification. A single customer’s negative experience with spoiled food or empty refrigerated sections can reach thousands of potential shoppers within hours. Online reviews mentioning food safety concerns or quality issues create lasting digital footprints that influence purchasing decisions for years.

The financial mathematics of customer defection reveal why retention matters so intensely. Acquiring new customers costs 5-25 times more than retaining existing ones. Losing established customers to preventable refrigeration failures means sacrificing not just immediate sales but the entire lifetime value those relationships represented.

Trust, once broken, proves extraordinarily difficult and expensive to rebuild. Retailers that experience publicized food safety incidents linked to refrigeration failures face uphill battles restoring consumer confidence. Marketing campaigns and promotional discounts designed to win back customers add substantial costs to the original failure impact.

Hidden Liabilities: Insurance and Legal Exposure

Refrigeration failures create insurance and liability implications that extend far beyond the immediate incident. Property insurance claims for spoiled inventory trigger premium increases that persist for multiple policy years. Insurers view equipment failures as preventable risks, and repeated claims can result in coverage exclusions or policy non-renewal.

The liability exposure becomes severe if compromised products reach consumers. Foodborne illness outbreaks traced to temperature control failures generate catastrophic legal costs. Defense attorney fees, settlement payments, and potential punitive damages can financially devastate retail operations.

Regulatory agencies impose substantial fines for food safety violations. The FDA and state health departments conduct investigations following refrigeration-related incidents. Violations can result in fines ranging from $10,000 to $500,000 depending on severity and scope. Repeat offenders face escalating penalties and potential facility closures.

Product recall expenses compound the financial damage. If refrigeration failures go undetected and affected products enter the supply chain, mandatory recalls create enormous costs. The average food recall costs companies $10 million in direct expenses, not including brand damage and lost sales.

“The financial impact of equipment failures extends into insurance premiums, legal liability, and regulatory compliance costs that many retailers fail to anticipate until after a catastrophic incident occurs.”

Understanding the complete spectrum of refrigeration downtime costs transforms the business case for predictive maintenance. When decision-makers recognize that equipment failures threaten profitability, customer relationships, and business continuity simultaneously, investment in prevention becomes the only financially rational strategy. The question shifts from whether to implement monitoring systems to how quickly deployment can occur.

Operational Consequences Beyond the Balance Sheet

While dollar losses grab attention, the operational consequences of refrigeration breakdowns create systemic disruptions across food safety compliance, customer satisfaction, and staff effectiveness that threaten the foundation of retail operations. These failures trigger regulatory scrutiny, erode customer trust, and overwhelm workforce capacity in ways that compound over time. The operational disruption extends into every department, creating challenges that persist long after equipment restoration.

Understanding these broader impacts reveals why predictive maintenance delivers value far beyond preventing equipment replacement costs. The operational chaos generated by unexpected refrigeration failures can undermine years of reputation building and operational excellence. Retailers must account for these hidden consequences when evaluating prevention strategies.

Food Safety Compliance Violations and Legal Risks

The regulatory environment governing retail refrigeration establishes strict requirements that leave zero margin for error. The FDA Food Code mandates specific temperature ranges for different product categories—41°F or below for refrigerated foods, 0°F or below for frozen items. State and local health departments enforce these standards through regular inspections and complaint-driven investigations.

When refrigeration systems fail, food safety compliance violations occur automatically if temperature excursions are not properly documented and immediately addressed. Health inspectors can issue citations that range from minor infractions to critical violations requiring immediate corrective action. Repeat violations or serious temperature control failures can trigger temporary closure orders that halt all food sales until compliance is restored.

These violations create public records that appear in health department databases accessible to consumers and media outlets. A single compliance failure can generate negative publicity that damages brand reputation across entire market regions. The transparency of modern health inspection reporting means violations quickly become public knowledge through restaurant rating websites and local news coverage.

food safety compliance and regulatory violations in retail refrigeration

The legal risks extend beyond administrative penalties into criminal and civil liability territories. Retailers who knowingly sell temperature-abused food products face potential criminal charges for distributing adulterated goods. Individual customers who suffer foodborne illness can file civil lawsuits claiming damages from negligent food handling practices.

The most severe exposure comes from class-action litigation when systematic food safety failures affect multiple customers. These cases can generate millions in settlement costs and legal fees, far exceeding the value of lost inventory. Documentation of regulatory violations provides plaintiff attorneys with ready evidence of negligent practices.

HACCP documentation requirements add another compliance layer that refrigeration failures complicate. Retailers must maintain detailed temperature logs demonstrating continuous compliance with critical control points. Equipment failures create documentation gaps that auditors and inspectors interpret as compliance failures, even when no actual food safety incident occurred.

Customer Experience Disruption and Lost Sales

Refrigeration failures create immediate and visible disruptions to the shopping experience that drive customers toward competitors. Empty display cases signal operational dysfunction the moment customers enter the store. Plastic sheeting covering inoperable refrigerated sections announces equipment problems that undermine confidence in store management.

Out-of-stock refrigerated items force incomplete shopping trips that fail to meet customer needs. Shoppers who cannot purchase intended products typically complete their refrigerated shopping at competing stores rather than making return trips. Each incomplete transaction represents both immediate lost revenue and potential permanent customer migration to alternative retailers.

The customer experience impact extends beyond individual transactions into long-term loyalty erosion. Customers develop shopping patterns based on reliability expectations—stores that consistently stock desired products earn repeat visits, while unreliable retailers lose habitual traffic. A single refrigeration failure can disrupt shopping patterns that took years to establish.

Modern consumers share negative experiences through online reviews and social media platforms that amplify individual incidents. Equipment failures generate frustrated customer posts that reach hundreds of potential shoppers. The reputational damage from visible operational problems persists long after equipment restoration, as online reviews remain permanently accessible.

Operational Impact Area Immediate Consequences Long-Term Effects Recovery Timeline
Food Safety Compliance Temperature violations, mandatory product disposal, health inspector citations Public violation records, increased inspection frequency, legal liability exposure 6-12 months for compliance history improvement
Customer Experience Empty display cases, out-of-stock items, incomplete shopping trips Customer migration to competitors, negative online reviews, loyalty program attrition 3-6 months to rebuild shopping patterns
Staff Productivity Emergency response protocols, product removal labor, service coverage gaps Employee stress and turnover, reduced morale, degraded service standards 2-4 weeks to restore normal operations rhythm
Retail Operations Workflow disruption, inventory system complications, vendor coordination challenges Operational inefficiency, increased labor costs, supply chain relationship strain 4-8 weeks to normalize operational metrics

The seamless customer experiences that define retail excellence depend on reliable infrastructure that never forces shoppers to adjust expectations. Refrigeration failures break this reliability contract, creating friction points that drive customers toward competitors offering consistent product availability.

Staff Productivity Loss During Equipment Failures

Equipment failures trigger emergency response protocols that pull employees away from customer service duties and scheduled responsibilities. Maintenance emergencies require immediate attention that disrupts carefully planned staffing allocations. The chaos of crisis management degrades overall team performance across all departments.

Staff productivity plummets as employees shift from routine operations to damage control mode. Product removal from failing refrigeration units consumes significant labor hours that could otherwise support customer service or merchandising activities. Teams must manually sort inventory to identify salvageable items versus products requiring disposal.

Emergency cleaning and sanitization of affected refrigeration units requires all-hands response that diverts workers from their primary roles. Management personnel must document incidents for insurance claims and compliance reporting, consuming hours that should focus on strategic planning and team development. The administrative burden of refrigeration failures extends far beyond immediate physical response.

The stress and disruption of managing refrigeration emergencies impacts employee morale and retention. Workers facing repeated crises without adequate preventive systems experience job dissatisfaction that drives turnover. Training new employees to replace departing staff creates additional productivity losses as inexperienced workers learn operational procedures.

Coverage gaps emerge when experienced employees focus on emergency response rather than customer interaction. New or less-trained staff members handle customer needs during crises, potentially delivering substandard service that compounds the negative customer experience. The productivity impact cascades through the organization, affecting service quality across all customer touchpoints.

These operational consequences demonstrate that refrigeration failures create systemic disruptions affecting every aspect of retail operations. The compliance violations, customer experience degradation, and workforce productivity losses collectively undermine competitive positioning in ways that financial metrics alone cannot capture. Preventing these operational disruptions through predictive maintenance delivers value that extends far beyond equipment replacement cost savings.

What Is Retail Predictive Maintenance and How Does It Work

Retail refrigeration management stands at a technological crossroads where data-driven insights replace guesswork and emergency responses. The shift from reactive fixing to planned care is transformative for businesses that depend on temperature-controlled environments. Predictive maintenance technology uses continuous equipment monitoring to identify problems before they cause failures, reducing unplanned downtime by over 30% compared to traditional approaches.

This advanced strategy moves beyond scheduled maintenance intervals to condition-based maintenance that responds to actual equipment health. Retailers gain the ability to address developing issues during convenient timeframes rather than facing emergency situations. The result is maximized uptime, extended asset life, and significantly lower total maintenance costs.

From Reactive Failures to Proactive Prevention

Understanding the fundamental differences between maintenance philosophies reveals why predictive approaches deliver superior outcomes. Traditional reactive maintenance accepts equipment breakdowns as inevitable and responds only after failures occur. This run-to-failure strategy creates maximum operational disruption and drives the highest total costs.

Preventive maintenance represents an improvement by performing scheduled service at fixed intervals regardless of actual equipment condition. While this time-based approach reduces catastrophic failures, it wastes resources on unnecessary service and misses developing problems between scheduled intervals. The maintenance team might replace components that still have useful life remaining while overlooking issues that emerge just after inspection.

Predictive maintenance technology transforms this paradigm by using real-time performance data to schedule maintenance precisely when needed. Equipment tells maintenance teams exactly what attention it requires and when intervention becomes necessary. This condition-based maintenance approach eliminates both premature component replacement and unexpected failures.

predictive maintenance technology sensors monitoring refrigeration equipment

Maintenance Approach Service Trigger Cost Impact Primary Outcome
Reactive (Run-to-Failure) Equipment breakdown Highest total cost Maximum downtime and disruption
Preventive (Time-Based) Fixed schedule intervals Medium cost with waste Reduced failures but inefficient resource use
Predictive (Condition-Based) Real-time sensor analytics Lowest total cost Maximized uptime and asset life
Prescriptive (AI-Optimized) Machine learning recommendations Optimized efficiency Autonomous maintenance scheduling

Continuous Intelligence Through Advanced Sensor Networks

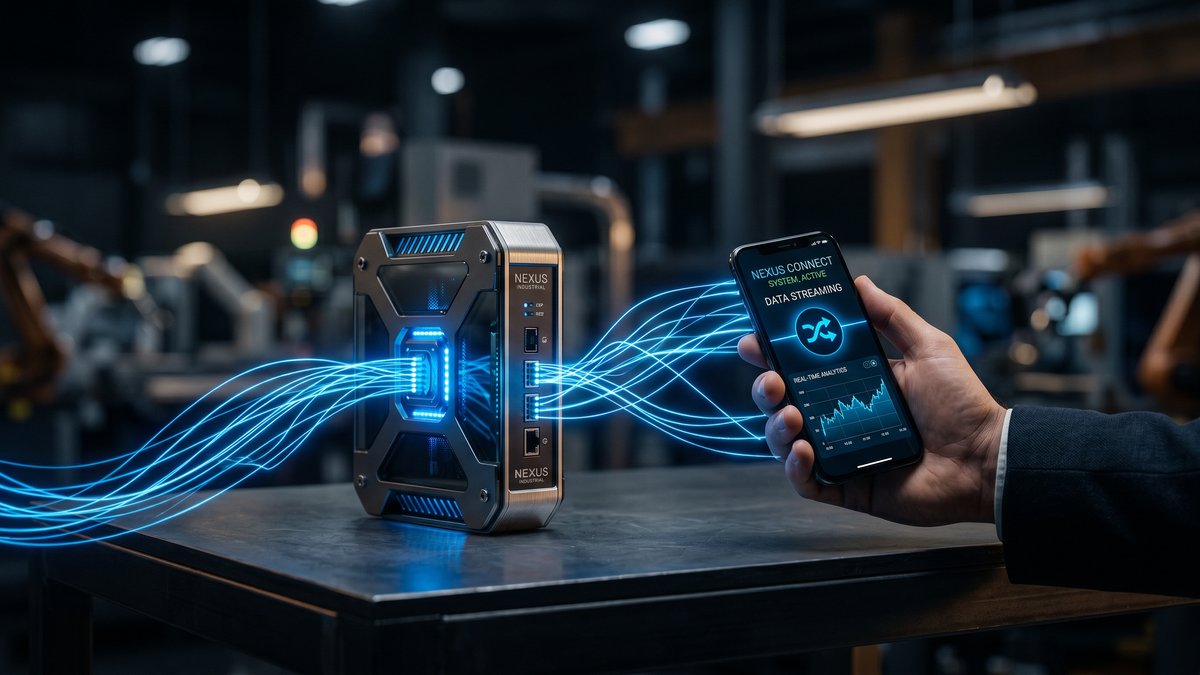
The foundation of predictive maintenance rests on IIoT sensors that continuously collect performance data from refrigeration equipment. These specialized devices monitor critical parameters that indicate equipment health and identify developing problems long before they cause failures. Industrial Internet of Things technology creates a real-time digital representation of every refrigeration unit’s operational status.

Temperature sensors form the first line of defense by continuously tracking refrigerated space conditions. These devices detect temperature excursions before product becomes compromised, protecting inventory value and food safety compliance. Modern sensors measure with precision to within 0.1 degrees and transmit readings every few minutes.

Vibration sensors mounted on compressors and motors identify bearing wear and mechanical degradation through changes in vibration patterns. Healthy equipment produces consistent vibration signatures, while developing problems create distinctive changes that sensors detect immediately. This real-time equipment monitoring enables maintenance teams to address bearing issues before they cause compressor failure.

Current sensors track electrical consumption patterns that reveal motor stress and component deterioration. Unexpected increases in amperage draw indicate mechanical resistance or electrical problems requiring attention. Pressure sensors monitor refrigerant system performance, detecting leaks or restrictions that reduce cooling efficiency.

Humidity sensors track defrost cycle effectiveness and identify airflow problems that compromise temperature stability. These IIoT sensors transmit data continuously via wireless protocols, eliminating the need for manual readings and creating comprehensive equipment health records. The sensor network operates autonomously, collecting millions of data points that would be impossible to gather through manual inspection.

Intelligence That Predicts Problems Before They Occur

Raw sensor data becomes actionable intelligence through sophisticated machine learning analytics that identify patterns invisible to human observation. Advanced algorithms establish baseline performance signatures for each refrigeration unit during normal operation. The system learns what healthy equipment looks like under various conditions and operating loads.

Anomaly detection compares current performance against these established baselines to identify deviations from normal operating parameters. The system distinguishes between harmless variations and meaningful changes that signal developing problems. This pattern recognition operates continuously, analyzing data streams in real time to catch issues at their earliest stages.

Predictive algorithms forecast remaining useful life based on degradation trends observed in component performance. The system calculates when specific components will likely require service based on their current condition and historical deterioration rates. This forward-looking analysis enables maintenance planning weeks in advance rather than emergency responses.

Machine learning analytics also prioritize alerts by distinguishing urgent threats from minor variations. The system learns which conditions require immediate attention and which can wait for scheduled maintenance windows. This intelligent filtering prevents alert fatigue while ensuring critical issues receive prompt response.

The analytics platform continuously refines its predictive accuracy by learning from outcomes. When maintenance confirms a predicted issue, the system strengthens those pattern associations. This real-time equipment monitoring combined with advanced analytics transforms maintenance from a reactive necessity into a strategic advantage.

Metrics That Reveal Equipment Health Status

Specific refrigeration performance metrics serve as reliable indicators of equipment condition and predict maintenance needs. These key performance indicators provide objective measurements that guide maintenance decisions and validate equipment health. Understanding these metrics enables retailers to recognize warning signs before they escalate into failures.

Compressor run time percentage indicates how frequently the unit cycles on and off to maintain temperature. Excessive run time suggests the system works harder than normal, possibly due to refrigerant loss, condenser fouling, or door seal problems. Conversely, short cycling indicates control issues or refrigerant overcharge.

Temperature stability and recovery time after door openings reveal the system’s cooling capacity and efficiency. Healthy units quickly return to setpoint after thermal loads, while struggling equipment shows prolonged recovery periods. This metric provides early warning of declining performance before product is compromised.

Defrost cycle frequency and duration indicate evaporator coil condition and airflow effectiveness. Units requiring more frequent or longer defrost cycles may have airflow restrictions or humidity problems. These refrigeration performance metrics help identify maintenance needs before they affect product storage conditions.

Performance Indicator What It Measures Warning Signs Predicted Issues
Compressor Run Time Operating duty cycle percentage Above 70% continuous operation Refrigerant loss, condenser problems, capacity decline
Temperature Recovery Time to restore setpoint after door opening Recovery exceeding 15 minutes Reduced cooling capacity, airflow restrictions
Energy Consumption Pattern Kilowatt-hours per operating cycle Increase above 15% baseline Mechanical resistance, electrical problems, efficiency loss
Defrost Cycle Duration Minutes required for complete defrost Extending beyond normal range Evaporator coil restrictions, airflow problems
Refrigerant Pressure Differential High-side to low-side pressure ratio Ratio deviation above 10% System leaks, restrictions, component failure

Energy consumption patterns provide powerful diagnostic information about mechanical and electrical health. Gradual increases in power usage indicate developing inefficiencies that drive operating costs higher. Sudden changes signal component problems requiring investigation.

Refrigerant pressure differentials between high-side and low-side measurements reveal system charge levels and restriction problems. Abnormal pressure relationships indicate leaks, blockages, or compressor valve issues. Monitoring these metrics through condition-based maintenance enables precise diagnosis and targeted repairs.

These key performance indicators work together to create a comprehensive health assessment for each refrigeration unit. The combination of metrics provides diagnostic clarity that single measurements cannot achieve. Retailers using these refrigeration performance metrics gain unprecedented visibility into equipment condition and maintenance requirements.

Iottive’s Smart Retail Solution: Preventing Failures Before They Happen

Preventing refrigeration failures starts with continuous monitoring, intelligent analytics, and automated response mechanisms working in perfect harmony. The Iottive platform brings these elements together into a unified system that transforms refrigeration assets from silent risk factors into communicative, self-reporting equipment. This smart retail solution protects product quality while streamlining operations across every location in your retail network.

Traditional refrigeration systems operate in darkness until something breaks. Iottive changes that paradigm completely by making every unit visible, measurable, and manageable from a single control center. The result is a shift from reactive emergency response to proactive management that prevents problems before customers ever notice.

Iottive platform refrigeration monitoring system dashboard

Wireless Sensor Networks That See Everything

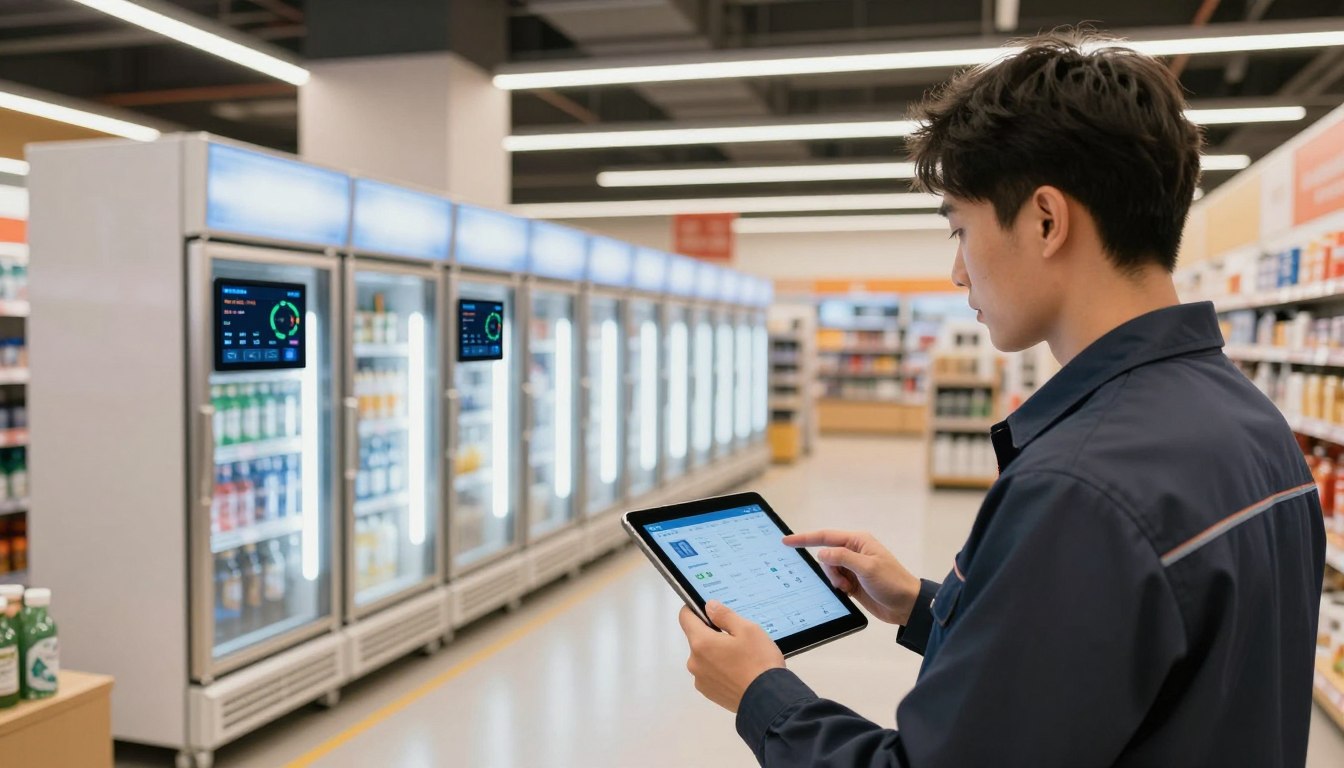
The Iottive platform begins with a comprehensive sensor network that attaches directly to existing refrigeration equipment. These wireless devices require no equipment modification or operational shutdown during installation. Technicians mount sensors in minutes, and the system starts collecting data immediately.

Each sensor captures multiple performance indicators simultaneously. Temperature readings track the internal environment of every refrigerated case and walk-in cooler. Humidity sensors detect moisture levels that signal potential issues with door seals or defrost cycles.

Compressor performance monitors measure vibration patterns, runtime cycles, and energy draw. Door status sensors track how often units open and how long they remain unsealed. This multi-dimensional view creates a complete health profile for every piece of equipment.

The refrigeration monitoring system processes this data locally through edge computing devices installed at each location. These intelligent processors analyze information in real-time, identifying anomalies within seconds of their occurrence. Critical threats trigger immediate alerts without waiting for cloud transmission.

Intelligence That Distinguishes Noise from Genuine Threats

Alert fatigue destroys the effectiveness of many monitoring systems. Too many false alarms train staff to ignore notifications, defeating the entire purpose of automated monitoring. Iottive solves this problem through machine learning algorithms that understand normal operational variations.

The platform implements multi-threshold alert logic that categorizes issues by severity. Minor temperature fluctuations that self-correct within minutes generate informational logs but no urgent notifications. Developing concerns that show progressive deterioration trigger advisory alerts to maintenance teams.

Critical threats demand immediate action. When sensor data indicates imminent failure, the system escalates notifications through predetermined protocols. The right person receives the right information at the right time based on issue severity and required response speed.

Predictive alerts represent the most valuable capability of the Iottive system. By analyzing performance trends over time, the platform identifies degradation patterns that precede failures by 24 to 72 hours. This advance warning enables scheduled maintenance during off-peak hours rather than emergency service calls at premium rates.

Machine learning continuously refines alert accuracy. The system learns from every event, distinguishing between harmless variations and genuine developing problems. Over time, prediction accuracy improves while false positive rates decline.

Integration That Respects Existing Investments

Retail operations already depend on multiple technology systems. Point-of-sale platforms track transactions, inventory management software monitors stock levels, and facility management tools coordinate maintenance activities. Adding another disconnected system creates information silos and operational complexity.

The Iottive platform takes a different approach through comprehensive retail technology integration. The system connects seamlessly with existing infrastructure through standard APIs and data protocols. Refrigeration performance data flows into inventory systems, enabling automatic adjustments when cooling capacity changes.

Work order systems receive automated maintenance requests when the platform detects developing issues. Facility management dashboards display refrigeration status alongside HVAC, lighting, and security information. This unified visibility eliminates the need to check multiple systems for complete operational awareness.

Integration happens without wholesale technology replacement. Retailers preserve existing investments while adding transformative predictive capabilities. The implementation process respects operational continuity, with staged rollouts that minimize disruption.

Integration Category Connected Systems Data Exchange Business Impact
Inventory Management Stock tracking, ordering systems Temperature events, capacity alerts Automated product relocation during equipment issues
Facility Operations CMMS, work order platforms Maintenance requests, performance data Proactive service scheduling, reduced emergency calls
Energy Management Utility monitoring, demand response Consumption patterns, efficiency metrics Optimized runtime, lower energy costs
Compliance Systems Food safety, audit platforms Temperature logs, incident reports Automated documentation, simplified inspections

Visibility From Anywhere, Anytime

Effective remote equipment management requires more than data collection—it demands intuitive interfaces that transform raw information into actionable intelligence. The Iottive dashboard delivers this clarity through visual displays designed for quick comprehension.

Facility managers view all refrigeration assets across multiple locations from a single screen. Color-coded status indicators show at-a-glance health for every unit. Green signals normal operation, yellow indicates developing concerns requiring attention, and red demands immediate response.

Performance trending charts reveal degradation patterns over days and weeks. A compressor showing gradually increasing runtime signals declining efficiency long before complete failure. Door sensors tracking frequent openings highlight staff training opportunities or scheduling adjustments needed to reduce temperature stress.

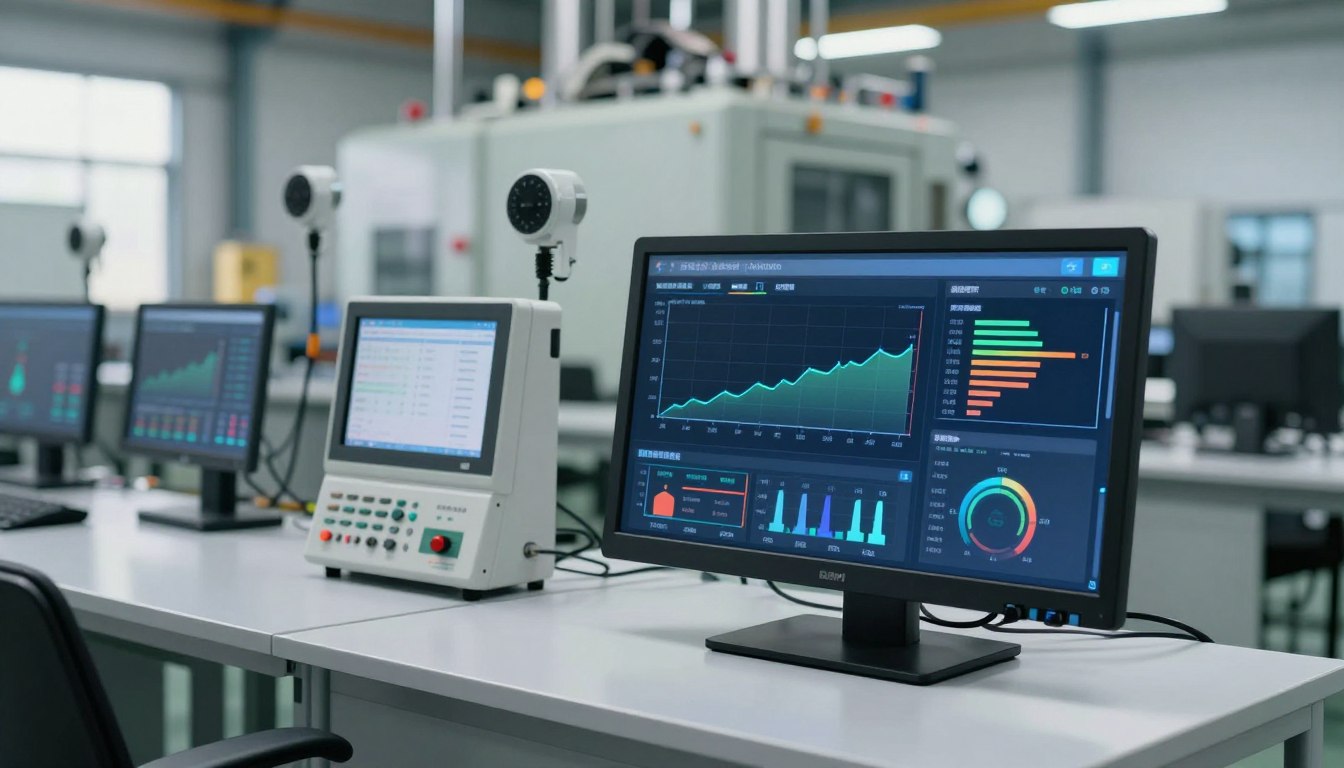
Energy consumption analytics quantify efficiency opportunities across the entire equipment fleet. The platform identifies units consuming excessive power relative to their cooling load, pinpointing candidates for repair or replacement. These insights transform energy management from guesswork into data-driven decision-making.

Mobile access extends monitoring capabilities beyond the desktop. Regional managers traveling between locations check system status from smartphones or tablets. After-hours alerts reach the appropriate personnel regardless of their physical location, ensuring rapid response to emerging issues.

The dashboard adapts to different user roles and responsibilities. Store-level staff see details for their location, while corporate facilities teams access enterprise-wide visibility. Customizable views ensure each user sees relevant information without overwhelming detail.

Documentation That Happens Automatically

Food safety regulations require meticulous temperature record-keeping. Health department inspections demand proof of continuous monitoring and rapid response to temperature excursions. Traditional manual logging creates compliance burdens that consume staff time and introduce human error.

Compliance automation through the Iottive platform eliminates these challenges entirely. The system maintains continuous temperature logs for every refrigeration asset automatically. No manual readings, no paper forms, no forgotten checks during busy periods.

When temperature excursions occur, the platform documents the event with precise timestamps, duration, affected equipment, and response actions taken. This automated incident documentation satisfies HACCP requirements without additional staff effort. Every data point remains securely stored and instantly retrievable.

Scheduled compliance reports generate automatically for health department inspections. Managers download comprehensive documentation showing months of continuous monitoring, alert responses, and corrective actions. What once required hours of preparation now takes minutes.

Audit trails demonstrate due diligence in equipment management and food safety protocols. If questions arise about historical performance or response procedures, complete records provide definitive answers. This documentation protects retailers from liability while proving commitment to safety standards.

The platform maintains data security through encrypted transmission and storage. Access controls ensure only authorized personnel view sensitive operational information. Compliance with data protection regulations happens automatically through built-in security architecture.

Proven ROI and Implementation: The Business Case for Iottive Predictive Maintenance

Every dollar invested in predictive maintenance should generate measurable value through reduced failures, extended equipment life, and lower operating costs. The business case for Iottive’s platform rests on documented financial returns that transform refrigeration systems from cost centers into strategic assets. Retail leaders implementing this technology see quantifiable improvements across operations, compliance, and customer satisfaction.

Advanced connectivity and sensor technology create resilient, data-driven stores that improve overall business efficiency. This approach reduces waste and protects product quality while delivering a better shopping experience. The predictive maintenance ROI becomes evident within the first year of deployment through multiple value streams.

Dramatic Decreases in Equipment Failures and Service Calls

Retailers implementing Iottive’s platform experience 30-50% reduction in unplanned equipment downtime as developing issues are addressed during scheduled maintenance windows. Technicians resolve minor problems before they escalate into complete system failures. This proactive approach eliminates the disruption and urgency that characterize reactive maintenance.

Emergency repair calls decrease by 60-75% when sensor data identifies performance degradation early. The premium costs associated with after-hours service, expedited parts shipping, and overtime labor virtually disappear. Maintenance cost reduction becomes immediately visible in monthly operating budgets.

Product spoilage losses drop by 40-60% through early intervention before temperature excursions compromise inventory. The platform detects subtle refrigeration performance changes that would go unnoticed until merchandise damage occurs. These savings alone often justify the entire platform investment.

Documented implementations consistently deliver 12-18 month return on investment through combined savings across downtime, repairs, and product protection. These are not theoretical projections but actual outcomes from operating retail environments. The financial case strengthens each year as benefits compound.

Extended Equipment Lifespan and Energy Efficiency Gains

Predictive maintenance extends refrigeration equipment lifespan by 20-30% through optimal service timing. The platform prevents catastrophic failures and cascade damage that occur when minor issues go unaddressed. Equipment reaches and exceeds manufacturer design life expectations.

Proper maintenance timing protects compressors, condensers, and other critical components from stress that accelerates wear. Capital replacement cycles extend significantly, deferring major investments while maintaining reliability. Equipment lifespan extension represents substantial long-term value creation.

Energy consumption decreases 10-15% as the platform identifies efficiency degradation and prompts corrective action. Dirty condenser coils, refrigerant charge issues, and airflow restrictions are detected before they significantly impact performance. Energy efficiency improvements reduce utility costs month after month.

Compressor optimization reduces runtime while maintaining temperature stability. The system learns ideal operating patterns for each store location and alerts managers to deviations. These efficiency gains contribute to sustainability goals while improving financial performance.

Documented Case Studies from U.S. Retail Implementations

Real-world retail case studies provide proof beyond technical claims. A regional grocery chain with 47 locations across the Midwest eliminated 89% of refrigeration-related product losses in the first year after deployment. The platform detected developing compressor issues and door seal problems before temperature fluctuations affected merchandise.

A convenience store operator managing 12 locations in Texas reduced maintenance costs by $47,000 annually through predictive intervention. Emergency service calls dropped from 43 incidents yearly to just 7. Scheduled maintenance became more efficient as technicians arrived with precise diagnostic information.

A specialty food retailer in the Pacific Northwest achieved zero health department violations related to temperature control after implementation. Automated compliance documentation provided complete refrigeration records for inspections. Customer confidence improved as product quality became consistently reliable.

Retail Implementation Primary Benefit Quantified Result Timeframe
Regional Grocery Chain (47 stores) Product Loss Prevention 89% reduction in spoilage incidents First 12 months
Convenience Store Operator (12 locations) Maintenance Cost Savings $47,000 annual reduction Year one implementation
Specialty Food Retailer (8 stores) Compliance Achievement Zero temperature violations 18 months post-deployment
Multi-State Pharmacy Chain (156 locations) Equipment Lifespan Extension 27% increase in replacement cycle Three-year study period

These implementations demonstrate consistent value delivery across different retail formats and geographic markets. Each organization experienced rapid ROI through their specific operational priorities. The platform adapts to diverse business requirements while maintaining performance standards.

Assessment and Implementation Process

Iottive collaborates with retail leaders, digital heads, store operations teams, and supply chain stakeholders to understand customer journeys and operational challenges. The implementation process begins with comprehensive consultation to identify specific refrigeration concerns and business objectives. This foundation ensures the platform addresses actual needs rather than generic capabilities.

Site assessment evaluates existing refrigeration assets, infrastructure, and monitoring gaps. Technical teams examine equipment types, age, maintenance history, and current failure patterns. This analysis identifies highest-priority locations and systems for initial deployment.

The implementation process includes these structured phases:

  • Retail use-case validation confirms the platform addresses specific operational challenges
  • Omnichannel architecture design integrates monitoring with existing retail systems
  • IoT device selection matches sensors to equipment types and monitoring requirements
  • AI personalization planning configures alert thresholds for store-specific conditions
  • Measurable KPI definition establishes success metrics including stock accuracy and conversion rates

Pilot program deployment in representative locations validates performance and refines configuration. Initial installations provide learning opportunities that improve subsequent rollouts. Lessons from pilot stores accelerate deployment across additional locations.

Phased rollout incorporates optimization insights as the platform expands. Cloud scalability and cybersecurity measures protect operations throughout deployment. Long-term support ensures continuous performance as business needs evolve.

Scalability for Single Stores to Multi-Location Chains

The platform architecture supports deployments from single-location independent retailers to national chains with hundreds of stores. Scalable solutions grow transparently as business expands without requiring infrastructure redesign. Independent grocers and pharmacy chains use identical core technology tailored to their operational scale.

Cloud-based infrastructure eliminates server investments and scales automatically with location count. Multi-store expansion occurs without capital equipment purchases or IT infrastructure additions. Regional inventory balancing and cross-border retail operations receive enterprise-grade monitoring without enterprise complexity.

Enterprise features serve complex organizational structures through role-based access and multi-location dashboards. Corporate facilities teams view system-wide performance while store managers focus on their locations. Omnichannel integration connects refrigeration monitoring with inventory management and customer experience platforms.

Continuous optimization using AI insights improves performance as the platform learns operational patterns across locations. Geographic and seasonal variations are incorporated into predictive models. The system becomes more accurate and valuable over time.

Training, Support, and Ongoing Optimization

Comprehensive user training prepares store managers, maintenance technicians, and corporate facilities teams for platform operation. Training programs address different user roles with relevant functionality and responsibilities. Teams become proficient quickly through hands-on exercises and real-world scenarios.

Technical support operates 24/7 to address platform and sensor issues whenever they arise. Support teams understand retail operations and respond with urgency appropriate to business impact. Most issues resolve remotely without site visits or operational disruption.

Regular system health reviews and performance optimization maintain peak effectiveness. Iottive specialists analyze alert patterns, response times, and outcome data to refine configurations. These reviews identify opportunities for improved accuracy and additional value delivery.

Continuous platform enhancements deliver new capabilities without additional investment. Software updates add features, improve analytics, and expand integration options. Retailers benefit from ongoing development funded across the entire customer base.

The combination of proven returns, manageable implementation, and long-term support establishes Iottive predictive maintenance as a strategic investment rather than an operational expense. Documented predictive maintenance ROI removes financial uncertainty while transforming refrigeration from cost center to competitive advantage.

Conclusion

Refrigeration management no longer belongs in the category of hidden operational risks. The retail refrigeration solution landscape has shifted from reactive crisis response to intelligent, data-driven control. Retailers who embrace this IIoT transformation gain measurable advantages across every performance metric.

Predictive maintenance implementation delivers documented results within 12-18 months. Product losses decrease. Emergency repair costs drop. Compliance documentation becomes automated. Equipment lifespan extends. Energy consumption falls. These financial returns compound year after year.

The business case extends beyond cost reduction. Proactive equipment management enables operational excellence that customers notice and value. Stores maintain consistent product availability. Shopping experiences remain seamless. Brand reputation strengthens through reliability.

Retailers operating without predictive systems accept unnecessary financial exposure and competitive disadvantages. Modern retail demands infrastructure that performs with certainty. Point-of-sale systems and inventory platforms are considered essential. Refrigeration monitoring deserves the same priority.

Iottive provides the proven platform, implementation expertise, and ongoing support that makes this transformation accessible for operations of any size. The assessment process identifies specific opportunities within your refrigeration infrastructure. Implementation integrates smoothly with existing systems. Results appear quickly and grow continuously.

Contact Iottive to begin converting refrigeration from liability into managed, optimized asset. Join the retailers who have eliminated emergency disruptions, protected inventory value, and established the reliable operations that successful retail requires.

FAQ

What is the average annual cost of refrigeration failures for a typical grocery store?

A single refrigeration failure can result in $5,000-$25,000 in immediate product spoilage for one walk-in cooler, while widespread system failures affecting multiple units can exceed $100,000 in lost inventory per location. Beyond direct product loss, retailers face emergency repair premiums of 150-200% above standard rates, after-hours service charges, expedited parts shipping, and long-term customer defection costs. Industry data shows refrigeration breakdowns contribute to billions in annual losses across U.S. grocery stores, supermarkets, convenience stores, and food service operations when combining product spoilage, emergency repairs, compliance violations, and revenue loss from stockouts.

How does predictive maintenance differ from traditional preventive maintenance?

Preventive maintenance follows fixed time-based schedules (monthly, quarterly, or annually), performing service regardless of actual equipment condition—resulting in wasted resources on unnecessary service while potentially missing developing problems between scheduled intervals. Predictive maintenance uses real-time performance data from IIoT sensors to monitor actual equipment health continuously, identifying developing issues through pattern recognition and anomaly detection. This condition-based approach schedules maintenance precisely when needed based on equipment degradation trends, not arbitrary calendar dates. Industry data confirms predictive approaches reduce unplanned downtime by over 30% compared to traditional methods while extending equipment lifespan by 20-30% through optimal service timing.

What types of sensors does Iottive use to monitor refrigeration equipment?

Iottive deploys a comprehensive wireless sensor network that captures critical refrigeration performance indicators: temperature sensors continuously monitor refrigerated space conditions and detect excursions before product compromise; vibration sensors on compressors and motors identify bearing wear and mechanical degradation; current sensors detect electrical anomalies indicating motor stress or component failure; pressure sensors monitor refrigerant system performance; and humidity sensors track defrost cycle effectiveness. These sensors attach to existing equipment without requiring modification or shutdown, transmitting data continuously via wireless protocols to create a real-time digital representation of equipment health across all refrigeration assets.

How quickly can Iottive’s system detect refrigeration problems before product is lost?

Iottive’s platform provides predictive warnings 24-72 hours in advance of likely failures, enabling planned service during off-peak hours rather than emergency response. The system uses multi-threshold alert logic to differentiate between minor variations, developing concerns, and critical threats, with immediate notifications for urgent temperature excursions that could compromise product safety. Edge computing devices process data locally for immediate threat detection, while machine learning algorithms continuously analyze performance patterns to identify degradation trends before they reach failure thresholds. This early warning capability enables intervention before temperature excursions compromise inventory, documented to deliver 60-75% decrease in product spoilage losses compared to reactive maintenance approaches.

What is the typical return on investment timeline for implementing Iottive predictive maintenance?

Documented retail implementations demonstrate 12-18 month ROI on platform investment through quantifiable savings: 30-50% reduction in unplanned equipment downtime, 60-75% decrease in emergency repair calls and associated premium costs, and 40-60% reduction in product spoilage losses. These measurable outcomes represent first-year savings that typically exceed implementation costs within the ROI window. Beyond immediate returns, lifecycle benefits compound annually through 20-30% extended equipment lifespan, 10-15% energy consumption reduction, and elimination of compliance violations with associated fines and legal costs. A convenience store operator documented $47,000 in annual maintenance cost reduction across just 12 locations, while a regional grocery chain eliminated 89% of refrigeration-related product losses in the first year.

Can Iottive’s platform integrate with my existing retail management systems?

Yes. Iottive’s platform connects seamlessly with existing retail infrastructure including point-of-sale systems, inventory management platforms, facility management software, and work order systems, creating unified operational visibility without requiring wholesale technology replacement. The integration approach respects existing technology investments while adding transformative predictive capability. Cloud-based architecture eliminates server investments and scales transparently from single-location independent retailers to national chains with hundreds of stores. The platform provides role-based access, multi-location dashboards, and corporate reporting to serve complex organizational structures, with mobile access enabling facilities managers to monitor operations across all locations from anywhere.

How does predictive maintenance help with food safety compliance and health department inspections?

Iottive’s automated compliance documentation transforms regulatory requirements from operational burden to background process. The platform provides continuous temperature logging that satisfies FDA Food Code requirements and HACCP documentation standards, with automated incident documentation and audit trails demonstrating due diligence. Scheduled compliance reports are generated automatically for health department inspections, eliminating manual record-keeping. The system prevents the temperature excursions that trigger compliance violations, health department citations, mandatory product disposal under inspector supervision, and potential temporary closure orders. Retailers using Iottive have documented zero health department violations related to temperature control after implementation, eliminating regulatory fines, legal exposure, and the public records that damage business reputation.

What happens during the Iottive implementation process?

Implementation follows a structured process designed to minimize disruption and validate performance: Initial consultation with retail leaders, operations teams, and facility managers to understand specific challenges and objectives; site assessment to evaluate existing refrigeration assets and infrastructure requirements; pilot program deployment in representative locations to validate performance and refine configuration based on actual operating conditions; phased rollout across additional locations with lessons learned incorporated; and continuous optimization as the platform learns store-specific operational patterns. The process includes comprehensive user training for store managers, maintenance technicians, and corporate facilities teams, with 24/7 technical support for platform and sensor issues, regular system health reviews, and ongoing platform enhancements delivered without additional investment.

How many refrigeration units does a typical grocery store operate, and can Iottive monitor all of them?

Grocery stores typically operate 20-40 refrigeration units per location, including walk-in coolers, reach-in refrigerators, display cases, and cold storage facilities. Multi-location chains manage thousands of critical cooling assets representing millions of dollars in capital expenditure. Iottive’s wireless sensor network scales to monitor all refrigeration assets across single or multiple locations, providing unified visibility of enterprise-wide refrigeration infrastructure. The cloud-based platform aggregates data from all monitored units into centralized dashboards while maintaining location-specific detail, enabling both corporate-level oversight and store-level operational management. This comprehensive coverage transforms every refrigeration unit from silent equipment into communicative assets that continuously report operational status and health.

What specific refrigeration failure modes can Iottive’s predictive analytics detect?

Iottive’s analytics identify the full spectrum of refrigeration degradation patterns: compressor degradation from inadequate maintenance detected through runtime percentage changes and vibration signatures; refrigerant leaks identified by pressure differential anomalies and extended cooling cycles; condenser coil fouling that reduces heat transfer efficiency revealed through temperature recovery delays; evaporator fan motor failures detected by airflow pattern changes and temperature stratification; thermostat malfunctions identified through erratic cycling or temperature instability; door seal deterioration revealed by increased runtime and humidity patterns; and electrical component breakdowns detected through current draw anomalies. Pattern recognition algorithms establish baseline performance signatures for each unit, with anomaly detection identifying deviations from normal operating parameters before they escalate to failures requiring emergency intervention.

How does refrigeration failure impact customer experience beyond out-of-stock items?

Refrigeration failures create cascading customer experience disruptions: empty display cases create negative first impressions that signal operational dysfunction; incomplete shopping trips when key items are unavailable drive customers to competitors for immediate needs and potentially future purchases; plastic sheeting over refrigerated sections visibly communicates problems and raises food safety concerns; and the inability to fulfill customer needs generates frustration and brand switching. Each disrupted customer interaction represents both immediate lost revenue and long-term loyalty erosion. Social media amplification of food safety concerns or operational problems can damage brand equity built over decades, with negative reviews and photos reaching thousands of potential customers. Retailers document that customers who encounter stockouts shift purchasing to competitors, representing not just lost immediate sales but potentially permanent customer defection worth thousands in lifetime value.

What are the most common causes of retail refrigeration equipment failure?

Technical analysis identifies specific failure modes with operational triggers: Compressor degradation from inadequate maintenance, refrigerant contamination, or operational overload; refrigerant leaks caused by corrosion, vibration-induced connection failures, or physical damage; condenser coil fouling from dust, grease, and debris accumulation that reduces heat transfer efficiency; evaporator fan motor failures from bearing wear, electrical issues, or environmental stress; thermostat malfunctions causing temperature instability and improper cycling; door seal deterioration from wear, damage, or improper closure allowing warm air infiltration; and electrical component breakdowns including contactors, relays, and control boards. Each failure mode connects to operational triggers—whether deferred maintenance, environmental stress, equipment age exceeding design life, or operational patterns that exceed equipment specifications.

How does Iottive reduce false alarms while maintaining sensitivity to real threats?

Iottive employs machine learning algorithms that continuously refine alert thresholds based on each unit’s specific operational patterns, seasonal variations, and usage cycles. The platform distinguishes between normal operational variations (brief temperature increases during restocking or peak customer traffic) and genuine degradation trends through pattern recognition that considers context, duration, and trend direction. Multi-threshold alert logic categorizes issues by severity and urgency, escalating only those requiring immediate response while tracking minor variations for trend analysis. This approach prevents alert fatigue—the desensitization that occurs when personnel receive excessive false positives—while maintaining high sensitivity to genuine threats. The system learns store-specific patterns, such as delivery schedules and peak operating hours, incorporating this context into alert decisions to reduce unnecessary notifications while ensuring critical threats receive immediate escalation.

What energy efficiency improvements can retailers expect from predictive maintenance?

Documented implementations show 10-15% energy consumption reduction through predictive maintenance optimization. The platform identifies efficiency degradation that increases energy use without equipment failure: condenser coil fouling requiring longer compressor runtime, refrigerant charge imbalances reducing cooling efficiency, door seal problems allowing conditioned air loss, and thermostat drift causing excessive cycling. By prompting corrective action when efficiency metrics deviate from baseline, the system maintains optimal performance throughout equipment life rather than accepting gradual degradation until failure. Compressor optimization through defrost cycle refinement and temperature stability improvements reduces runtime while maintaining product safety. Energy analytics provide visibility into consumption patterns across all locations, enabling identification of outlier units and validation of service effectiveness through before-and-after consumption comparison.

Can Iottive’s platform monitor refrigeration equipment from different manufacturers?

Yes. Iottive’s sensor-based monitoring approach is manufacturer-agnostic, attaching to existing equipment regardless of brand or model without requiring integration with proprietary control systems. This universal compatibility enables comprehensive monitoring across mixed equipment environments typical in retail operations—where walk-in coolers, reach-in units, display cases, and specialty refrigeration may come from different manufacturers across various installation dates. The platform creates unified visibility and consistent analytics across all refrigeration assets regardless of underlying equipment diversity. This approach also protects technology investment as equipment is replaced or upgraded over time, with sensors transferring to new units while maintaining historical performance data and institutional knowledge about location-specific operational patterns.

How does predictive maintenance extend refrigeration equipment lifespan?

Predictive maintenance extends equipment lifespan by 20-30% through optimal service timing that prevents catastrophic failures and cascade damage. When compressors fail catastrophically due to undetected degradation, the failure often damages related components including motors, electrical systems, and refrigerant circuits—requiring extensive repairs or complete replacement. Early intervention based on predictive warnings addresses developing issues (bearing wear, refrigerant loss, electrical degradation) before they escalate to component destruction. This approach maintains equipment within designed operating parameters throughout its service life rather than cycling between degraded performance and emergency repair. Proper maintenance timing also prevents secondary damage—when one failing component stresses related systems, accelerating their degradation. The compounding effect of preventing both primary failures and secondary damage extends total equipment life well beyond manufacturer estimates based on typical reactive maintenance patterns.

What happens if internet connectivity is lost at a retail location?

Iottive’s architecture includes edge computing devices that process data and generate alerts locally, ensuring critical monitoring continues during connectivity interruptions. Local processing enables immediate threat detection and on-site alerting even without cloud connection. The edge devices buffer performance data during outages, transmitting stored information automatically when connectivity restores to maintain complete historical records without data loss. This hybrid architecture balances the advantages of cloud-based centralized monitoring with the reliability requirements of critical infrastructure monitoring. For multi-location operations, corporate visibility may be temporarily limited to connected locations during outages, but each store maintains full local monitoring capability, ensuring that connectivity issues at one location or in transit networks don’t compromise refrigeration monitoring and protection across the enterprise.

How does Iottive’s solution compare to simply upgrading to newer refrigeration equipment?

Equipment replacement represents massive capital expenditure—commercial refrigeration units cost $5,000-$50,000+ per unit depending on size and application, with walk-in cooler installations reaching six figures. For a grocery store operating 20-40 units, wholesale equipment replacement could exceed $500,000-$1,000,000 per location. Iottive’s predictive maintenance extends the productive lifespan of existing equipment investment by 20-30%, deferring capital replacement while maintaining performance and reliability. Even new equipment benefits from predictive monitoring—ensuring optimal performance from installation, identifying installation defects during warranty periods, and preventing the gradual efficiency degradation that reduces ROI on equipment investment. The platform provides technology-enhanced longevity at a fraction of replacement cost, with documented 12-18 month ROI making it financially superior to premature equipment replacement while delivering many of the same operational benefits.

What training is required for store managers and maintenance staff to use Iottive effectively?

Iottive provides comprehensive user training tailored to different roles: store managers receive dashboard training focused on alert interpretation, response protocols, and compliance reporting; maintenance technicians learn to use predictive insights for service prioritization and root cause diagnosis; corporate facilities teams master enterprise-wide monitoring, performance trending, and multi-location optimization. The training approach emphasizes practical application rather than technical complexity, recognizing that end users need operational proficiency, not engineering expertise. Intuitive interface design minimizes learning curves, with color-coded status indicators, plain-language alerts, and guided workflows for common tasks. Ongoing 24/7 technical support provides assistance for platform questions, alert interpretation, and troubleshooting, ensuring users have expert resources available beyond initial training as they encounter new scenarios or expand platform utilization across additional use cases.

How does Iottive handle refrigeration monitoring for specialty applications like pharmacy cold storage?

Iottive’s platform accommodates specialty refrigeration requirements including pharmaceutical cold storage, which demands stricter temperature control and more rigorous documentation than standard food refrigeration. The system supports custom temperature thresholds for different product categories, tighter alert parameters for temperature-sensitive medications, and enhanced compliance reporting meeting pharmacy regulatory requirements. The same sensor and analytics infrastructure that monitors grocery refrigeration adapts to specialty applications including floral coolers, wine storage, prepared food holding, and frozen goods—each with application-specific temperature ranges, acceptable variation limits, and compliance documentation standards. This flexibility enables retailers operating multiple refrigeration categories to standardize on a single monitoring platform rather than managing separate systems for different applications, simplifying operations while ensuring appropriate monitoring for each product category’s specific requirements.

How Iottive Delivers End-to-End Smart Retail Solutions

1. Retail Strategy & Solution Design

Iottive collaborates with retail leaders, digital heads, store operations teams, and supply chain stakeholders to understand customer journeys, inventory challenges, and growth objectives. This phase includes retail use-case validation, omnichannel architecture design, IoT device selection, AI personalization planning, and defining measurable KPIs such as promotion ROI, stock accuracy, and conversion rates.


2. Smart Systems Engineering & Retail Integration

Iottive engineers scalable Smart Retail solutions by integrating IoT sensors, RFID, smart shelves, digital mirrors, edge devices, and cloud platforms. We ensure seamless connectivity between POS systems, ERP, CRM, warehouse systems, and e-commerce platforms. The focus is on real-time visibility, secure data flow, and unified customer and inventory intelligence across stores and digital channels.


3. Pilot Deployment in Stores & Warehouses

Before enterprise rollout, Iottive deploys pilot solutions in selected retail stores, warehouses, or pharmacy locations. This includes testing AI-driven recommendations, smart inventory tracking, cold chain monitoring systems, and digital try-on experiences. Retailers can validate performance, customer engagement impact, and operational feasibility in live environments before scaling across locations.


4. Customer Experience & Retail Intelligence

Iottive builds intuitive dashboards and retail intelligence platforms that provide real-time insights into:

  • Customer behavior & segmentation
  • Promotion performance & ROI
  • Store-level inventory accuracy
  • Warehouse efficiency metrics
  • Cold chain compliance tracking
  • Online conversion and upsell analytics

Advanced analytics, alerts, and AI-driven insights empower retail teams to make faster, data-driven decisions that improve revenue, reduce losses, and enhance customer satisfaction.


5. Enterprise Rollout & Retail Scale-Up

From MVP to multi-location deployment, Iottive supports solution hardening, cloud scalability, cybersecurity, and long-term support. Smart Retail solutions are designed for:

  • Multi-store expansion
  • Omnichannel integration
  • Regional inventory balancing
  • Cross-border retail operations
  • Continuous optimization using AI insights

Our approach ensures measurable ROI through improved customer engagement, reduced shrinkage, better inventory control, and operational efficiency.


Why Retailers Choose Iottive

  • Proven expertise in Smart Retail & IoT-driven transformation
  • Deep understanding of store operations, warehousing, and pharmacy compliance
  • Seamless integration with POS, ERP, CRM, and e-commerce platforms
  • Secure, scalable, and production-ready retail architectures
  • Strong focus on measurable business outcomes — not just technology

📧 Contact Email: sales@iottive.com

Solving the iOS Background BLE Challenge: How iBeacon Enables Reliable Background Bluetooth Detection

WHITE PAPER

Solving the iOS Background BLE Challenge

How iBeacon Technology Enables Reliable Background Bluetooth Detection on Apple Devices

By Rushabh Champaneri | Founder & CEO, IOTTIVE

March 2026

Download the Full White Paper (PDF)

19 pages with implementation checklists, comparison tables, and architecture diagrams.

Download White Paper

Executive Summary

Every iOS developer building Bluetooth Low Energy (BLE) products eventually hits the same wall: Apple’s aggressive background processing restrictions effectively kill BLE connections the moment users switch away from your app. This isn’t a bug — it’s a deliberate architectural decision by Apple to preserve battery life and protect user privacy.

For businesses building IoT products — from medical wearables to asset tracking systems to smart home devices — this creates a critical reliability gap. Users expect their Bluetooth devices to work seamlessly, whether the app is in the foreground or not. The reality is far more complicated.

This white paper provides a comprehensive technical analysis of iOS Core Bluetooth’s background limitations and presents the iBeacon framework as a proven solution for reliable background device detection. We examine the specific constraints Apple imposes, detail how iBeacon’s deep OS integration bypasses these restrictions, and provide a practical hybrid architecture that combines both technologies for maximum reliability.

Key findings: Core Bluetooth background scanning effectively stops after app suspension, with detection delays measured in minutes rather than milliseconds. iBeacon region monitoring, by contrast, operates at the OS level and can relaunch a terminated app within approximately one second of detecting a beacon — even after the user has force-quit the application.

Section 1: Why iOS Kills Your BLE Connection

Apple’s iOS operating system enforces one of the most aggressive background processing models in the mobile ecosystem. Unlike Android, which allows significant background freedom (at the cost of battery life and security), iOS was designed from the ground up to strictly control what apps can do when they’re not visible on screen.

The Suspension Model

When a user switches away from your app, iOS follows a predictable lifecycle:

  1. Active — The app is in the foreground and receiving events normally.
  2. Background — The app has approximately 10 seconds to complete critical tasks before the system suspends it.
  3. Suspended — The app remains in memory but executes no code. All BLE scanning stops.
  4. Terminated — The system reclaims memory. The app process no longer exists.

For BLE applications, this model creates a fundamental problem: the moment your app leaves the foreground, iOS begins restricting and eventually eliminating your ability to discover and communicate with Bluetooth devices.

Why Apple Made This Choice

  • Battery preservation: Continuous BLE scanning at foreground rates would drain battery life significantly. Apple’s own testing showed that unrestricted background scanning could reduce battery life by 15–25%.
  • Privacy protection: Background BLE scanning can be used for location tracking without user consent. By restricting it, Apple prevents apps from silently monitoring beacon infrastructure.
  • System resource management: With potentially hundreds of apps installed, allowing all of them to maintain active BLE connections would overwhelm the Bluetooth hardware.

The Developer Pain Point

In practice, background mode restrictions mean:

  • Scan intervals increase from milliseconds to seconds (or longer)
  • Duplicate advertisements are coalesced into a single event
  • Non-connectable advertisements are suppressed entirely
  • The CBCentralManagerScanOptionAllowDuplicatesKey parameter is ignored
  • If the user force-quits the app, all BLE state restoration fails

The result: your carefully designed BLE product appears unreliable to users, not because of hardware limitations, but because iOS is actively preventing your app from communicating with its paired devices.

Section 2: Core Bluetooth in the Background — The Reality

Apple provides two Info.plist background modes for Core Bluetooth: bluetooth-central (for scanning and connecting) and bluetooth-peripheral (for advertising). Even with both enabled, the limitations are severe.

What Actually Works

  • Maintaining existing connections: If your app connects to a peripheral while in the foreground, that connection persists in the background.
  • State Preservation & Restoration: If the system terminates your app to reclaim memory, iOS can relaunch it in the background when a Bluetooth event occurs.
  • Filtered scanning: If you specify exact service UUIDs in your scan filter, iOS will wake your app when it detects matching advertisements — but with significant delays.

What Breaks

  • Unfiltered scanning: Passing nil for service UUIDs returns zero results in the background.
  • Discovery speed: Background scan callbacks can be delayed by 30 seconds to several minutes.
  • Force-quit recovery: When the user explicitly kills the app, ALL Core Bluetooth state restoration fails.
  • Device reboot: After a device reboot, Core Bluetooth background scanning recovery is inconsistent.
  • Two-device background problem: When both iOS devices are in the background, neither can discover the other due to the “overflow area” limitation.

Section 3: How iBeacon Solves the Background Problem

iBeacon is Apple’s proprietary proximity detection protocol, built on BLE hardware but managed through the CoreLocation framework rather than CoreBluetooth. This distinction is critical — it means iBeacon detection operates at the operating system level, bypassing the restrictions that cripple standard BLE scanning.

Why iBeacon Works When Core Bluetooth Doesn’t

1. OS-Level Region Monitoring

When you register a CLBeaconRegion, iOS adds it to the system’s location monitoring infrastructure. This runs continuously at the hardware/OS level, completely independent of your app’s lifecycle state. The monitoring works even when your app is in the background, suspended, terminated, or force-quit by the user (iOS 7.1+).

2. App Relaunch Capability

When iOS detects entry into a monitored beacon region, it can relaunch your terminated app into the background with approximately 10 seconds of execution time.

3. Consistent Detection Speed

Independent testing by Classy Code measured iBeacon detection within approximately 1 second — orders of magnitude faster than Core Bluetooth background scanning.

4. Battery Efficiency

Because region monitoring is managed by the OS using optimized hardware scanning patterns, it consumes significantly less battery than app-level Core Bluetooth scanning.

Section 4: Core Bluetooth vs. iBeacon — Complete Comparison

Capability Core Bluetooth iBeacon (CoreLocation)
Background Scanning Limited (must filter by UUID) Full region monitoring
Works After App Killed Yes (state restoration only) Yes (always)
Works After Force-Quit No Yes (iOS 7.1+)
Works After Reboot Limited Yes (~5 min init)
Detection Speed (BG) Seconds to minutes ~1 second
Battery Efficiency Moderate High (OS-optimized)
Max Monitored Items System-managed 20 regions per app
Custom Data Transfer Full GATT access UUID / Major / Minor only
Proximity Estimation Manual RSSI calculation Built-in (immediate/near/far)
Location Permission Not required Required (Always)
Region Monitoring Not available Entry / Exit events
OS-Level Integration App-level only Deep OS integration
Recommended Use Data transfer, connected sessions Background detection, triggers

Key takeaway: Core Bluetooth excels at data transfer and connected sessions. iBeacon excels at reliable background detection and presence monitoring. The optimal architecture uses both.

Section 5: The Hybrid BLE + iBeacon Architecture

The most robust iOS Bluetooth implementations combine both technologies in a layered approach:

Layer 1: iBeacon for Background Detection

  • Configure your BLE peripheral to broadcast iBeacon advertisements alongside custom BLE services
  • Register CLBeaconRegion monitoring in the iOS app
  • iOS detects beacon presence at the OS level, regardless of app state
  • On region entry: app is relaunched/woken into background

Layer 2: Core Bluetooth for Data Transfer

  • After iBeacon triggers app wake-up, initiate Core Bluetooth connection
  • Connect to the peripheral’s GATT services for actual data exchange
  • Read sensor data, write commands, subscribe to notifications
  • Use state preservation to maintain connection when backgrounded

Layer 3: Application Logic

  • Process incoming data and update local storage
  • Send local notifications for user-facing alerts
  • Sync data to cloud services during background execution windows
  • Manage connection lifecycle and error recovery

Dual Advertising on the Peripheral

Most modern BLE SoCs (Nordic nRF52/53/54, ESP32, Dialog, etc.) support multiple advertising sets:

  • Advertising Set 1: Standard iBeacon format with your registered UUID, Major, and Minor values. Non-connectable.
  • Advertising Set 2: Custom BLE service advertisement with GATT server. Connectable.

Section 6: Real-World Use Cases

Medical Wearables & Remote Patient Monitoring

iBeacon region monitoring ensures the phone detects the wearable whenever it’s within range, automatically syncing pending health data (heart rate, SpO2, ECG, blood glucose). Eliminates the “please open the app to sync” problem.

Asset Tracking & Logistics

BLE tags on inventory broadcast iBeacon signals. iOS devices register region monitoring for warehouse zones. When a worker’s device enters a zone, the app wakes, ranges nearby tags, and logs which items are present. The BLE IC market is projected to reach $5.33 billion by 2032.

Smart Locks & Access Control

The smart lock broadcasts iBeacon signals. The user’s phone detects region entry from several meters away. The app wakes, establishes a Core Bluetooth connection, performs cryptographic authentication, and sends the unlock command — true hands-free access.

Retail & Proximity Marketing

Store beacons define entry zones. The retailer’s app monitors these regions. On entry, relevant offers are displayed via local notifications. Retail and healthcare account for over 60% of global beacon adoption.

Section 7: Implementation Checklist

Peripheral / Firmware

  • ☐ Configure dual advertising sets (iBeacon + custom BLE service)
  • ☐ Register a unique iBeacon UUID for your deployment
  • ☐ Define Major/Minor numbering scheme for device hierarchy
  • ☐ Set appropriate advertising intervals (100–350ms for iBeacon)
  • ☐ Implement GATT services for data transfer
  • ☐ Test with Nordic nRF52/53/54 or ESP32 development boards

iOS Application

  • ☐ Add bluetooth-central background mode to Info.plist
  • ☐ Add location background mode to Info.plist
  • ☐ Request “Always” location permission with clear purpose string
  • ☐ Register CLBeaconRegion monitoring (max 20 regions)
  • ☐ Implement didEnterRegion / didExitRegion delegates
  • ☐ Initiate Core Bluetooth connection on region entry
  • ☐ Implement CBCentralManager state preservation and restoration
  • ☐ Handle edge cases: Bluetooth off, Location Services disabled, permission denied

Testing & Validation

  • ☐ Test background detection after app suspension
  • ☐ Test detection after force-quit
  • ☐ Test detection after device reboot
  • ☐ Measure detection latency in background vs. foreground
  • ☐ Validate battery impact over 24-hour periods
  • ☐ Test region entry/exit with multiple nearby beacons

Free 30-Minute BLE Architecture Consultation

Struggling with iOS background BLE reliability? Our engineers have solved this problem across dozens of commercial products. Let us review your architecture and recommend the right approach for your specific use case.

Email: rushabh@iottive.com

Website: www.iottive.com

Location: Ahmedabad, India

Why Retail Refrigeration Failures Cause Major Losses – How Iottive Predictive Maintenance Prevent it

A broken cooler in a store is more than a repair ticket. It’s a direct hit to the bottom line. Spoiled stock, halted operations, and emergency costs add up fast. Without real-time visibility, teams are stuck in a reactive cycle.

retail refrigeration monitoring system

Leading companies are changing this game. Giants like Amazon and Walmart invest heavily in connected technology. They create data-driven environments to protect their inventory and meet shopper demands, even during unexpected downtime.

Iottive offers a modern, proactive shield against these failures. By integrating sensors for temperature and performance with edge analytics, the system spots tiny anomalies. It triggers alerts long before a unit fails. This shift from reactive fixing to planned care is transformative.

This approach protects more than product quality. It streamlines management of the supply chain and labor. The result is higher operational efficiency, lower energy use, and seamless customer experiences at the checkout. It turns a major cost center into a pillar of reliability.

Key Takeaways

  • Refrigeration failures lead to significant financial loss through spoiled inventory and disrupted store operations.
  • A lack of real-time equipment data forces a costly, reactive maintenance model.
  • Industry leaders use advanced connectivity and sensor technology to create resilient, data-driven stores.
  • Proactive monitoring detects small issues early, preventing major equipment breakdowns and downtime.
  • Implementing a data-led approach improves overall business efficiency, reduces waste, and protects product quality.
  • This technology directly supports a better, more reliable shopping experience for customers.
  • The goal is to transform refrigeration management from a hidden risk into a controlled, optimized process.

Understanding the Retail Landscape in the Age of Smart IoT

Consumer behavior and technological progress are reshaping how goods are sold and managed. The internet of things enables businesses to collect and analyze vast amounts of data. This shift is creating a more responsive and intelligent marketplace.

McKinsey estimates generative AI could unlock $240-$390 billion in value for the retail sector. This potential underscores a fundamental change in approaching customer experience and store operations.

Evolving Customer Expectations and Market Trends

Shoppers now demand seamless, personalized service. They expect frictionless shopping both online and inside physical stores. Meeting these demands requires a deep understanding of buyer habits.

Modern retailers leverage connected devices to gain real-time insights. This data-driven approach allows for tailored interactions that drive sales and build loyalty. The goal is to optimize every touchpoint.

retail landscape smart iot

Technological Innovations Transforming Retail

Advanced sensors and connectivity form the backbone of modern systems. These tools provide unprecedented visibility into inventory management and the supply chain. They turn raw information into actionable intelligence.

Such innovations directly improve energy efficiency and operational agility. Analytics help the retail industry anticipate needs and streamline processes. This technology is no longer a luxury; it’s a core component for staying competitive.

Implementing these solutions ensures businesses can deliver consistent, high-quality experiences. The entire industry is moving towards a more connected and intelligent future.

The Role of Retail Predictive Maintenance, Smart Retail Solution, and AIoT in Retail Industry

At the heart of a resilient store is a strategy that anticipates problems rather than just reacting to them. This proactive shield is built on interconnected devices and intelligent analytics.

It transforms essential care from a cost center into a source of reliability.

retail predictive maintenance analytics

How Predictive Analytics Prevents Costly Refrigeration Failures

Advanced sensors continuously collect performance data. Sophisticated algorithms then analyze this information for subtle patterns.

“The shift from scheduled checks to condition-based monitoring reduces unplanned downtime by over 30%,” notes a recent industry report on operational efficiency.

For example, Whole Foods uses zone-based climate control. This system monitors temperature and humidity across different store areas.

It preserves product freshness by making tiny adjustments automatically. This is a practical application of these intelligent solutions.

Maintenance Approach Data Usage Cost Impact Primary Outcome
Reactive (Fix-on-Failure) None High emergency repair & spoilage costs Unplanned downtime & lost sales
Preventive (Scheduled) Low (time-based) Moderate, includes unnecessary service Reduced major failures
Predictive (Condition-Based) High (real-time sensor analytics) Low, planned parts & labor Maximized uptime & asset life

This technology provides actionable insights directly to management. Teams can schedule service during off-peak hours.

The result is seamless store operations and protected customer experiences. It ensures every shopping trip meets expectations.

Innovative Approaches to Inventory Management and Preventive Maintenance

The backbone of a profitable store lies in precise control over what’s on the shelves and what’s running behind the scenes. Modern solutions merge real-time inventory oversight with equipment care. This dual strategy prevents loss and ensures smooth operations.

Real-Time Inventory Visibility and Tracking

Knowing exactly what you have, right now, is a game-changer. Weight-detecting sensors in produce bins provide continuous data on stock levels.

This live information stream eliminates guesswork. It boosts operational efficiency and cuts waste dramatically. Teams gain actionable insights to keep products moving.

real time inventory tracking

Automated Stock Replenishment Strategies

When inventory dips below a set point, the system can trigger a restock request automatically. This reduces the time and labor staff spend on manual counts.

Automation ensures popular items are always available for customers. It also tightens the supply chain and protects product quality. The business runs on reliable, up-to-the-minute data.

Management Method Data Source Business Impact
Manual Counts Periodic staff checks High error rate, labor-intensive
Scheduled Audits Planned cycle counts Better accuracy, but delayed response
Automated Sensor Systems Continuous IoT device feeds Precision, low labor cost, real-time action

Linking this to preventive maintenance creates a resilient retail environment. Monitoring cooler performance alongside stock levels prevents costly surprises. This integrated approach is the future of store management.

Smart Technologies Enhancing Customer Experience and Operational Efficiency

The final moment of a shopping trip—the checkout—is undergoing a radical transformation. Modern tools now work to elevate the shopper’s journey while streamlining behind-the-scenes work. This dual focus creates a more responsive and profitable business.

frictionless checkout technology

Frictionless Checkout and Personalized Engagement

Amazon’s Just Walk Out technology epitomizes this shift. Ceiling cameras and shelf sensors track items automatically. Shoppers are charged as they leave, eliminating lines entirely.

This system does more than speed up the checkout. It reallocates staff to tasks that improve store ambiance and service. Labor costs are better managed, boosting overall operational efficiency.

Checkout Method Core Technology Customer Experience Operational Impact
Traditional Lane Manual scanning, cash register Potential for wait times, standard service High labor requirement, slower throughput
Self-Service Kiosk Barcode scanners, touchscreen POS More control, but still requires customer action Reduced cashier needs, moderate space efficiency
Frictionless System Computer vision, weight sensors, AI analytics Seamless, fast, and highly convenient Low direct labor, maximizes space, provides rich behavioral data

The data from these systems fuels personalized engagement. Analytics reveal shopping patterns, helping retailers offer the right product at the right time.

“Frictionless commerce is about removing points of frustration to build loyalty. The data it generates is the new currency for personalization,” states a report on modern retail trends.

These solutions also optimize energy use and inventory management. Real-time insights ensure shelves are stocked, protecting product quality. The result is a superior experience that keeps customers returning.

Integrating Connectivity and Reliability in Retail Operations

When a primary network fails, the entire shopping experience can grind to a halt. Modern store operations require seamless data flow between systems, sensors, and payment terminals. This infrastructure is the nervous system of a contemporary business.

Multi-Network Failover Solutions for Seamless Transactions

Advanced solutions automatically switch between cellular, Wi-Fi, and satellite links. This keeps point-of-sale systems active during outages.

multi-network connectivity retail

Shoppers complete purchases without interruption. The customer experience remains protected, preserving sales and loyalty.

Centralized POS and System Monitoring

A single dashboard provides real time visibility into all store devices. Lowe’s uses NVIDIA’s digital twin platform for this purpose.

It analyzes shopper movement and staff routing to improve layout efficiency. This centralized management offers powerful insights.

Ensuring Robust Internet and Sensor Connectivity

Reliable links between inventory trackers and backend analytics are critical. They ensure stock levels and product quality data are always current.

These strategies form the backbone of a resilient retail environment.

Connectivity Strategy Core Technology Business Impact
Single Network Primary ISP connection only High risk of complete downtime during outages
Multi-Network Failover Automatic switching between cellular, Wi-Fi, satellite Continuous operations, protected transaction flow
Mesh Sensor Networks Interconnected devices with redundant pathways Ultra-reliable data collection from all store areas

Challenges and Strategies for Implementing Smart Retail Solutions

Businesses aiming to modernize their operations must navigate a complex landscape of legacy infrastructure and new devices. Success requires a deliberate approach to tackle integration, security, and data complexity.

Overcoming Integration, Security, and Complexity Issues

Connecting older systems with modern sensors and devices is a major hurdle. Retailers need seamless data flow between inventory trackers, point-of-sale terminals, and backend analytics.

Protecting customer information is paramount. Every new technology deployment must include robust security protocols for all connected devices.

Companies like UPS show how data-driven strategies solve complex problems. Their ORION system optimizes the supply chain using traffic and weather analytics.

This reduces fuel use and improves delivery efficiency. It’s a model for the industry.

Challenge Area Key Issue Recommended Strategy
System Integration Legacy hardware incompatible with new IoT sensors Phased rollout with middleware and API gateways
Data Security Risk to customer privacy from connected devices End-to-end encryption and regular security audits
Operational Complexity Managing vast data from multiple store locations Centralized dashboard with actionable insights

Addressing these issues lets retailers deploy solutions that boost checkout speed and product management. The result is a stronger, more competitive store operation.

Conclusion

The journey toward a truly intelligent store is defined by turning data into decisive action. The retail industry is shifting from a reactive model to one powered by foresight and analytics.

This transformation is essential. Leveraging real-time insights from connected systems allows retailers to create superior customer experiences. It keeps shoppers engaged and loyal.

Proactive care for equipment and inventory is no longer optional. It is a core requirement for optimizing store operations and controlling costs.

As technology evolves, the ability to gain actionable insights will separate leaders from followers. Businesses that invest now will be ready for tomorrow’s demands.

Ultimately, integrating these intelligent solutions ensures every shopping trip is seamless, efficient, and personalized.

FAQ

How does a predictive maintenance system prevent costly refrigeration breakdowns in stores?

A predictive maintenance system uses sensors and analytics to monitor equipment health in real time. It analyzes data like temperature and compressor cycles to spot small issues before they become major failures. This proactive approach prevents spoiled goods, reduces emergency repair costs, and ensures food safety and customer trust.

What is the role of Smart IoT and AIoT in modern store operations?

A: Smart IoT and AIoT (AI-powered Internet of Things) connect physical devices like sensors and scales to a central platform. This creates an intelligent network that automates tasks, provides deep insights, and optimizes everything from inventory counts to energy use. It transforms data into actionable strategies for better management and efficiency.

How do smart solutions improve inventory control and prevent stockouts?

These solutions provide real-time visibility into stock levels on shelves and in the backroom. Automated tracking triggers alerts when items are low, enabling timely restocking. This accuracy minimizes lost sales from empty shelves, reduces excess inventory holding costs, and streamlines the entire supply chain.

Can this technology enhance the shopper’s in-store experience?

Absolutely. Technologies like frictionless checkout speed up the payment process. Meanwhile, data analytics can enable personalized promotions sent to a customer’s phone. This blend of convenience and personalization creates a smoother, more engaging shopping journey, directly boosting satisfaction and loyalty.

What are the biggest challenges when implementing these connected systems, and how are they solved?

Key challenges include integrating new technology with legacy systems, ensuring data security, and managing complexity. Leading solutions from providers like Iottive address this with secure, scalable platforms that offer simple integration and reliable connectivity. A phased implementation approach with clear staff training is also crucial for success.

Why is reliable connectivity so critical for a smart store’s success?

A> Every part of a smart store—from point-of-sale systems to climate sensors—depends on constant data flow. Unreliable connectivity can halt transactions, blind management to real-time issues, and disrupt operations. Robust multi-network solutions with automatic failover ensure devices stay online, protecting sales and operational efficiency.
 

How Iottive Delivers End-to-End Smart Retail Solutions

1. Retail Strategy & Solution Design

Iottive collaborates with retail leaders, digital heads, store operations teams, and supply chain stakeholders to understand customer journeys, inventory challenges, and growth objectives. This phase includes retail use-case validation, omnichannel architecture design, IoT device selection, AI personalization planning, and defining measurable KPIs such as promotion ROI, stock accuracy, and conversion rates.


2. Smart Systems Engineering & Retail Integration

Iottive engineers scalable Smart Retail solutions by integrating IoT sensors, RFID, smart shelves, digital mirrors, edge devices, and cloud platforms. We ensure seamless connectivity between POS systems, ERP, CRM, warehouse systems, and e-commerce platforms. The focus is on real-time visibility, secure data flow, and unified customer and inventory intelligence across stores and digital channels.


3. Pilot Deployment in Stores & Warehouses

Before enterprise rollout, Iottive deploys pilot solutions in selected retail stores, warehouses, or pharmacy locations. This includes testing AI-driven recommendations, smart inventory tracking, cold chain monitoring systems, and digital try-on experiences. Retailers can validate performance, customer engagement impact, and operational feasibility in live environments before scaling across locations.


4. Customer Experience & Retail Intelligence

Iottive builds intuitive dashboards and retail intelligence platforms that provide real-time insights into:

  • Customer behavior & segmentation
  • Promotion performance & ROI
  • Store-level inventory accuracy
  • Warehouse efficiency metrics
  • Cold chain compliance tracking
  • Online conversion and upsell analytics

Advanced analytics, alerts, and AI-driven insights empower retail teams to make faster, data-driven decisions that improve revenue, reduce losses, and enhance customer satisfaction.


5. Enterprise Rollout & Retail Scale-Up

From MVP to multi-location deployment, Iottive supports solution hardening, cloud scalability, cybersecurity, and long-term support. Smart Retail solutions are designed for:

  • Multi-store expansion
  • Omnichannel integration
  • Regional inventory balancing
  • Cross-border retail operations
  • Continuous optimization using AI insights

Our approach ensures measurable ROI through improved customer engagement, reduced shrinkage, better inventory control, and operational efficiency.


Why Retailers Choose Iottive

  • Proven expertise in Smart Retail & IoT-driven transformation
  • Deep understanding of store operations, warehousing, and pharmacy compliance
  • Seamless integration with POS, ERP, CRM, and e-commerce platforms
  • Secure, scalable, and production-ready retail architectures
  • Strong focus on measurable business outcomes — not just technology

📧 Contact Email: sales@iottive.com

How Iottive Helps Monitor and Reduce Peak Energy Consumption in Manufacturing Plants

Manufacturing facilities face a silent threat to their bottom line. Rising electricity bills, driven largely by demand charges during periods of high use, can erode profitability without warning.

Often, plant managers lack the granular visibility needed to see which machines or processes are causing these costly spikes. This blind spot makes effective management nearly impossible.

industrial energy monitoring dashboard

Modern industrial energy monitoring systems change this dynamic. Tools like the eGauge Pro have delivered real-time, second-by-second data since 2008, capturing even minor fluctuations in power draw.

This level of detail is crucial. Advanced setups can track up to 64 separate power sources simultaneously, from individual production lines to HVAC systems.

With this comprehensive data, businesses can move from reactive bill-paying to proactive control. Iottive integrates this intelligence into a cohesive platform for smarter decision-making.

The result is a dual win: significant operational savings and a reduced environmental footprint. This guide explores the practical steps to achieve both.

Key Takeaways

  • Gain real-time, machine-level visibility into power usage to uncover hidden inefficiencies.
  • Avoid expensive utility demand charges by identifying and managing periods of highest consumption.
  • Integrate renewable sources and storage to create a more resilient and sustainable power profile.
  • Leverage proven technology that provides second-by-second data for accurate analysis and forecasting.
  • Monitor dozens of energy streams from a single platform for complete facility oversight.
  • Reduce operational costs and carbon emissions through data-driven optimization strategies.

Overview of Peak Energy Challenges in Manufacturing Plants

Manufacturing plants frequently encounter steep, hidden fees on their electricity statements due to collective high usage periods. Utility providers implement these peak demand rates to discourage spikes that threaten the stability of the entire electrical grid.

The financial impact is direct and substantial. These demand charges can add hundreds of dollars to a facility’s monthly utility bills, eroding profit margins without warning.

peak energy challenges manufacturing

Traditional utility meters are a major part of the problem. They provide a total monthly usage figure but fail to track which specific machines or processes drive these costly spikes. This leaves site managers without the actionable data needed for effective control.

Identifying the liable equipment requires high-resolution submetering hardware. By analyzing detailed load profiles, managers can pinpoint exactly when and where peak demand occurs during production cycles.

Overcoming these challenges demands a fundamental shift. Moving from simple monthly kWh tracking to a granular, real-time view of power consumption is essential for true cost management and operational efficiency.

Why Industrial Energy Monitoring is Essential

Modern manufacturing requires more than just total power readings to optimize efficiency and reduce expenses. Detailed visibility into electrical loads transforms how facilities manage both equipment health and electricity costs.

Traditional submetering hardware creates significant limitations. These outdated systems often lack modern communication features and incur high maintenance expenses.

The eGauge Pro system represents a fundamental advancement. With 30 CT inputs, a single unit can replace 10-15 traditional submeters, dramatically lowering installation costs.

modern energy monitoring equipment

This consolidated approach enables proactive equipment maintenance. Managers can identify potential issues before they disrupt production lines, preventing costly downtime.

Modern solutions track data from up to 64 different sources. They support cellular, WiFi, and Bluetooth communication for flexible integration.

Feature Traditional Submeters Modern Monitoring System
Installation & Hardware Cost High (multiple units needed) Low (single consolidated unit)
Maintenance Burden Significant ongoing expense Minimal with modern components
Data Granularity & Sources Limited, often single-point High, up to 64 sources tracked
Communication & Integration Basic or non-existent Cellular, WiFi, Bluetooth enabled
Primary Benefit Basic usage tracking Proactive management & cost control

Organizations without proper monitoring often pay for electricity they don’t effectively use. Poor power quality and unmetered consumption create hidden expenses on monthly bills.

Transitioning to advanced systems delivers clear savings. It provides the data needed for informed decision-making across the entire facility.

Smart Energy: The Future of Energy Management in Industry

Forward-thinking factories are adopting integrated platforms that turn raw electrical data into actionable insights. This approach moves beyond basic meters to create a cohesive management ecosystem.

Modern systems rely on three core components. A centralized gateway acts as the brain, collecting information from all connected devices and equipment.

smart energy management platform interface

The software layer uses sophisticated algorithms to set rules. It prioritizes power usage and manages loads to maximize self-sufficiency and efficiency.

Providers like McPherson Controls offer advanced solutions that prioritize customization. This allows any business to tailor its power strategy, drawing electricity during cheaper off-peak periods to cut costs.

The user interface completes the system. It lets teams visualize live and historical data, track key performance indicators, and manage control across an entire facility.

This holistic platform delivers significant savings and helps companies meet sustainability goals. It represents the definitive future of industrial power analysis and demand response.

Real-Time Data: Enhancing Efficiency and Decision Making

Granular, second-by-second updates move facility management from a guessing game to a precise science. Tools like the eGauge Pro provide graphical updates precise enough to see the effect of powering a single LED bulb. This immediacy collapses the decision-making timeline.

Benefits of Real-Time Data Analysis

Managers see the direct impact of initiatives instantly. This allows for immediate verification of savings and operational tweaks.

More importantly, it enables proactive equipment care. Advanced users leverage this speed to tackle voltage imbalances and harmonic distortion before they cause damage. This prevents costly downtime and repairs.

real-time data analysis dashboard manufacturing

The need to review historical reports for basic insights is eliminated. Decisions are based on live conditions, streamlining the entire management process.

Case Examples from Modern Manufacturing

Forward-looking plants use this visibility to spot waste as it happens. They can then take corrective action within the same production cycle, not weeks later.

Advanced analytic tools allow deep research into power quality. Teams analyze power factor, phase offsets, and polarity with full control. This level of analysis drives further efficiency gains.

Ultimately, this real-time approach transforms raw data into a powerful tool for controlling costs and boosting overall facility performance.

Integrating Hardware and Software for Comprehensive Energy Data Insights

The true power of an energy monitoring system lies in its ability to transform raw electrical signals into actionable business intelligence. This seamless integration turns collected measurements into a powerful platform for strategic decision-making.

integrating hardware and software energy data

Advanced Analytics Tools and Techniques

Sophisticated software provides deep diagnostic tools. For example, an oscilloscope feature allows expert users to research power quality with precision.

Companies can feed data into secondary databases. This enables complex calculations that standard monitoring software cannot handle, driving greater efficiency.

Leveraging Spreadsheet Exports and JSON API Integration

CSV exports are perfect for bill generation and advanced analysis. They work seamlessly with programs like Microsoft Excel.

The JSON API, offered at no cost, expands the data toolset. Developers can integrate external sources like weather information to understand climate control usage patterns and related costs.

Data Access Method Primary Use Case Key Benefit
CSV Export Advanced calculations & billing reports Universal spreadsheet compatibility
JSON API Integrating third-party data (e.g., weather) Enables custom applications & insights
Oscilloscope Tool Deep power quality research Granular diagnostic capability for experts

This combination of hardware and software features makes modern solutions like the eGauge Pro a dominant contender in the submetering market.

Effective Strategies for Monitoring peak energy consumption

A strategic framework is essential for pinpointing the exact sources of costly power surges within a facility. This approach moves beyond simple tracking to actively manage demand.

Advanced systems like the eGauge Pro capture a location’s baseline load and identify spike patterns. This data pinpoints liable equipment and determines when peak charges occur.

Managers use this intelligence to modify load profiles effectively. They ensure operations stay within the limits set by utility providers, avoiding penalty costs.

Proactive monitoring compares similar loads and provides early warnings. This helps prevent capital loss from overloaded or failing equipment before damage happens.

Strategic Action Tool/Data Used Primary Outcome
Identify High-Usage Areas Baseline load analysis from submeters Pinpoint exact sources of demand charges
Modify Operational Schedules Real-time consumption data Stay within utility limits and avoid fees
Compare Equipment Performance Load comparison alerts Prevent failures and reduce repair costs
Implement Load Shifting Historical usage patterns Lower peak demand and overall electricity bills

Implementing these strategies helps building managers address issues proactively. It ensures long-term reliability for the entire facility while achieving significant savings.

Data Collection and Accuracy: Utilizing Smart Meters and Sensors

The precision of energy insights depends entirely on the quality and granularity of the underlying measurement technology. Foundational hardware like current transformers captures raw electrical signals from each circuit or machine.

Sensor Technologies and Wireless Integration

Current sensors, or CTs, measure alternating current directly at the source. They provide high-accuracy readings, typically averaging consumption every 30 seconds.

Modern versions leverage wireless, energy-harvesting designs. These units clip around power cables without needing batteries or disruptive wiring during setup.

Available in ranges from 1A to 600A, they accommodate various cable diameters. This flexibility ensures compatibility with different machines across a facility.

Data Aggregation and Granular Monitoring

Smart gateways collect readings from all sensors. They convert this data into industry-standard JSON format for cloud or local server transmission.

This process enables tracking of every individual machine’s electricity use. Organizations can pinpoint exactly where power is used most and where waste occurs.

Because these meters are platform agnostic, they integrate with any IoT software. This expands the potential for customized data analysis and insight across facilities.

Enhancing Energy Management with Alerts and Automated Responses

Automated alerts serve as the first line of defense against unexpected equipment failures. They transform how a facility responds to operational anomalies, shifting from reactive fixes to proactive control.

Proactive Alert Systems for Equipment Monitoring

Advanced systems like the eGauge Pro send instant notifications via text and email. This allows teams to monitor for unusual activity and address problems before they escalate.

Commercial assets, such as refrigeration units, require constant oversight. A system collapse can mean significant capital loss and unhappy stakeholders.

Setting up automatic warnings for elevators and HVAC units speeds up repairs. Property managers can keep tenants satisfied and maintain smooth operations.

These automated responses free up valuable time for professionals. Instead of babysitting troublesome equipment, they can expand their service offerings.

Renewable energy stakeholders rely on these alerts to protect their investments. They ensure systems provide expected returns and address any downtime without delay.

Alerts can be configured for inadequate performance, like a drop in solar PV production. This enables building managers to intervene swiftly, preventing serious damage to operations.

Optimizing Manufacturing Operations Through Energy Data Insights

Optimizing plant operations begins with understanding the specific power characteristics of each machine. Detailed data reveals hidden inefficiencies that impact both equipment health and utility bills.

This intelligence transforms how managers maintain their facility and control expenses.

Load Analysis and Submetering Benefits

Load analysis pinpoints machines causing low power factor. This condition leads to higher electricity costs from utility providers.

Advanced solutions like the eGauge Pro measure power factor on up to 30 sources at once. This saves large plants the time of moving a single circuit meter.

Submetering brings fairness to multi-tenant buildings. It allocates energy costs accurately based on actual consumption.

Tenant satisfaction improves when bills reflect real usage. This also encourages lower overall energy use.

Approach Cost Accuracy Tenant Impact Operational Insight
Traditional Allocation (Square Footage) Low – Estimates only Often leads to disputes None – No machine-level data
Modern Submetering High – Based on actual use Promotes fairness & conservation High – Identifies inefficient equipment

Tracking power quality values ensures you aren’t bleeding money. Understanding these metrics is difficult without a proper power meter.

Operations improve by using data to verify equipment health. Problems are identified before they disrupt the business.

A single interface provides all necessary data. Building managers save time and avoid errors in performance analysis.

Case Studies: Successful Industrial Applications

Across various sectors, documented successes reveal the tangible benefits of integrating precise data collection with renewable sources. These real-world applications provide a blueprint for achieving both financial and operational goals.

Real-world Examples of Energy Savings

Revenue-grade accuracy is critical for investors. Tools like the eGauge Pro track Solar Renewable Energy Credits (SRECs) with precision, turning solar PV production into a verifiable income stream.

This level of analysis ensures photovoltaic and wind systems operate at maximum returns. Continuous monitoring prevents unexpected drops in production, safeguarding investments.

Battery storage solutions are gaining traction in commercial settings. When sized correctly using detailed data, they effectively reduce peak demand charges from the utility grid.

Pairing batteries with solar arrays amplifies savings. It allows a facility to align its electricity use with solar availability, cutting costs and boosting self-sufficiency.

Simplifying inverter management is another key advantage. The platform works with all brands, eliminating complex communication protocols and streamlining oversight.

These case studies prove that preventing production loss through vigilant performance tracking improves overall efficiency. The result is lower utility bills and a stronger bottom line.

The Role of Cloud-Based Platforms and User Interfaces in Energy Monitoring

The evolution of user interfaces in energy monitoring has shifted control from static reports to dynamic, interactive dashboards. These cloud-based platforms provide a single point of access for overseeing multiple facilities from any location.

This accessibility transforms raw data into a strategic business tool. Managers gain a unified view of operations without being on-site.

Interactive Graphical Interfaces and Toolsets

Modern software like the eGauge UI offers powerful graphical tools. Users can view historical and live data for up to 30 years through a convenient interface.

The interactive graphs allow teams to combine and compare multiple data points. They can adjust the view to focus on specific areas of interest for deeper analysis.

This visual approach simplifies complex electrical measurements. It empowers faster decision-making and better control over systems.

System Integration and Customization Capabilities

Integration is enhanced by portfolios like eGuard. This platform is designed for site administrators who need a summary of many devices from one place.

Customization capabilities are a key advantage. Users can organize the portfolio by site name, production value, or even device temperature for better management.

The ability to place a company logo on the interface provides a tool for self-promotion for installers. It strengthens brand presence directly within the monitoring solutions.

Local storage ensures energy information is available for the lifetime of the meter. It bypasses the need to rely on third-party servers, enhancing data security and longevity.

Facility managers can download information directly from a web browser. This streamlines reporting and reduces operational costs.

Conclusion

Adopting a data-centric approach to power management is no longer optional for competitive manufacturing sites. Intelligent systems are essential for optimizing usage and boosting operational efficiency.

By leveraging advanced tools like the eGauge Pro, businesses gain the visibility needed to reduce peak demand and lower electricity bills. The integration of hardware and software creates a robust foundation for tracking consumption and identifying areas for significant cost savings.

Proactive monitoring and automated alerts ensure equipment failures are addressed immediately. This prevents capital loss and maintains high production standards across the facility.

As the market for efficient solutions grows, adopting these technologies is critical for long-term sustainability and competitive advantage. Organizations that prioritize data-driven decision-making will be better positioned to navigate the complexities of modern industrial energy requirements.

FAQ

What is the biggest challenge in managing power use for a factory?

The primary challenge is often unexpected demand spikes. These surges, often caused by multiple heavy machines starting simultaneously, lead to high costs on utility bills. Without proper visibility, it’s hard to predict and control these events.

How does real-time information improve operational efficiency?

Live data allows facility managers to see exactly how and when electricity is used. This enables immediate adjustments, like staggering the start-up of large loads or identifying malfunctioning equipment, leading to better performance and lower bills.

What are the core components of a modern monitoring system?

A complete solution combines hardware and software. It typically uses smart meters and sensors installed at key points to collect information. This data is then sent to a cloud-based platform for analysis and reporting through an easy-to-use dashboard.

Can this technology help with sustainability goals?

A> Absolutely. By pinpointing waste and improving efficiency, businesses significantly reduce their overall consumption. This not only cuts costs but also lowers the facility’s carbon footprint, supporting broader environmental targets.

How do alerts and automated responses work?

You can set custom thresholds for power use. If usage approaches a critical level, the system sends an instant alert via email or SMS. More advanced setups can trigger automated control actions, like temporarily turning off non-essential loads to avoid a peak.

What is submetering and why is it valuable?

Submetering involves installing additional measurement devices on specific production lines or areas. This provides granular insights into which processes or departments are the most energy-intensive, enabling targeted management and accountability.

How does a cloud-based platform benefit my business?

A cloud platform offers secure, remote access to your facility’s data from any internet-connected device. It provides powerful tools for visualization, reporting, and sharing information across teams, ensuring everyone makes decisions based on the same accurate analysis.

Is this type of system difficult to integrate with existing equipment?

Not typically. Leading solutions are designed for flexible integration. They can connect with existing meters, sensors, and building management systems. Software often includes features like spreadsheet exports and API access for easy data sharing with other business tools.
 

How Iottive Delivers End-to-End IIoT Solutions

1. Concept & Solution Design

Iottive works closely with plant teams, engineering leaders, and stakeholders to understand operational challenges, asset behavior, and production goals. This phase includes use-case validation, system architecture design, sensor selection, connectivity planning, and defining measurable business outcomes.


2. Engineering & System Integration

Iottive engineers industrial-grade IIoT solutions by integrating sensors, PLCs, SCADA systems, gateways, and industrial protocols such as OPC UA, Modbus, MQTT, and BLE. The focus is on reliable data acquisition, secure communication, and seamless integration with existing automation infrastructure.


3. Prototyping & Pilot Deployment

Rapid prototyping enables manufacturers to validate concepts on the shop floor before full-scale rollout. Iottive develops functional prototypes, edge analytics, dashboards, and mobile applications to test performance, data accuracy, and operational feasibility in real manufacturing environments.


4. Product Experience & Data Intelligence

Iottive designs intuitive web and mobile dashboards that provide real-time visibility into machine health, production metrics, and operational KPIs. Advanced analytics, alerts, and visualization tools empower plant teams to take proactive, data-driven decisions with minimal complexity.


5. Commercialization & Scale-Up

From MVP to enterprise deployment, Iottive supports product hardening, scalability, cloud or hybrid deployments, and long-term maintenance. Solutions are designed for multi-plant rollout, system expansion, and continuous optimization—ensuring measurable ROI and operational impact.


Why Manufacturers Choose Iottive

  • Proven experience in Industrial Automation & IIoT
  • Strong understanding of real shop-floor challenges
  • Seamless integration with existing PLC/SCADA systems
  • Scalable, secure, and production-ready architectures
  • Focus on business outcomes, not just technology

📧 Contact Email: sales@iottive.com

Why Retail Stores Overspend on Energy & How Iottive Smart Monitoring Solutions Reduce Power Costs

For store owners, managing operational expenses is a constant battle. A significant portion of these expenses comes from electricity bills. Without clear insight, it’s easy to waste money on inefficient systems.

smart retail energy monitoring

Lighting, HVAC, and refrigeration units run continuously. These systems can consume far more than necessary if they aren’t operating correctly. Hidden faults and outdated equipment silently drive up monthly charges.

Modern technology changes this. A Smart Retail Energy Monitoring system gives you real-time visibility. You can see exactly where your electricity is being used, down to individual circuits.

Devices like Shelly connect directly to your store’s Wi-Fi. This setup requires no complicated hub, making deployment simple. You gain instant data on consumption patterns.

Advanced tools, such as the Electro Industries Nexus 1500+, provide detailed power quality data. This information is crucial for maintaining efficient electrical systems. It helps ensure all equipment runs within its optimal parameters.

Implementing a Smart Power Monitoring Solution allows for immediate corrective action. You can identify and stop waste as it happens. This direct control leads to lower operational costs and supports your sustainability goals.

Key Takeaways

  • High electricity bills often stem from hidden inefficiencies in lighting, HVAC, and refrigeration.
  • Real-time visibility into consumption is essential for identifying and correcting waste.
  • Modern systems connect directly to Wi-Fi, simplifying setup and providing instant data.
  • Detailed power quality information helps maintain optimal equipment performance.
  • Taking immediate action based on data directly reduces monthly operational expenses.
  • Advanced tracking supports both financial savings and environmental sustainability goals.
  • Gaining control over your store’s energy use is a critical step toward improved profitability.

Introduction to Rising Energy Costs in Retail

A silent financial drain is impacting store profitability: ever-increasing electricity expenses. For operators, these rising energy costs are a primary concern. They must balance thin profit margins with growing utility demands.

rising energy costs retail

Understanding total energy consumption is the critical first step. It lays the foundation for a sustainable management strategy that protects any business’s bottom line.

Modern tools like the eGauge Pro capture data at one-second intervals for 30 days. This granular view is essential for pinpointing sudden usage spikes that inflate bills.

As utility rates fluctuate, real-time tracking provides a clear competitive edge. Stores that monitor their power flow can minimize overhead more effectively.

Many retailers now use advanced analytics. They gain insights into how daily operations drive overall expenditure.

By analyzing detailed consumption patterns, managers make informed decisions. This leads to significant, long-term savings on monthly bills.

The Impact of High Energy Consumption on Retail Operations

Unchecked electricity usage creates a direct drain on capital that could otherwise fund expansion or improvements. This diversion of funds from growth initiatives to utility payments significantly affects overall profitability.

Aging systems often draw excessive power, leading to higher operational costs. Maintaining equipment efficiency is critical to prevent this waste and avoid potential hardware failure.

high energy consumption retail operations

Power quality must be prioritized to ensure sensitive electronic systems remain functional. Poor quality contributes to unnecessary waste and can damage valuable assets.

Advanced analysis tools, like Electro Industries’ Communicator PQA software, help identify these issues. They transform raw data into actionable insights about consumption patterns.

The primary impacts include:

  • Reduced capital for business growth due to high utility expenses
  • Increased operational costs from inefficient, aging equipment
  • Shortened lifespan of expensive store assets requiring frequent repairs
  • Missed optimization opportunities for HVAC and lighting systems
  • Compromised performance of sensitive electronic point-of-sale systems

Proactive management of electricity usage breaks this costly cycle. It protects both immediate finances and long-term operational stability.

Challenges with Traditional Energy Metering Systems

Conventional power meters often fail to provide the actionable insights needed for modern retail management. These legacy systems create a significant blind spot, making it difficult to identify specific sources of waste.

traditional energy metering systems

Limited Data Insights and Flexibility

Older meters typically deliver only basic monthly totals. This lack of granular data prevents managers from seeing real-time consumption spikes as they happen.

Without detailed circuit-level information, pinpointing a faulty refrigeration unit or an over-lit section is nearly impossible. Furthermore, these outdated metering setups often cannot integrate with modern analytics software.

This integration gap severely limits a store’s ability to perform advanced analysis on its energy use.

Costly Maintenance and Upgrades

The upkeep of this equipment is another major hurdle. Staff often must manually record values from dispersed physical meters, a labor-intensive and error-prone process.

Upgrading the entire metering system is a clear solution. Modern devices consolidate many functions. For example, a single eGauge Pro unit supports 30 CT inputs.

This one device can effectively replace 10 to 15 traditional submeters. The move to a unified data source simplifies maintenance and provides a complete view of power flow, turning a challenge into a strategic advantage.

Understanding Energy Consumption in Retail Stores

A store’s total power draw is not a flat line but a series of peaks and valleys throughout the day. Understanding this pattern is fundamental for controlling overhead.

Managers must identify which activities and equipment create the highest demand.

Key Factors Influencing Power Usage

Lighting, climate control, and refrigeration systems are the primary continuous loads. These systems operate for extended periods, forming the base of your electrical footprint.

Usage spikes during specific hours, however, trigger costly demand charges from utilities. These fees can add hundreds of dollars to a single bill.

understanding energy consumption retail

Primary Electrical Loads in a Typical Store

Load Type Typical Usage Pattern Impact on Peak Demand Contribution to Bill
Refrigeration Constant, with compressor cycles High during compressor startup Major, often 30-50%
HVAC (Heating/Cooling) Variable with outdoor temperature Very high on extreme weather days Significant, 20-40%
Interior & Sign Lighting Constant during business hours Moderate, but adds to baseline Substantial, 15-25%

The Effect on Operational Costs

Your monthly costs are directly tied to the efficiency of each load shown in the table. Pinpointing the biggest contributors is the first step toward meaningful savings.

By analyzing detailed consumption patterns, you can strategically adjust operations. This helps flatten peak demand and directly reduces expense.

Why Retail Stores Overspend on Energy

The root cause of inflated utility bills often lies in a combination of outdated tools and passive management habits. Stores frequently pay more than necessary because they cannot see where waste is happening in real time.

Common Pitfalls in Energy Management

A major pitfall is operating without clear visibility. Equipment can run inefficiently for months without detection. This hidden drain slowly accumulates into a substantial financial loss.

Another common error is failing to automate critical systems. Manual control of lighting and climate leads to significant, preventable waste. This lack of proactive management directly impacts the yearly budget.

retail energy overspending pitfalls

Unoptimized Infrastructure and Outdated Meters

Legacy meters are a core part of the problem. They typically report only basic monthly totals. They do not track vital factors like power quality or sudden demand spikes.

This lack of data makes strategic decisions impossible. Managers cannot accurately plan for infrastructure upgrades or load shedding.

Furthermore, aging electrical systems often develop issues like harmonic distortion. These imbalances force equipment to draw more energy to perform the same work. The total usage and cost climb without any visible change in operation.

By ignoring power quality, stores remain blind to these hidden costs. Inefficient systems and a poor power factor quietly inflate every bill. Modern meters and detailed analysis are needed to break this cycle.

Smart Retail Energy Monitoring, Smart Power Monitoring Solution

Moving beyond basic metering requires a system that delivers actionable intelligence for every circuit. This approach transforms how stores manage their electrical footprint.

It provides the detailed visibility and control needed to stop waste at its source.

Core Features of Iottive Smart Monitoring

These platforms offer a suite of powerful features. You gain real-time, circuit-level data on all power consumption.

Automated alerts notify managers instantly of unusual spikes or equipment faults. Remote control capabilities allow for immediate adjustments to lighting and HVAC from any location.

A key advantage is seamless integration. Devices like Shelly connect directly to store Wi-Fi, eliminating the need for a complex hub.

This design ensures comprehensive support for various communication protocols within your existing infrastructure.

Direct Benefits for Retailers

Adopting these solutions yields immediate and tangible advantages. Retailers move from guessing to knowing.

  • Immediate Visibility: See exactly where every watt is used, enabling precise management.
  • Cost Reduction: Identify and eliminate waste as it happens, directly lowering monthly bills.
  • Proactive Management: Shift from reactive fixes to preventing inefficiencies before they cost you money.
  • Seamless Integration: The system works with your current setup without major overhauls.
  • Intuitive Dashboards: Clear data visualization highlights savings opportunities and tracks improvement over time.

This level of monitoring turns energy data into a strategic tool for boosting operational efficiency and profitability.

Product Roundup: Top Smart Monitoring Devices for Retail

A diverse ecosystem of connected devices now empowers retailers to take precise control of their electrical systems. The right hardware provides the data needed for informed decisions.

This equipment helps stores move from estimation to exact measurement. It forms the backbone of a modern management strategy.

Device Options That Enhance Energy Savings

The market offers a wide range of specialized tools. These products are designed for precise measurement and remote control.

Key devices include smart plugs, professional switches, and advanced controllers. Each serves a distinct purpose in reducing overall consumption.

Comparison of Key Monitoring Devices

Device Max Load Primary Function Best For
Shelly Plug US Gen4 1800 W Appliance power monitoring & control Individual equipment like displays or coffee makers
Shelly Wave Pro 2 25 A Professional lighting & appliance automation High-current circuits and commercial-scale management
Advanced LED Controller Varies Lighting optimization with power measurement Efficient store lighting while maintaining atmosphere

High-performance devices like the Shelly Plug provide essential insights. They help identify which appliances use the most electricity.

Professional-grade switches offer the reliability needed for large-scale automation. This directly supports lower operational costs.

Integration of Sensors and Communication Protocols

These tools gain greater value when connected. Integrating occupancy and temperature sensors creates an automated environment.

Standard communication protocols like Wi-Fi and Zigbee allow different devices to work together seamlessly. This integration enables systems to react to real-time data.

For example, lights can dim when an area is empty. HVAC can adjust based on both occupancy and outdoor temperature.

This automated approach ensures resources are only used when necessary. It maximizes savings without sacrificing comfort or safety.

Integrated Communication and Data Management Systems

The backbone of any effective strategy for managing electricity lies in its communication and data infrastructure. This framework moves information from meters to a central platform seamlessly.

It transforms raw numbers into actionable insights for better control. A reliable system ensures this data is always available for reporting.

Cloud Connectivity Versus Local Control

Choosing between cloud-based and local management depends on your needs. Cloud options offer easy remote access but rely on an external server.

Local control keeps sensitive information on your own network. This approach prioritizes data security and direct hardware access.

Tools like the eGauge UI provide a powerful local web server. Users can retrieve real-time information directly from their hardware without a cloud host.

This setup allows for secure access from your local network or remotely. It gives you complete ownership over your consumption data.

For custom needs, the eGauge Pro JSON API is available at no cost. Developers use it to build tailored management solutions.

This open communication tool helps fit the system to unique business requirements.

  • Integrated communication systems transfer information seamlessly for analysis.
  • The choice between cloud and local setups balances accessibility with security.
  • A reliable infrastructure ensures data is always ready for decision-making.

Enhancing Operational Efficiency Through Real-Time Monitoring

Preventing financial waste requires visibility so precise it captures events lasting just a few seconds. This level of detail is the foundation of enhanced operational efficiency. Real-time monitoring transforms how stores manage their electrical systems.

Immediate Data Insights and Alerts

Having access to live data allows managers to react instantly. They can address unexpected spikes in usage before they impact the monthly bill. Automated alerts are a critical feature here.

These notifications warn of potential equipment failures, like a refrigeration unit struggling. This proactive approach prevents capital loss from a full system collapse. Tools like the eGauge Pro record at one-second intervals for 30 days.

This high-granularity data pinpoints the exact moment a load issue occurs. It turns reaction into prevention.

Preventative Maintenance and Cost Reduction

Constant tracking of critical equipment performance is a game-changer. It shifts maintenance from a scheduled task to a need-based action. Issues are identified early, often before they cause downtime or excess consumption.

This direct link between monitoring and upkeep leads to substantial cost reduction. Waste is eliminated, and equipment run times are optimized.

  • Real-time insights enable quick managerial decisions to curb waste.
  • Automated alerts protect valuable assets from catastrophic failure.
  • High-granularity data provides an undeniable record for diagnosing problems.
  • Enhanced operational efficiency directly lowers overhead by optimizing system use.

This constant vigilance ensures your store’s energy systems work for you, not against your budget.

Leveraging Software Solutions for Energy Analytics

Raw electrical data is just numbers until powerful software transforms it into a clear roadmap for savings. These analytical platforms are the critical link between measurement and strategic management.

They turn complex information into actionable intelligence for decision-makers.

Energy Reporting Tools and Custom Dashboards

Advanced tools like CommunicatorPQA software provide the depth needed for serious analysis. They help identify inefficiencies across multiple locations from a single interface.

Custom dashboards are a key feature. They allow different stakeholders to see the data that matters most to them.

A store manager might focus on daily consumption trends. A corporate analyst needs aggregated reports on performance across all sites.

This level of insight relies on high-quality input. Precision meters like the Shark 270 Revenue Meter provide the accurate data foundation.

Software Analytics Capabilities

Feature Benefit Key Tool Example
Custom Reporting Delivers tailored insights for specific roles and goals CommunicatorPQA
Multi-site Aggregation Provides a consolidated view of usage for corporate management Cloud Analytics Platforms
Real-time Dashboards Offers immediate visibility into system performance and alerts Integrated Device UI

Automated Alerts and Data Visualization

Automation is a major advantage of these solutions. The system can send instant alerts when equipment deviates from its normal consumption baseline.

This allows managers to address a failing compressor or an overloaded circuit before it becomes costly.

Effective data visualization is equally important. Charts and graphs make complex energy patterns easy to understand at a glance.

Stakeholders can quickly see the impact of efficiency investments. This clarity supports better long-term planning and continued energy cost reduction.

Installation and Compatibility Considerations

A successful rollout of new monitoring technology hinges on careful planning and seamless integration with your store’s existing setup. This phase determines how effectively you can capture and use data.

Best Practices for Deployment

Following a structured approach is key. For instance, the world’s smallest Wi-Fi smart meter can be installed in 10 minutes for precise power tracking.

This highlights the importance of selecting equipment designed for simplicity. Always choose devices that offer a wide range of support for different voltage levels and communication protocols.

Installation Checklist for a Smooth Rollout

Step Action Key Consideration
Pre-Installation Audit Assess electrical panels and network capacity Verify compatibility with existing systems
Hardware Setup Install current transformers and meters correctly Ensure accuracy for reliable data use
Initial Testing Pilot the system in a small, controlled area Confirm performance and stable connectivity

Ensuring System Integration With Existing Infrastructure

Seamless integration is the most important step in the world of facility automation. The new hardware must communicate flawlessly with your current electrical and network systems.

Professional installers strongly recommend a phased pilot test before a full-scale rollout. This verifies that all components work together as intended, preventing costly rework.

Advanced Features and Innovations in Smart Monitoring

Artificial intelligence is injecting a new layer of intelligence into the infrastructure of modern stores. This evolution moves platforms from simple reporting to autonomous, learning systems.

These tools analyze patterns and make adjustments without constant human input.

AI-Driven Optimization and Predictive Analytics

Advanced systems now use AI to automatically fine-tune consumption. They react to real-time usage patterns to maximize efficiency.

Predictive analytics forecast maintenance needs. This ensures equipment performance stays high and extends its operational life.

By examining historical data, these innovations can predict future energy demands. They suggest operational adjustments to improve facility operations.

Machine learning platforms, like EnergyPQA.com, enable proactive cost control. A facility manager noted,

“The shift from watching meters to receiving prescriptive alerts has fundamentally changed our operational rhythm.”

Core Capabilities of Next-Generation Platforms

Feature Primary Function Business Outcome
AI-Driven Optimization Automatically adjusts loads based on live patterns Reduces waste without manual intervention
Predictive Maintenance Analytics Forecasts equipment failures using data trends Prevents downtime and costly emergency repairs
Integrated Quality Analysis Continuously assesses power health and stability Protects sensitive electronics and ensures energy quality

This integration provides a complete view of a store’s electrical health. It moves management from a reactive task to a strategic, forward-looking function.

Future Trends in Retail Energy Management

Tomorrow’s successful store will act as a mini power plant, generating, storing, and intelligently distributing its own electricity. The landscape of utility management is shifting toward decentralized systems and deep renewable integration.

This evolution is driven by both technological innovation and new regulatory frameworks. Stores must prepare for these changes to remain competitive and sustainable.

Emerging Technologies Shaping the Future

Decentralized power systems are at the forefront. Technologies like on-site solar panels and battery storage allow stores to generate and hold their own energy.

Renewable sources, particularly solar PV, require continuous monitoring to ensure maximum returns on investment. Smart grid connectivity will let stores interact dynamically with the utility grid.

This helps meet future energy needs efficiently. The integration of these technologies creates a resilient and cost-effective ecosystem.

Key Technologies for Future Store Power Systems

Technology Primary Role Monitoring Need
Solar PV On-site generation from sunlight Continuous tracking for peak efficiency and ROI
Battery Storage Stores excess energy for later use Essential for managing charge cycles and health
Smart Grid Connectivity Enables two-way communication with utilities Critical for demand response and grid stability

Regulatory and Sustainability Considerations

As the world adopts stricter sustainability rules, accurate carbon reporting becomes mandatory. Advanced tracking systems are needed to measure and verify a store’s environmental impact.

Efficient power management now prioritizes both planet and profit. One industry analyst noted,

“The stores that invest in future-proof infrastructure today will navigate tomorrow’s regulatory landscape with confidence.”

This dual focus on compliance and cost drives innovation. Retailers who adapt early will secure a lasting competitive advantage.

Conclusion

Transforming your store’s largest variable expense into a controlled cost center is an achievable strategic goal. Implementing advanced electrical tracking is a vital step for any business aiming to cut operational costs and boost overall efficiency.

By leveraging real-time data, you gain the visibility needed to optimize electricity use and prevent costly equipment failures. Modern systems offer the functionality required to manage complex infrastructure while providing the flexibility every facility needs.

Investing in this technology ensures you can make informed decisions about your power consumption and sustainability goals. This transition is essential for retailers who want to remain competitive in a changing world.

We encourage all operators to evaluate their current energy infrastructure. Start your journey toward lower expenses today by integrating professional-grade monitoring tools into your daily operations.

FAQ

What are the main problems with older power metering equipment in stores?

Traditional meters often provide limited data, usually just a total monthly reading. This lack of detailed, real-time insight makes it hard to identify waste. They also require manual checks and can be expensive to repair or upgrade, leading to higher operational costs.

How does detailed visibility into power usage help control expenses?

Real-time tracking allows you to see exactly when and where electricity is consumed. By analyzing this data, you can pinpoint inefficient equipment, adjust operational schedules, and eliminate wasteful practices, directly lowering your utility bills.

What core functionality does a modern monitoring system provide?

A comprehensive system like Iottive’s offers continuous tracking of consumption, voltage, and load. It delivers instant alerts for anomalies, supports various communication protocols for easy integration, and provides a clear cloud-based interface for managing data from anywhere.

Can these systems work with my store’s existing lighting and HVAC equipment?

Yes. A key advantage is compatibility with current infrastructure. The right devices and sensors can connect to your existing electrical panels and machinery without major disruption, allowing for a smooth upgrade path and protecting your previous investments.

What is the benefit of cloud connectivity versus a local-only server?

Cloud-based management offers remote access to your data from any internet-connected device, enabling better control across multiple locations. It also ensures your data is securely backed up and facilitates easier software updates, compared to maintaining an on-site server.

How do real-time alerts contribute to preventative maintenance?

Immediate notifications about unusual power spikes or drops can signal equipment failure, like a faulty compressor or failing LED driver. Addressing these issues proactively prevents costly downtime, extends equipment lifespan, and avoids emergency repair bills.

What reporting tools are available to understand consumption patterns?

Advanced software provides customizable dashboards and automated reports. You can visualize usage by hour, day, or specific circuit, set performance benchmarks, and generate clear reports to share with your team, making data-driven decisions straightforward.

What should I consider when installing a new monitoring network?

Best practices include a professional assessment of your electrical panels, ensuring the new devices support your facility’s communication needs (like Modbus or MQTT), and planning for seamless integration with your current building automation or management systems.

How do innovations like AI improve power management?

Artificial intelligence and predictive analytics go beyond simple tracking. They learn your store’s normal usage patterns and can automatically suggest optimizations, forecast future consumption, and identify subtle inefficiencies that humans might miss, unlocking new levels of efficiency.

What future trends will shape how stores manage their electricity?

Emerging technologies include greater integration with renewable energy sources, more stringent sustainability regulations, and the rise of IoT-driven automation. Staying ahead with a flexible monitoring solution prepares your business for these evolving standards and technological shifts.

How Iottive Delivers End-to-End Smart Retail Solutions

1. Retail Strategy & Solution Design

Iottive collaborates with retail leaders, digital heads, store operations teams, and supply chain stakeholders to understand customer journeys, inventory challenges, and growth objectives. This phase includes retail use-case validation, omnichannel architecture design, IoT device selection, AI personalization planning, and defining measurable KPIs such as promotion ROI, stock accuracy, and conversion rates.


2. Smart Systems Engineering & Retail Integration

Iottive engineers scalable Smart Retail solutions by integrating IoT sensors, RFID, smart shelves, digital mirrors, edge devices, and cloud platforms. We ensure seamless connectivity between POS systems, ERP, CRM, warehouse systems, and e-commerce platforms. The focus is on real-time visibility, secure data flow, and unified customer and inventory intelligence across stores and digital channels.


3. Pilot Deployment in Stores & Warehouses

Before enterprise rollout, Iottive deploys pilot solutions in selected retail stores, warehouses, or pharmacy locations. This includes testing AI-driven recommendations, smart inventory tracking, cold chain monitoring systems, and digital try-on experiences. Retailers can validate performance, customer engagement impact, and operational feasibility in live environments before scaling across locations.


4. Customer Experience & Retail Intelligence

Iottive builds intuitive dashboards and retail intelligence platforms that provide real-time insights into:

  • Customer behavior & segmentation
  • Promotion performance & ROI
  • Store-level inventory accuracy
  • Warehouse efficiency metrics
  • Cold chain compliance tracking
  • Online conversion and upsell analytics

Advanced analytics, alerts, and AI-driven insights empower retail teams to make faster, data-driven decisions that improve revenue, reduce losses, and enhance customer satisfaction.


5. Enterprise Rollout & Retail Scale-Up

From MVP to multi-location deployment, Iottive supports solution hardening, cloud scalability, cybersecurity, and long-term support. Smart Retail solutions are designed for:

  • Multi-store expansion
  • Omnichannel integration
  • Regional inventory balancing
  • Cross-border retail operations
  • Continuous optimization using AI insights

Our approach ensures measurable ROI through improved customer engagement, reduced shrinkage, better inventory control, and operational efficiency.


Why Retailers Choose Iottive

  • Proven expertise in Smart Retail & IoT-driven transformation
  • Deep understanding of store operations, warehousing, and pharmacy compliance
  • Seamless integration with POS, ERP, CRM, and e-commerce platforms
  • Secure, scalable, and production-ready retail architectures
  • Strong focus on measurable business outcomes — not just technology

📧 Contact Email: sales@iottive.com

Why Retail Stores Lose Sales Due to Shelf Inventory Mismatch and How Iottive Smart Shelves Solve it

The global retail industry is massive, generating over 27 trillion dollars in sales. It’s projected to pass 30 trillion dollars soon. This growth makes precise inventory control more crucial than ever for success.

Traditional tracking methods are failing. Manual counts and barcode scans are slow and full of errors. They create a gap between what the computer says is in stock and what is actually on the shelf.

This mismatch is a silent profit killer. When a product shows as available online but the shelf is empty, you lose the sale. Customers leave frustrated, often going to a competitor. For retailers, this means lost revenue and damaged loyalty.

smart shelves inventory solution

New technology offers a clear solution. Smart shelves equipped with IoT sensors provide constant, automated monitoring. They instantly detect when an item is missing or low. This closes the inventory gap for good.

Adopting this approach protects your sales and keeps customers happy. It aligns with the huge economic impact forecast for IoT technology. This shift is essential for modern retail operations to thrive.

Key Takeaways

  • The retail industry’s enormous size makes accurate inventory critical for profitability.
  • Old-fashioned manual tracking methods are prone to errors and cannot keep pace.
  • Discrepancies between recorded stock and physical shelf stock directly cause lost sales.
  • This inventory mismatch damages customer satisfaction and brand loyalty.
  • IoT-enabled smart shelves provide real-time, automated monitoring to eliminate these gaps.
  • Implementing this technology is a proactive step to prevent revenue loss.
  • Smart inventory management is becoming essential for competitive retail operations.

Understanding Shelf Inventory Mismatch in Retail

When a store’s digital records and its physical stock diverge, the result is a costly gap known as shelf inventory mismatch. This occurs when the products actually on the shelf don’t match the inventory data in the system.

It creates two big problems: phantom stock and unrecorded items. Both scenarios hurt sales and store efficiency.

shelf inventory mismatch retail

The root causes are often simple human errors. Mistakes during restocking, theft, or items placed in the wrong spot all contribute. There’s also a built-in time lag in old systems.

This mismatch affects every part of a store’s operation. Automated reorders fail. Promises to customers are broken. Shoppers leave for competitors.

Perishable goods face a worse challenge. Expired products can sit on the shelf while the system says they’re available. This leads to frustration and wasted stock.

The financial hit goes beyond a single lost sale. It includes extra labor for emergency restocking, rush shipping fees, and costly markdowns. Customer loyalty suffers when shelves are empty.

Traditional fixes like more manual counts don’t solve the core issue. They are slow and still prone to error. Modern retail needs a better way to track inventory levels accurately.

The Role of IoT and ML in Modern Inventory Management

Two powerful technological forces are converging to solve age-old retail challenges. The Internet of Things (IoT) and Machine Learning (ML) form the core of a new, intelligent approach to stock control.

iot ml inventory management

This combination moves far beyond basic automation. It creates a living, learning system for store operations.

Evolution of Retail Technology

Stock tracking has progressed through clear phases. Each step brought more accuracy and less manual work.

Early manual counts were slow and error-prone. Barcode scanners added speed but still required human action. RFID tags improved visibility but offered only periodic updates.

Today, integrated IoT ecosystems provide constant communication. Connected sensors and devices deliver a real-time view of every shelf.

Technological Phase Key Mechanism Data Type Primary Limitation
Manual Counts Physical tally sheets Static, infrequent High labor cost, human error
Barcode Scanning Laser scanners at POS Transaction-based Misses shrinkage, blind between scans
RFID Tags Radio frequency identification Batch location updates Cost per tag, limited granularity
IoT & ML Systems Connected sensors & predictive algorithms Continuous stream, predictive insights Higher initial integration

Data-Driven Decision Making

Machine Learning algorithms analyze the vast data from IoT networks. They find patterns humans cannot see.

These tools predict future demand with high accuracy. They consider sales history, seasons, and local events. This allows for proactive restocking before a gap appears.

The result is a fundamental shift in philosophy. Management moves from reactive guesses to empirical strategy. Store operations become optimized through actionable insights, protecting sales and customer trust.

Smart Retail Smart Shelves, Smart Retail System, Smart Inventory Management

The integration of sensors and networking into store shelving creates a perpetual inventory system. These electronically connected shelves automatically track product presence and movement.

They utilize multiple detection technology. Weight sensors, RFID readers, and digital displays work together. This creates a constant data stream within a connected ecosystem.

smart retail smart shelves

The complete Smart Retail System architecture includes embedded hardware and central databases. Wireless networks transmit real-time data. Sophisticated algorithms then process this information instantly.

This enables true Smart Inventory Management. It replaces manual checks with continuous monitoring. The result is exceptional stock accuracy and major gains in operational efficiency for modern retail operations.

Real-Time Data: Enhancing Inventory Monitoring and Customer Experience

Immediate access to accurate shelf data transforms how stores operate and serve shoppers. This constant flow of information closes the visibility gap that once plagued traditional methods.

It turns every product interaction into a valuable data point for the business.

real-time inventory monitoring

Accurate Stock Monitoring

Connected shelves provide real-time inventory updates. Weight sensors detect the removal of items instantly.

This continuous monitoring ensures inventory levels in the system mirror the physical shelf. Alerts for low stock are generated proactively.

As one industry analyst noted,

“The shift from periodic counts to live tracking is the single biggest leap in retail accuracy.”

This eliminates out-of-stock scenarios before they disappoint a customer.

Personalized In-Store Engagement

The same data stream enriches the shopper’s experience. By understanding which products are picked up, systems can offer tailored recommendations.

Shoppers see relevant deals or product details on integrated displays. This personal touch, driven by live inventory data, makes shopping more efficient and satisfying.

Real-time inventory tracking ensures the products they want are there. It builds trust and encourages return visits.

Implementing Smart Shelves in a Retail Environment

The journey to automated stock tracking begins with a detailed assessment of store infrastructure. Implementing these intelligent systems requires careful integration planning.

implementing smart shelves integration

Integration into Existing Store Infrastructure

Successful deployment evaluates electrical power and wireless connectivity. The system must connect with existing inventory software via standard APIs.

Physical installation places weight-sensing platforms beneath shelf surfaces. Each node is calibrated to specific products for accurate baselines.

Optimizing Sensor and Weight Technologies

Choosing the right detection mechanism is crucial for different product categories. Optimized sensors provide reliable data for real-time updates.

Sensor Technology Ideal Application Primary Benefit
Precision Weight Sensors Items with uniform mass Accurate quantity tracking
RFID Readers Tagged merchandise Individual item identification
Computer Vision Systems Bulk or variable products Visual verification
Environmental Monitors Perishable goods Condition and quantity data

Calibration accounts for product weight variations. Restocking alerts trigger when inventory falls below a set threshold, often three times a single item’s weight.

IoT Communication Protocols and System Architecture

The backbone of any reliable automated shelf system lies in its communication framework and data architecture. Connected technologies must transmit information instantly and accurately.

This constant stream of data enables real-time inventory updates. It ensures the digital record always matches the physical shelf.

Leveraging MQTT and REST for Seamless Connectivity

These systems rely on standard IoT communication protocols. MQTT handles lightweight telemetry from weight sensors efficiently.

Its publish-subscribe model lets shelf sensors broadcast changes without complex configurations. Backend systems then consume this data for analysis.

REST APIs provide the request-response pattern for control. Teams use them to set product parameters or check historical logs.

This dual-protocol approach ensures seamless integration with existing platforms. All sensor readings use validated JSON payloads for consistency.

Advantages of a Robust Relational Database

A structured database is central to these operations. It organizes information into key tables like Products and ScaleReadings.

Each table links to others through defined relationships. This design enforces data consistency and prevents errors.

Queries can quickly identify restocking needs across stores. The system logs every restocking action and weight measurement for audit trails.

Transaction integrity guarantees that simultaneous updates don’t corrupt records. This reliability is vital for accurate inventory levels and timely restocking alerts.

The complete architecture creates a dependable data flow from shelf-level sensors to central servers. It identifies low product quantities and dispatches notifications within minutes.

This IoT ecosystem turns raw sensor readings into actionable insights for integration into daily workflows.

Smart Retail Solutions: Transforming Operations and Customer Engagement

Beyond simple stock tracking, modern retail solutions create a seamless bridge between operational data and personalized customer interactions.

These integrated platforms connect various in-store technologies. They turn raw data into actionable insights for staff and richer experiences for shoppers.

Interactive Displays and Beacon Technology

Digital kiosks use live stock data to show accurate product details and alternatives. This guides customer decisions and prevents frustration from empty shelves.

Beacon technology detects a shopper’s location within the store. It then sends timely promotions to their smartphone for items nearby.

This combination ensures offers are relevant and products are available. It makes the shopping trip more efficient and engaging.

Technology Component Primary Function Key Benefit for Retailers
Interactive Displays Provide product info & alternatives Increases conversion rates
Beacon Systems Deliver location-based promotions Boosts average transaction value
Cashier-less Systems Automate checkout & payment Eliminates checkout friction
Predictive Analytics Forecast future product demand Optimizes stock levels & pricing

Cashier-less Experiences and Predictive Analytics

Pioneers like Amazon have introduced stores where you just pick items and leave. Sensors and cameras track selections, and payments happen automatically.

This removes the final point of friction. It saves customers valuable time.

Behind the scenes, AI tools analyze behavior and sales trends. They predict future demand to keep shelves full and operations smooth.

Retailers gain powerful insights to optimize pricing and staffing. The entire shopping experience becomes faster, smarter, and more satisfying.

Cost Efficiency and Operational Benefits of Smart Shelving

The economic case for automated shelf monitoring centers on converting wasted labor hours into enhanced customer engagement. This technology delivers clear financial benefits and streamlines store operations.

Reducing Labor Costs and Restocking Errors

Automation slashes labor costs by ending daily manual counts. Freed-up staff time can focus on helping shoppers and building displays.

Precise alerts for restocking cut errors dramatically. Workers get exact product, quantity, and location data. This prevents misplacements and ongoing stock gaps.

The system supports teams by handling repetitive checks. This reduces burnout and lets staff use their skills better. The result is happier employees and improved service.

Benefit Area Operational Impact Financial Outcome
Labor Optimization Eliminates manual stock counts; directs staff efficiently Direct wage savings; higher sales per labor hour
Restocking Accuracy Virtually eliminates misplacement and quantity errors Reduces lost sales; lowers inventory carrying cost
Inventory Efficiency Enables lower stock levels with same product availability Frees up capital; reduces shrinkage and storage needs
Staff Empowerment Shifts focus to customer service and merchandising Improves retention; boosts customer satisfaction scores

These efficiency gains compound. Better inventory management leads to faster turnover and stronger cash flow. For retailers, the payback period is often swift, with ongoing benefits that grow each year.

Conclusion

The era of guessing what’s on the shelf is ending. It is replaced by data-driven certainty that boosts both profits and loyalty.

Connected shelf technology provides the definitive solution to a costly, age-old problem. It transforms store operations from reactive to proactive.

This shift is now a business imperative. Meeting modern shopper expectations requires this efficiency and accuracy.

Implementing an IoT-powered system turns inventory tracking into a strategic asset. It protects sales and enhances the entire customer experience.

FAQ

What is the main problem smart shelf technology solves?

This system directly addresses shelf inventory mismatch, where the stock level shown in a store’s central database does not match the actual product quantity on the shelf. This discrepancy leads to lost sales, poor customer experience, and inefficient operations.

How do these shelves actually track items?

They use integrated weight sensors and sometimes RFID or vision technologies. These components constantly monitor the quantity of items on display. Any change, like a customer picking up a product, is instantly detected and recorded.

What kind of data does the system provide to store managers?

It delivers real-time inventory insights directly to a dashboard. Managers can see stock levels for every shelf, track high-velocity products, and receive instant alerts for low stock or misplaced items, enabling data-driven decision making.

Is it difficult to install this into an existing store?

Deployment is designed for minimal disruption. The solution often involves integration with current store infrastructure and point-of-sale systems. A good provider ensures seamless connectivity and compliance with your existing tech stack.

How does this technology improve the shopping experience?

It ensures products are always available for customers, reducing frustration. It can also enable personalized promotions through connected displays and support faster checkout experiences by keeping accurate inventory data.

What are the biggest operational benefits for retailers?

The primary benefits are significant labor savings by automating manual stock counts, drastic reduction in restocking errors, optimized demand forecasting, and lower overall costs from improved efficiency and reduced shrink.

What happens to the collected data?

Inventory data is securely transmitted via reliable protocols like MQTT to a cloud-based relational database. This architecture allows for robust reporting, trend analysis, and integration with other business intelligence systems for comprehensive insights.


How Iottive Delivers End-to-End Smart Retail Solutions

1. Retail Strategy & Solution Design

Iottive collaborates with retail leaders, digital heads, store operations teams, and supply chain stakeholders to understand customer journeys, inventory challenges, and growth objectives. This phase includes retail use-case validation, omnichannel architecture design, IoT device selection, AI personalization planning, and defining measurable KPIs such as promotion ROI, stock accuracy, and conversion rates.


2. Smart Systems Engineering & Retail Integration

Iottive engineers scalable Smart Retail solutions by integrating IoT sensors, RFID, smart shelves, digital mirrors, edge devices, and cloud platforms. We ensure seamless connectivity between POS systems, ERP, CRM, warehouse systems, and e-commerce platforms. The focus is on real-time visibility, secure data flow, and unified customer and inventory intelligence across stores and digital channels.


3. Pilot Deployment in Stores & Warehouses

Before enterprise rollout, Iottive deploys pilot solutions in selected retail stores, warehouses, or pharmacy locations. This includes testing AI-driven recommendations, smart inventory tracking, cold chain monitoring systems, and digital try-on experiences. Retailers can validate performance, customer engagement impact, and operational feasibility in live environments before scaling across locations.


4. Customer Experience & Retail Intelligence

Iottive builds intuitive dashboards and retail intelligence platforms that provide real-time insights into:

  • Customer behavior & segmentation
  • Promotion performance & ROI
  • Store-level inventory accuracy
  • Warehouse efficiency metrics
  • Cold chain compliance tracking
  • Online conversion and upsell analytics

Advanced analytics, alerts, and AI-driven insights empower retail teams to make faster, data-driven decisions that improve revenue, reduce losses, and enhance customer satisfaction.


5. Enterprise Rollout & Retail Scale-Up

From MVP to multi-location deployment, Iottive supports solution hardening, cloud scalability, cybersecurity, and long-term support. Smart Retail solutions are designed for:

  • Multi-store expansion
  • Omnichannel integration
  • Regional inventory balancing
  • Cross-border retail operations
  • Continuous optimization using AI insights

Our approach ensures measurable ROI through improved customer engagement, reduced shrinkage, better inventory control, and operational efficiency.


Why Retailers Choose Iottive

  • Proven expertise in Smart Retail & IoT-driven transformation
  • Deep understanding of store operations, warehousing, and pharmacy compliance
  • Seamless integration with POS, ERP, CRM, and e-commerce platforms
  • Secure, scalable, and production-ready retail architectures
  • Strong focus on measurable business outcomes — not just technology

📧 Contact Email: sales@iottive.com

How Oil & Gas Operators Detect Pipeline Leaks in Real Time Using IoT Monitoring by Iottive

For operators in the oil and gas sector, maintaining vast networks of infrastructure is a constant challenge. A single, unnoticed anomaly can lead to significant problems. These issues impact the environment, trigger regulatory fines, and cause major financial damage.

iot pipeline monitoring system

Traditional inspection methods can’t provide the continuous surveillance needed today. The industry now demands intelligent systems that identify problems instantly. This shift prevents minor fluctuations from becoming catastrophic failures.

Iottive delivers a comprehensive solution for this critical need. Our integrated approach combines advanced connectivity with artificial intelligence and cloud analytics. It transforms raw data on flow, pressure, vibration, and temperature into actionable intelligence.

This capability gives operators unprecedented visibility into their assets. They can intervene proactively, enhancing operational safety and reducing costs. The move to automated, data-driven monitoring represents a fundamental advancement for the energy sector.

Key Takeaways

  • Constant vigilance is essential for modern pipeline operations to prevent environmental and financial harm.
  • Manual inspections are no longer sufficient; the industry requires instant, automated anomaly detection.
  • Iottive provides a leading real time monitoring solution built on IoT, AI, and cloud technology.
  • The system turns data from the field into clear insights, enabling proactive maintenance and decision-making.
  • Adopting such advanced systems directly improves safety compliance, asset longevity, and overall cost management for oil and gas companies.
  • This technological evolution is critical for managing complex infrastructure efficiently and responsibly.

Overview of IoT Pipeline Monitoring Solutions

The energy industry’s shift toward digital oversight marks a pivotal change in how asset integrity is managed. This approach uses interconnected networks of measurement devices.

These networks provide constant surveillance across vast distribution lines. They capture vital information on flow, pressure, vibration, and temperature.

Introducing the Role of IoT in Pipeline Safety

Connected technology creates a seamless data flow from field devices to operator dashboards. Networked devices communicate with edge gateways and cloud platforms.

This architecture delivers complete situational awareness. Diverse measurement tools are deployed throughout the network.

iot pipeline monitoring solutions

Acoustic devices, pressure transducers, and temperature monitors work together. They identify anomalies instantly, enhancing protection for personnel and communities.

Key Benefits for the Oil & Gas Sector

Adopting these systems brings dramatic operational improvements. Inspection costs drop significantly while anomaly identification speeds up.

Regulatory compliance becomes more straightforward. Asset lifespan extends through predictive maintenance strategies.

Operators can oversee thousands of miles from a single control center. This centralized capability boosts efficiency and reduces field visits.

The technologies are highly scalable. Companies can start with critical segments and expand as value is recognized.

Understanding the Importance of Real-Time Pipeline Monitoring

A reliance on manual inspections and basic alarms leaves critical infrastructure dangerously exposed. These legacy approaches cannot provide the constant vigilance modern operations require.

Gaps in oversight allow minor fluctuations to escalate into major failures. This reality makes a compelling case for advanced, continuous surveillance.

Challenges of Traditional Pipeline Leak Detection

Conventional methods are often slow and inefficient. Scheduled walkdowns and pressure tests happen weeks or months apart.

Basic threshold alarms frequently miss subtle anomalies. They also generate false alerts from normal operational changes.

traditional pipeline monitoring challenges

Human error in data interpretation is another significant risk. This delayed detection allows small leaks to grow.

Aspect Traditional Methods Modern Continuous Monitoring
Inspection Frequency Periodic / Scheduled Constant, 24/7
Anomaly Detection Speed Delayed (hours/days) Immediate (minutes)
Data Interpretation Manual, Prone to Error Automated, Algorithmic
Primary Cost Driver Labor & Emergency Repairs Predictive Maintenance
Safety Posture Reactive Proactive

Operational Efficiency and Safety Impacts

Inadequate monitoring leads to costly unplanned shutdowns. Emergency repairs are far more expensive than scheduled maintenance.

Regulatory penalties for compliance failures add to the financial strain. Lost product and environmental cleanup create massive bills.

Undetected issues pose direct risks to field personnel and nearby communities. Catastrophic incidents threaten environmental integrity.

Slow-developing problems like corrosion undermine long-term asset reliability. A shift to real-time systems addresses these core challenges directly.

Harnessing smart pipeline sensor, pipeline leak detection IoT, realtime pipeline monitoring for Enhanced Safety

The foundation of any advanced surveillance system lies in its ability to capture and interpret field measurements instantly. This continuous data stream forms the backbone of modern infrastructure protection.

How Smart Sensors Transform Monitoring Practices

Sophisticated devices measure live flow rates, pressure levels, and temperature changes. Acoustic and vibration tools listen for the unique sound of escaping fluids.

This allows for pinpointing issues in buried or submerged lines. Edge computing filters data locally, sending only critical alerts.

smart pipeline sensor technology

Battery-powered units operate for years with minimal upkeep. Corrosion and protection measurement tools also transmit data efficiently.

Integration with AI and Cloud Analytics

Artificial intelligence algorithms learn normal operational patterns. They spot subtle deviations that signal developing problems.

Cloud platforms aggregate information from thousands of measurement points. Operators see comprehensive dashboards with trends and predictive alerts.

This combination enables response within seconds. It minimizes product loss and environmental impact dramatically.

Advanced Technologies Powering Modern Pipeline Monitoring

Operational resilience in the energy sector is now driven by a fusion of edge intelligence and cloud power. This integrated stack turns raw measurements into decisive actions.

advanced pipeline monitoring technologies

Internet of Things (IoT) and Sensor Networks

Connected networks form the data-gathering layer. Devices using protocols like LoRaWAN collect sensor data on pressure and flow across vast pipelines.

This architecture provides redundant communication paths. It ensures real-time data flow even in remote locations.

Edge Computing and Cloud-Based Dashboards

Edge computing processes information locally for faster anomaly detection. It reduces bandwidth needs and allows operation during central connectivity loss.

Processed insights stream to secure cloud platforms. Operators access intuitive dashboards with visual analytics from any device.

Artificial intelligence analyzes historical data to predict failures. Blockchain technology then creates immutable audit logs for compliance. Together, these technologies create a complete, proactive monitoring system.

Case Studies and Industry Success Stories

Real-world applications demonstrate the tangible benefits of advanced infrastructure surveillance. Documented achievements provide the most convincing evidence for adopting new technologies.

These examples show measurable improvements in safety, efficiency, and cost management.

Oil & Gas Operator Achievements

A major transmission company implemented a comprehensive digital oversight system. This case study highlights extraordinary results.

The operator achieved 99.8% accuracy in identifying loss events. Inspection expenses fell by 70% as manual checks were replaced.

Critical incident response times improved by 60%. This allows for faster isolation and repair, minimizing environmental impact.

case study pipeline monitoring

Utility and Water Distribution Applications

The technology also delivers value in municipal water distribution networks. One utility reduced non-revenue water loss by 50%.

This saved over 80 million gallons annually, showcasing both fiscal and environmental stewardship. Such performance is crucial in drought-prone regions.

Predictive maintenance further cuts operational costs. These case studies prove the system’s versatility across oil, gas, and distribution sectors.

Technical Insights into Sensor Data and Predictive Analytics

The true power of modern infrastructure management emerges when raw measurements evolve into foresight. Sophisticated platforms process millions of data points daily to identify patterns and optimize operations.

Key Performance Indicators and Real-Time Metrics

Critical metrics demonstrate system effectiveness. Predictive maintenance capabilities reduce operational interruptions by 50-60%.

This schedules repairs during planned windows, not emergencies. Maintenance cost efficiency improves 30-40% through condition-based strategies.

These strategies act only when sensor data indicates actual need. Performance targets for loss event accuracy reach 99%.

Predictive Maintenance and Anomaly Detection

Algorithms learn normal patterns for each asset segment. They adjust thresholds based on seasonal changes and product characteristics.

This maintains high detection sensitivity while minimizing false alerts. Anomaly identification uses statistical process control and machine learning.

It spots subtle deviations in pressure, flow, and temperature signatures. These deviations often precede significant issues.

Data Analytics for Optimized System Performance

Risk scoring assigns priority levels to sections based on multiple factors. These include age, material, operating pipeline conditions, and maintenance history.

This enables effective allocation of inspection resources. Integration with management software creates closed-loop workflows.

Data automatically generates work orders and tracks repair histories. This analytics-driven approach supports asset lifecycle decisions.

Meeting Regulatory and Environmental Compliance Standards

Modern energy operators face a dual mandate: ensuring operational excellence while meeting stringent compliance standards. These requirements govern safety, environmental protection, and operational transparency across North America.

Automated Reporting and Blockchain Audit Logs

Advanced systems generate necessary documentation automatically. This includes incident reports, inspection records, and environmental impact assessments.

Blockchain technology creates tamper-proof audit trails of every alert and action. This provides indisputable evidence for regulators and supports investigations.

Aligning with U.S. and Canadian Standards

Technology platforms are designed to meet key industry benchmarks. In the U.S., this includes Department of Transportation PHMSA standards and API specifications for detection.

For Canadian operations, they align with CSA Z662 for pipeline integrity. Automated tracking of emissions and resource usage also supports ESG (Environmental, Social, Governance) reporting.

This comprehensive approach reduces regulatory risk. It helps maintain operating permits and demonstrates corporate responsibility to communities and investors.

Conclusion

Ultimately, protecting vital distribution networks demands a shift from periodic checks to persistent, intelligent oversight. Iottive’s integrated platform delivers this by transforming raw data into decisive foresight.

This approach enables a truly proactive operational model. Operators gain the power to address potential issues long before they impact safety or reliability.

The result is a dramatic improvement in both efficiency and cost management. Automated maintenance scheduling and precise leak detection safeguard infrastructure and the environment.

For any organization managing critical assets, embracing this level of pipeline monitoring is the definitive step toward resilient, responsible operations. The future of system integrity begins with a commitment to continuous, data-driven insight.

FAQ

What is the primary advantage of using IoT for infrastructure monitoring?

The main benefit is gaining real-time data on asset conditions. This continuous stream of information allows operators to identify anomalies, like pressure drops or temperature shifts, immediately. It transforms maintenance from a scheduled task into a proactive, data-driven function, significantly boosting reliability and safety.

How does this technology improve leak detection compared to older methods?

Traditional approaches often rely on scheduled inspections or manual reports, leading to delays. Advanced sensor networks detect minute changes in flow and pressure instantly. By analyzing this information with cloud analytics, the system can pinpoint the location and severity of an integrity issue much faster, minimizing environmental risk and product loss.

Can these systems be integrated with existing utility infrastructure?

Yes, a key strength of modern solutions from providers like Iottive is their design for integration. They can connect with legacy SCADA systems and other industrial networks. This allows companies to enhance their current operations without a complete, costly overhaul, protecting previous investments while modernizing their performance monitoring capabilities.

What role does data analytics play in predictive maintenance?

A: Analytics are the core of predictive strategies. By examining historical and live sensor data, algorithms can identify patterns that precede equipment failure. This allows gas utility and water distribution teams to schedule repairs during planned downtime, avoiding unexpected outages and improving overall efficiency across their networks.

How do these monitoring platforms assist with regulatory compliance?

They automate the collection and reporting of critical performance and safety metrics. Systems can generate audit-ready logs and reports that align with standards like those from PHMSA in the U.S. This reduces administrative burden and provides a verifiable, digital record of integrity management activities, ensuring compliance is consistently met.

Are the applications limited to the oil and gas industry?

Not at all. While crucial for gas pipeline and oil infrastructure, the same technologies are highly effective for water distribution networks and other industrial utility assets. Any system that transports fluids or gases under pressure can benefit from enhanced, remote monitoring and anomaly detection to prevent loss and ensure service continuity.
 

How Iottive Delivers End-to-End Smart Pipeline Monitoring Solutions for Energy & Utilities

1. Pipeline Strategy & Solution Design

Iottive collaborates with energy and utilities operators, pipeline integrity teams, digital transformation leaders, and infrastructure managers to understand pipeline network challenges, leak detection requirements, regulatory compliance needs, and operational efficiency goals.

This phase includes pipeline monitoring use-case validation, IoT architecture design, sensor selection (pressure, flow, acoustic, vibration, corrosion), AI-driven anomaly detection planning, and defining measurable KPIs such as leak detection time, asset uptime, operational efficiency, and maintenance cost reduction.


2. Smart Systems Engineering & Pipeline Integration

Iottive engineers scalable Smart Pipeline Monitoring solutions by integrating IoT sensors, edge computing gateways, smart telemetry devices, firmware-enabled monitoring units, and secure cloud platforms.

Our solutions ensure seamless connectivity with SCADA systems, asset management platforms, maintenance systems, and energy operations dashboards. The focus is on enabling real-time pipeline visibility, secure data transmission, and centralized monitoring across pipeline networks, pumping stations, and remote infrastructure locations.


3. Pilot Deployment Across Pipeline Networks

Before full-scale implementation, Iottive deploys pilot monitoring solutions across selected pipeline segments, pumping stations, or remote energy infrastructure locations.

This includes testing:

Energy and utilities operators can validate system performance, leak detection accuracy, operational impact, and infrastructure compatibility in real-world conditions before scaling the solution across the entire pipeline network.


4. Pipeline Intelligence & Operational Monitoring

Iottive develops smart dashboards and pipeline intelligence platforms that provide real-time insights into:

  • Pipeline pressure and flow monitoring
  • Leak detection alerts and anomaly tracking
  • Asset integrity and corrosion monitoring
  • Pumping station performance metrics
  • Remote pipeline infrastructure visibility
  • Maintenance scheduling and predictive alerts
  • Environmental risk and compliance monitoring

Advanced analytics, AI-driven insights, and automated alerts empower energy and utilities teams to detect pipeline leaks early, reduce downtime, improve asset reliability, and ensure safe operations across large pipeline networks.


5. Enterprise Rollout & Infrastructure Scale-Up

From pilot deployments to large-scale pipeline monitoring systems, Iottive supports solution hardening, secure cloud scalability, edge device management, and long-term infrastructure monitoring support.

Smart pipeline monitoring solutions are designed for:

  • Large oil & gas pipeline networks
  • Water and utilities distribution pipelines
  • Remote energy infrastructure monitoring
  • Cross-region pipeline asset management
  • Continuous optimization using AI-driven insights

Our approach ensures measurable ROI through early leak detection, reduced environmental risk, improved pipeline integrity, predictive maintenance, and enhanced operational efficiency.


Why Energy & Utilities Operators Choose Iottive

  • Proven expertise in IoT pipeline monitoring and AIoT-driven energy infrastructure solutions
  • Deep understanding of pipeline integrity, leak detection, and utilities infrastructure operations
  • Seamless integration with SCADA systems, asset management platforms, and industrial monitoring systems
  • Secure, scalable, and production-ready pipeline monitoring architectures
  • Strong focus on measurable operational outcomes — leak prevention, safety, and efficiency

Contact Email: sales@iottive.com

Real-time energy grid load and voltage monitoring

Today’s power networks face immense pressure to stay stable and efficient. Operators need instant visibility into load demand and distribution performance. This data is crucial for preventing overloads and ensuring balanced power flow across the entire system.

Smart Energy Solution, Energy and Utilities, Smart Voltage Monitoring, IoT

Digital systems powered by connected devices are answering this call. They provide a continuous stream of critical operational data. This shift is fundamental for modern infrastructure management.

The scale of this transformation is global. Billions of smart meters and sensors are being deployed. These platforms help slash transmission losses and boost reliability. They also play a key role in cutting emissions and supporting cleaner power sources.

For utility companies, the benefits are clear. They gain stronger operational resilience and can meet growing demand more effectively. The economic and environmental impact of this technological shift is already significant.

Key Takeaways

  • Continuous data visibility is essential for maintaining modern grid stability and preventing failures.
  • Connected devices and sensors provide the instant information operators need to make informed decisions.
  • The utility sector is rapidly adopting this technology to meet sustainability targets and regulatory demands.
  • Global deployment of smart meters is accelerating, driven by clear economic and operational benefits.
  • These systems enable dynamic response to changing conditions and better integration of renewable power.
  • Organizations implementing these solutions see reduced operational costs and improved customer satisfaction.
  • The convergence of cellular connectivity and cloud analytics makes wide-scale monitoring economically viable.

Overview of Real-Time Energy Grid Monitoring

Real-time oversight of the power grid represents a fundamental leap beyond the limitations of historical data collection methods. This new paradigm provides a continuous, unified view of performance across vast distances.

A modern utility control center featuring a large digital dashboard displaying real-time data on energy grid load and voltage. In the foreground, sleek monitors with colorful graphs and numerical data provide an analytical overview. The middle ground showcases engineers in professional business attire, actively discussing insights while analyzing the data. The background reveals a futuristic room filled with advanced technology, large windows revealing a city skyline, softly illuminated by ambient lighting that enhances a high-tech atmosphere. The scene captures a sense of urgency and professionalism, highlighting the importance of real-time monitoring in energy management. The image is presented from a slightly elevated angle, showcasing both the dashboard and the engaged team.

Operators gain the instant visibility needed to maintain stability and efficiency. It’s a complete transformation in infrastructure management.

The Evolution of Energy Monitoring

For decades, management relied on manual readings and scheduled inspections. Data was localized and analysis suffered from significant delays.

This legacy approach created a reactive maintenance model. Issues were often addressed only after a failure occurred, impacting reliability.

Modern systems have changed this dynamic entirely. They deliver a constant stream of information on asset health and grid performance.

Key Technologies Powered by IoT

This shift is driven by connected technology. Traditional options like Wi-Fi and Zigbee often lack the range, security, and power profile needed for robust deployment.

Integrated platforms now provide the essential edge, connectivity, and cloud capabilities. Key components include advanced sensors, cellular networks, and powerful analytics.

These elements work together to create unified networks. The result is a move from simple measurement to predictive analytics and automated control.

This technological foundation enables truly data-driven decision-making. It was previously impossible with conventional systems.

Smart Energy Solution, Energy and Utilities, Smart Voltage Monitoring, IoT: Key Features

Effective infrastructure management hinges on the seamless fusion of live information streams and dependable communication pathways. These core capabilities define modern smart energy solutions.

Real-Time Data Collection and Analysis

Continuous data collection forms the operational backbone. Advanced sensors capture diverse metrics like wattage, radiance, and equipment vibration.

This real-time data is instantly processed. Sophisticated analysis identifies patterns and anomalies, transforming raw measurements into actionable intelligence for operators.

Edge computing capabilities further reduce latency. Preliminary processing at the source ensures critical alerts are delivered without delay.

A modern utility control center showcasing a sleek, high-tech environment focused on real-time smart grid data monitoring. In the foreground, display large digital dashboards with vibrant graphs illustrating grid load, voltage levels, and demand analytics in bright colors. The middle layer features professional technicians, dressed in business attire, intently analyzing the data on various screens and discussing insights. In the background, an expansive room filled with LED screens, showing a detailed map of the energy grid network, interconnected IoT devices, and power lines, all under soft, ambient lighting that creates a focused yet dynamic atmosphere. The angle should provide a wide view that captures the complexity of the workspace while emphasizing the integration of technology and teamwork in smart voltage monitoring.

Integrated Connectivity and Device Management

Robust connectivity is non-negotiable. Global network solutions ensure reliable links between distributed assets and central management systems, regardless of location.

The unified platform allows administrators to configure, monitor, and troubleshoot thousands of devices from a single interface. This centralized control is vital for large-scale deployments.

Secure, bi-directional command channels enable remote diagnostics and configuration updates. This integrated approach maintains system health and performance consistently.

IoT-Driven Innovations in Grid and Voltage Monitoring

The true power of a connected grid lies in the ability to command and update its vast array of sensors without physical touch. This requires sophisticated iot solutions built for centralized control.

Advanced Device Management and Remote Diagnostics

Modern platforms offer a unified dashboard for all deployed assets. Teams can see the health, status, and performance of every device across the network.

This visibility enables remote diagnostics. Technical staff can identify faults and often resolve them from headquarters. This slashes field service costs and cuts downtime dramatically.

A high-tech IoT device management interface, featuring an advanced utility control center with multiple screens displaying real-time grid load, voltage metrics, and demand analytics dashboards. In the foreground, a professional technician, wearing a smart business outfit, is interacting with a touch-screen panel, monitoring data. In the middle, vibrant graphs and charts are dynamically illustrating the energy flow and anomalies. The background showcases a sleek, modern office with ambient blue lighting and sophisticated electronic devices, emphasizing innovation in energy monitoring. The atmosphere is focused yet dynamic, embodying cutting-edge technology and efficiency, captured with a medium-angle lens for clarity and depth.

Over-the-Air (OTA) Updates and Scalability

Over-the-air update technology is a game-changer. Security patches and new features deploy remotely to thousands of devices at once.

Advanced systems verify compatibility and push updates live in under 30 seconds. This keeps infrastructure secure and current without risky manual work.

“The ability to remotely manage and evolve our monitoring assets is non-negotiable for modern operations. It turns a static grid into a dynamic, adaptable system.”

Scalability is built-in. Providers can start small and expand globally without changing core systems. Integrated solutions combine hardware, connectivity, and management in one place.

This reduces complexity. Organizations don’t need large engineering teams to launch. Data shows 90% of customers using such integrated iot solutions successfully scale within a year.

Aspect Legacy System Management Modern IoT-Driven Management
Update Method Manual, on-site visits required Remote, Over-the-Air (OTA) deployment
Fault Response Reactive, after failure occurs Proactive, remote diagnostics enable early intervention
Scalability Path Costly hardware overhauls and system redesigns Software-driven scaling on a single, API-driven platform
Operational Cost High (travel, labor, downtime) Significantly reduced through automation

These innovations empower operations teams. They maintain full control over distributed infrastructure with minimal manual use. The result is a more resilient and efficient grid.

Enhancing Energy Efficiency with Smart Metering and Connectivity

Granular visibility into power usage patterns enables unprecedented control over resources. This shift is powered by advanced metering infrastructure and reliable cellular links.

A modern utility control center showcasing smart metering technology and connectivity benefits. In the foreground, a sleek digital dashboard displays real-time analytics of grid load and voltage, featuring colorful graphs and metrics. In the middle ground, a diverse team of professionals, dressed in business attire, engages in discussion while examining the data. The background reveals large windows with a view of solar panels and wind turbines, emphasizing renewable energy integration. The lighting is bright and dynamic, creating an atmosphere of innovation and efficiency. The perspective is slightly angled, capturing both the detailed dashboard and the collaborative environment, illustrating the synergy between technology and teamwork in enhancing energy efficiency.

Remote Provisioning and Smart Metering Benefits

Remote device setup eliminates physical site visits. Providers configure and activate meters over-the-air, slashing deployment time and labor costs.

Embedded SIM technologies like eSIM ensure secure, reliable communication. They remove logistical hassles with physical cards. This supports sustainability by cutting material waste.

Data-Driven Insights for Energy Consumption

Continuous data collection reveals detailed consumption trends. Operators spot inefficiencies and anomalous patterns that may signal theft or faults.

Real-time visibility makes energy efficiency improvements measurable. Providers launch targeted conservation programs and verify results with accurate data.

Aspect Traditional Metering Advanced Smart Metering
Data Collection Manual reading processes Automated, continuous collection
Device Configuration Physical site visits required Remote provisioning & OTA updates
Consumption Insight Monthly or quarterly snapshots Real-time usage visibility
Billing Accuracy Often estimated Precise, data-driven billing
Operational Efficiency Reactive maintenance model Proactive anomaly identification

These smart metering benefits extend to improved billing accuracy and reduced revenue loss. Both providers and consumers gain tools to actively manage energy usage.

Strengthening Infrastructure Security and Operational Resilience

Protecting critical power networks from digital threats is now a top priority for operators worldwide. This focus extends beyond physical assets to safeguard the entire operational ecosystem.

An advanced utility control center filled with large screens displaying real-time energy grid load data and voltage analytics. In the foreground, a diverse group of professionals in business attire collaborates, pointing at colorful graphs indicating grid performance and stability. The middle layer features sleek, modern workstations, each equipped with intricate monitoring devices and LED indicators, suggesting high-tech operations. In the background, large windows showcase a cityscape at dusk, with subtle lighting that contrasts the vibrant activity inside. The atmosphere is focused and energetic, enhanced by blue and green lighting to symbolize technology and sustainability, capturing the essence of infrastructure security and operational resilience in energy management.

Data Privacy, Compliance, and Secure Communications

Modern platforms build trust through encryption and adherence to strict standards like SOC II, GDPR, and CCPA. These frameworks ensure sensitive information remains protected.

Secure communication channels are vital. They prevent interception and tampering as information flows between field devices and central systems. This layered defense is designed into the technology from the start.

Ownership of operational data stays with the provider. Information moves directly between the customer and their cloud via open APIs. This governance model meets regulatory demands while bolstering security.

Aspect Traditional Security Posture Modern Integrated Security
Data Encryption Often limited or applied inconsistently End-to-end encryption across all communication layers
Compliance Management Manual audits and reactive updates Automated compliance reporting for GDPR, CCPA, etc.
Access Control Basic password protection Multi-factor authentication and role-based permissions
Threat Response Reactive investigation after an incident Continuous monitoring with proactive anomaly detection

Proactive Condition Monitoring and Maintenance

Continuous oversight of the entire infrastructure enables predictive care. Advanced analytics spot subtle changes in asset performance.

This data-driven approach identifies maintenance needs before failures happen. It reduces unplanned outages and extends equipment life.

The right solution integrates smoothly with existing systems. This ensures enhanced operations and resilience without a disruptive overhaul.

Deployment Strategies for Smart Voltage Monitoring in Energy Systems

A successful rollout of new grid technology begins with meticulous planning and proven deployment methodologies. For energy providers, a phased strategy is essential. It starts with a pilot program in a representative segment of the distribution network.

This approach allows teams to validate the energy solution and refine procedures before scaling. Best practices include thorough site surveys and standardized installation protocols.

Best Practices and Real-World Deployment Examples

Successful deployment integrates new sensors with existing management systems. It requires robust communication links to connect all assets. Leading platforms power diverse iot applications, from electricity metering to solar farm monitoring.

These integrated systems gather real-time performance data on all asset types. Partnerships with technology specialists bring crucial expertise to the process. A real-world example includes LG U+’s implementation in smart water meters.

For distribution network operators, comprehensive monitoring delivers vital visibility. It helps balance load and maintain power quality across the entire grid. Clear communication with customers about new smart meters builds trust and promotes efficient usage.

Conclusion

Adopting advanced monitoring platforms marks a decisive step toward a more resilient and sustainable power infrastructure. These solutions deliver core operational benefits, including improved reliability and significant cost reductions.

The scale of this shift is immense. With billions of connected devices deployed globally, this technology drives substantial economic value. It is also projected to help cut sector emissions dramatically.

This capability is fast becoming a baseline standard. Providers must meet rising customer expectations for transparency and service. Integrated smart energy solutions offer the clear path forward for superior performance.

FAQ

What does real-time grid load and voltage monitoring involve?

This process involves continuously tracking the flow of electricity and voltage levels across the distribution network. Specialized meters and sensors collect information instantly. This allows utility operators to see the exact state of the grid, identify stress points, and prevent outages before they affect customers.

How do IoT applications improve grid oversight?

IoT connects physical meters and sensors to a central platform via secure communication networks. This enables automated data collection from thousands of points. Operators gain complete visibility into asset performance and consumption patterns, allowing for more dynamic and efficient management of the entire infrastructure.

What are the primary benefits of advanced metering infrastructure?

The main advantages include detailed visibility into usage for both providers and consumers. It enables accurate billing, detects outages faster, and helps balance supply with demand. For consumers, it offers insights to manage their electricity use and reduce costs, promoting greater overall efficiency.

Why is secure communication critical for these systems?

Protecting data and infrastructure is paramount. Secure communications, like encrypted cellular connectivity from providers like Telit Cinterion, prevent unauthorized access and cyber threats. This ensures customer information remains private and the physical grid remains resilient against attacks.

How do Over-the-Air updates support these deployments?

OTA updates allow providers to remotely deploy software upgrades and security patches to meters in the field. This eliminates costly manual visits, ensures all devices are running the latest firmware, and enables the rapid rollout of new features across the entire network.

Can this technology help with predictive maintenance?

Absolutely. By constantly analyzing performance data from grid assets, the system can identify subtle signs of equipment degradation. This allows maintenance teams to schedule repairs proactively, avoiding unexpected failures and extending the lifespan of critical infrastructure components.

Smart Retail shelf inventory mismatch detection to prevent lost sales

Lost sales in brick-and-mortar stores often happen quietly. A customer reaches for a product, but the shelf is empty. Your backend system says you have stock, but the physical reality tells a different story.

This gap between recorded inventory and actual stock levels is a critical challenge. It leads directly to missed revenue and frustrates shoppers. Modern operations need a way to see what’s happening at the point of sale in real time.

smart retail shelf inventory detection

Electronically connected shelving systems provide the answer. These intelligent units use IoT sensors and RFID tags to track product availability automatically. The global market for this technology is projected to reach $15.34 billion by 2030, highlighting its growing importance.

This guide will walk you through understanding the problem, exploring available technologies, and implementing a system step-by-step. It focuses on transforming inventory accuracy and operational efficiency for competitive stores. These systems bridge physical spaces with digital commerce expectations, preventing customer frustration.

Key Takeaways

  • Inventory mismatches between systems and shelves cause lost sales and customer frustration.
  • Real-time visibility at the point of sale is essential for modern retail operations.
  • Electronically connected shelving uses sensors and IoT to automatically track stock.
  • The market for intelligent shelving is growing rapidly, indicating its value.
  • Implementing these systems improves inventory accuracy and supports omnichannel strategies.
  • They help prevent out-of-stock situations and misplaced merchandise.
  • Accurate shelf data enables better replenishment and reduces revenue leakage.

Understanding the Importance of Accurate Inventory Management

The disparity between what a store’s system reports and what sits on its shelves is a primary profit leak. Precise inventory management is the foundation for operational efficiency and revenue protection in physical commerce.

When counts are wrong, every part of the business suffers.

Identifying the Causes of Inventory Mismatches

Several factors create this gap. Human error during manual counts is a major one. Theft, misplaced goods, and unreported damage also distort records.

A critical flaw is the lag between a sale at the register and the system update. This delay means data is always playing catch-up with reality.

causes of inventory mismatches

The Impact on Lost Sales and Customer Experience

Empty shelves mean lost sales. Shoppers will buy elsewhere or abandon their trip. This directly hits a location’s bottom line.

The shopping experience erodes when online promises don’t match in-store availability. Trust and brand loyalty fade. According to the National Retail Federation, in-store purchases can be more profitable, making shelf accuracy critical.

Real-time data from connected units minimizes out-of-stock scenarios. This leads to higher satisfaction and more return visits, securing future revenue.

Exploring the Technologies Behind Smart Shelves

A technological ecosystem of sensors, cameras, and digital labels turns ordinary shelving into a data hub. This combination provides the eyes and intelligence needed for accurate, real-time stock visibility.

Each component plays a distinct role in capturing and communicating inventory status.

Digital Shelf Labels and Their Multifunctional Roles

Electronic shelf labels (ESL) replace paper tags. These digital displays show pricing, promotions, and detailed product information instantly.

Advanced solutions like SOLUM Newton labels can show multiple pages of data. This helps with stocking tasks and attracts customer attention.

They integrate into central management systems. This allows for updates across all store locations from one platform.

technologies behind smart shelves

Shelf Sensors, Cameras, and RFID Integration

Weight sensors monitor shelf load continuously. They calculate removal and trigger restock alerts automatically.

IoT devices like motion sensors and cameras add another layer. Cameras use computer vision to spot empty spaces and track shopper engagement.

RFID tags enable item-level tracking. Radio frequency readers identify products from warehouse to shelf, improving accuracy.

Technology Primary Function Data Granularity Best Use Case
Digital Labels (ESL) Dynamic information display & price updates Shelf/Product SKU High-turnover items with frequent price changes
Weight Sensors Continuous load monitoring & removal detection Unit count by weight Bulk, uniform products like canned goods
RFID Tags Item identification & supply chain tracking Individual item level High-value goods, apparel, electronics

Choosing the right mix depends on product type and operational goals. Integration creates a powerful, unified system for inventory control.

Leveraging Smart Retail Shelf, Smart Retail Solution for Inventory Accuracy

Moving from traditional stock counting to automated, real-time tracking is a strategic project. It demands careful execution and a clear roadmap.

Retailers must begin with a thorough assessment. This includes auditing high-priority items and calculating the expected return on investment.

A phased rollout minimizes disruption. Start with a pilot program in one store section to test performance.

Step-by-Step Implementation Guide for Retailers

The first phase involves vendor selection and hardware procurement. Ensure new technology is compatible with your current systems.

Installation includes physical retrofitting of units and sensor mounting. Network infrastructure must support continuous data flow.

Comprehensive training for staff is critical. They need to learn new workflows and how to respond to restock alerts.

After deployment, a calibration phase fine-tunes the system. Validate sensor accuracy and refine alert thresholds.

Implementation Phase Key Activities Success Metric
Pre-Assessment Inventory audit, ROI calculation, pain point identification Clear business case defined
Pilot Deployment Limited section rollout, workflow refinement, integration testing Measurable accuracy improvement
Full Integration API connections to POS & ERP, staff training, network setup Unified operational intelligence
Optimization KPI tracking, threshold adjustment, continuous feedback Reduction in out-of-stock incidents

implementation guide for inventory accuracy

Integrating with Existing Systems and IoT Connectivity

Seamless connection to your existing tech stack is non-negotiable. API links to inventory management and point-of-sale platforms create a single source of truth.

The IoT architecture decides how data moves. Cloud-based options offer scalability, while edge computing reduces latency.

“Integration is where data turns into actionable insight. It bridges the gap between the physical shelf and the digital ledger.”

Strong cybersecurity measures protect this valuable data stream. This ensures business continuity and customer trust.

This holistic approach transforms operations. It turns real-time shelf data into a powerful tool for growth.

Utilizing Data Analytics and Insights to Enhance Retail Operations

Analytics platforms turn raw sensor data from store fixtures into strategic insights for boosting sales and service. This intelligence moves beyond simple stock counts.

It reveals detailed patterns in consumer behavior and product performance. Retailers gain a powerful tool for decision-making.

Tracking Customer Behavior and Optimizing Store Layouts

Heat maps show where shoppers linger and which items they pick up. Dwell time analysis indicates engagement levels.

This data directly informs planogram redesign. High-margin goods can be placed in premium, high-traffic zones.

Complementary product adjacencies are tested and refined. The result is a layout that guides the shopper journey and increases basket size.

data analytics retail operations

Improving Operational Efficiency with Real-Time Data

Live inventory feeds enable just-in-time restocking. This minimizes backroom stock and wasted labor.

Staff schedules align with predicted peak restocking needs. Automated alerts replace manual shelf checks.

This streamlines operations and cuts costs. Capital is not tied up in excess stock.

Dynamic Pricing and Promotional Strategies

Digital price tags can update instantly based on algorithms. Prices adjust for demand, time of day, or competitor actions.

Promotions are tested in real-time. Their effectiveness is measured by immediate sales velocity.

This agile approach maximizes revenue per product. It turns pricing into a dynamic brand strategy.

Conclusion

Forward-thinking retailers are turning to intelligent store fixtures to secure their future in a competitive market. This technology directly tackles the costly problem of inventory mismatches. It prevents lost sales and protects customer relationships.

Real-time monitoring eliminates stockouts and optimizes staff labor. Shoppers enjoy a better experience with consistent product availability. These multi-layered benefits create a strong value proposition for any store.

The move to data-driven operations is now a strategic necessity. Begin with a pilot program in a single location. Then, expand and optimize using advanced analytics.

Success requires commitment to training and system integration. Looking ahead, these connected smart shelves will evolve with AI and predictive tools. They form the foundation for a truly responsive retail environment.

FAQ

How does a Smart Retail Shelf solution directly prevent lost sales?

It prevents lost sales by providing real-time visibility into stock levels. When an item is out of place or low, the system instantly alerts staff for restocking. This ensures customers always find what they need, directly converting browsing into purchases and protecting revenue.

What are the core technologies powering these intelligent store displays?

The core technologies include weight sensors, RFID tags, and small cameras. RFID allows for precise, bulk item tracking without line-of-sight. Sensors detect when products are removed, while digital labels update prices instantly. This ecosystem works together to create a live view of merchandise.

Is implementing this technology disruptive to a store’s current operations?

Not typically. Modern solutions are designed for seamless integration. They connect with existing inventory management and point-of-sale systems. Implementation is often a phased process, starting with high-value aisles, minimizing downtime and allowing staff to adapt smoothly to the new workflow.

Beyond stock control, what other benefits do these systems offer?

They generate powerful analytics on consumer behavior. Retailers like Walmart gain insights into which items are frequently handled together or which displays attract attention. This data informs better store layouts, dynamic promotional strategies, and optimized product placements to boost overall performance.

How does this technology improve the shopper’s in-store experience?

It creates a frictionless journey. Accurate stock means no disappointment. Digital labels ensure correct pricing. For associates, the system frees them from manual counts, allowing more time for customer service. This leads to a more efficient, satisfying, and modern shopping trip.


How Iottive Delivers End-to-End Smart Retail Solutions

1. Retail Strategy & Solution Design

Iottive collaborates with retail leaders, digital heads, store operations teams, and supply chain stakeholders to understand customer journeys, inventory challenges, and growth objectives. This phase includes retail use-case validation, omnichannel architecture design, IoT device selection, AI personalization planning, and defining measurable KPIs such as promotion ROI, stock accuracy, and conversion rates.


2. Smart Systems Engineering & Retail Integration

Iottive engineers scalable Smart Retail solutions by integrating IoT sensors, RFID, smart shelves, digital mirrors, edge devices, and cloud platforms. We ensure seamless connectivity between POS systems, ERP, CRM, warehouse systems, and e-commerce platforms. The focus is on real-time visibility, secure data flow, and unified customer and inventory intelligence across stores and digital channels.


3. Pilot Deployment in Stores & Warehouses

Before enterprise rollout, Iottive deploys pilot solutions in selected retail stores, warehouses, or pharmacy locations. This includes testing AI-driven recommendations, smart inventory tracking, cold chain monitoring systems, and digital try-on experiences. Retailers can validate performance, customer engagement impact, and operational feasibility in live environments before scaling across locations.


4. Customer Experience & Retail Intelligence

Iottive builds intuitive dashboards and retail intelligence platforms that provide real-time insights into:

  • Customer behavior & segmentation
  • Promotion performance & ROI
  • Store-level inventory accuracy
  • Warehouse efficiency metrics
  • Cold chain compliance tracking
  • Online conversion and upsell analytics

Advanced analytics, alerts, and AI-driven insights empower retail teams to make faster, data-driven decisions that improve revenue, reduce losses, and enhance customer satisfaction.


5. Enterprise Rollout & Retail Scale-Up

From MVP to multi-location deployment, Iottive supports solution hardening, cloud scalability, cybersecurity, and long-term support. Smart Retail solutions are designed for:

  • Multi-store expansion
  • Omnichannel integration
  • Regional inventory balancing
  • Cross-border retail operations
  • Continuous optimization using AI insights

Our approach ensures measurable ROI through improved customer engagement, reduced shrinkage, better inventory control, and operational efficiency.


Why Retailers Choose Iottive

  • Proven expertise in Smart Retail & IoT-driven transformation
  • Deep understanding of store operations, warehousing, and pharmacy compliance
  • Seamless integration with POS, ERP, CRM, and e-commerce platforms
  • Secure, scalable, and production-ready retail architectures
  • Strong focus on measurable business outcomes — not just technology

📧 Contact Email: sales@iottive.com