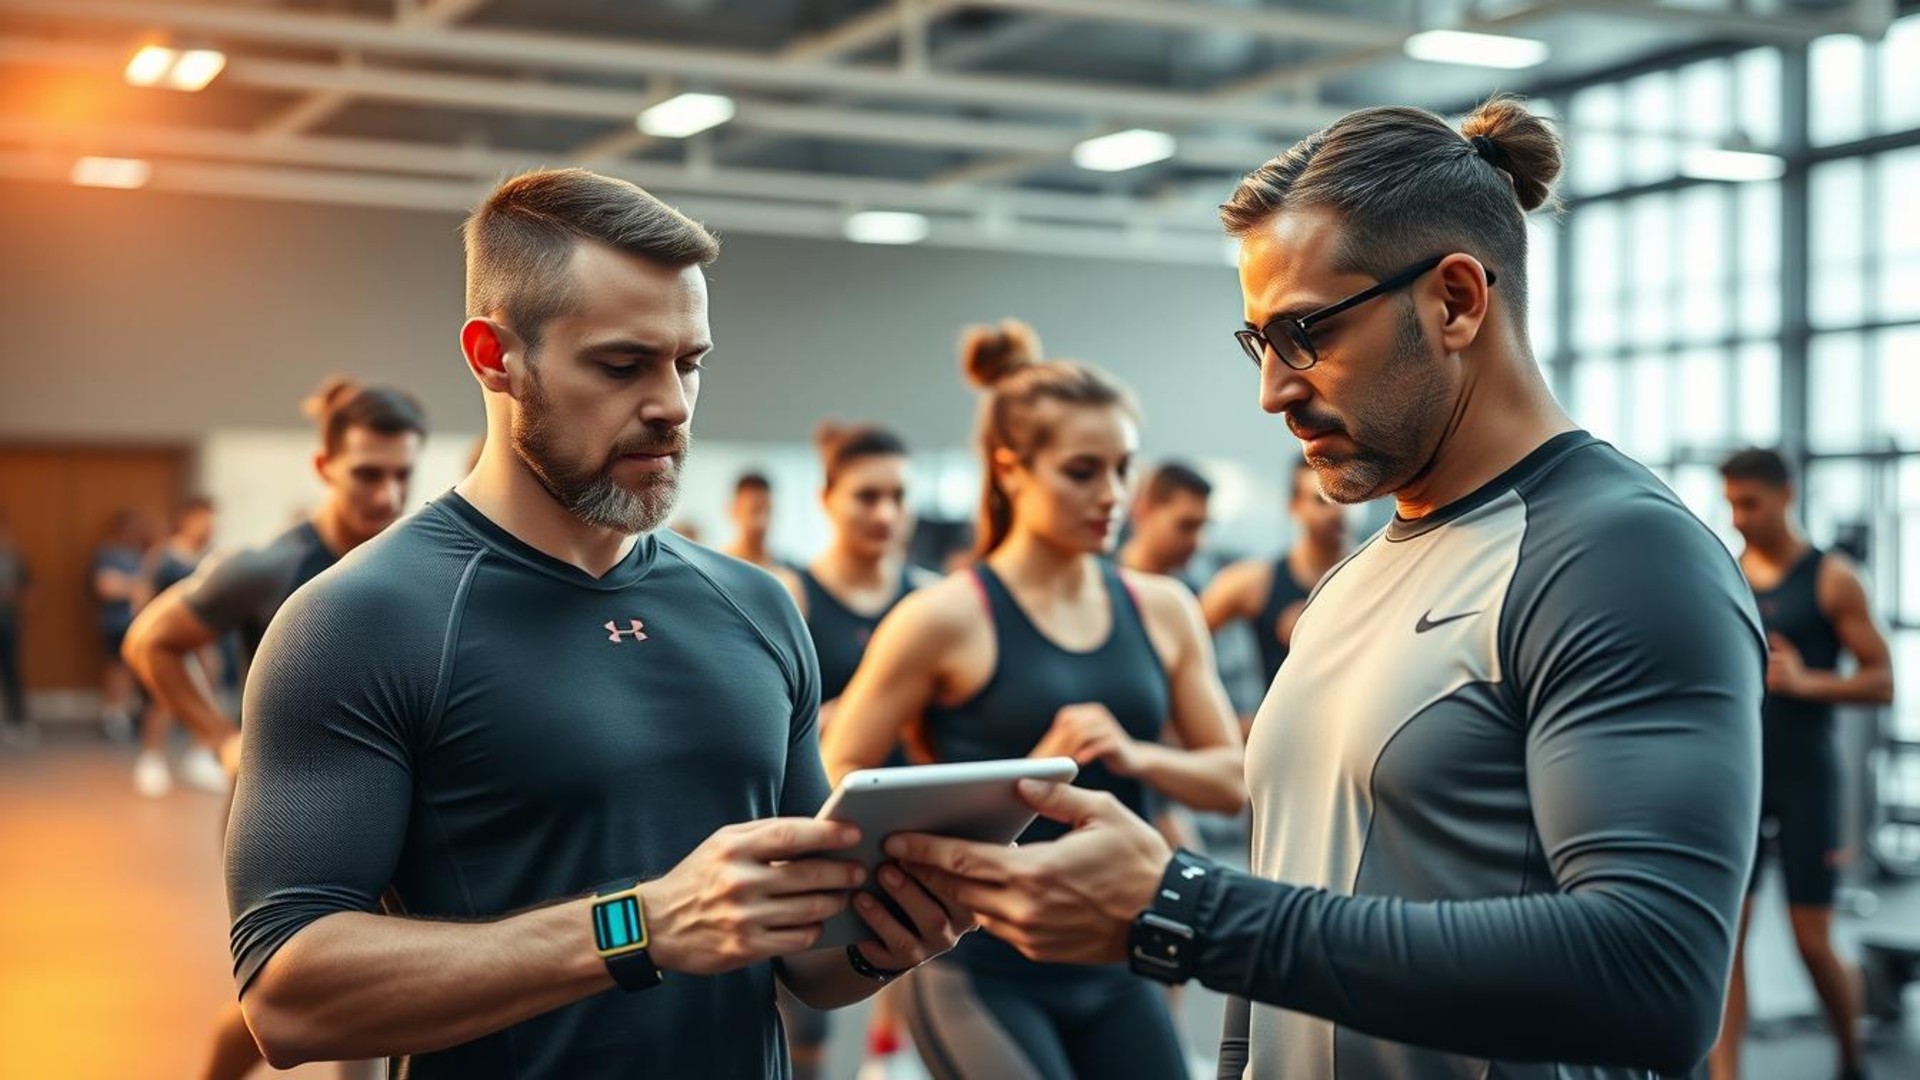
AIoT and LED Therapy: Transforming Patient Recovery and Rehabilitation

Recovery in long-term care is changing fast. A 12-week trial using an AIoT-based assistive ergometer, AIFASE, showed older residents gained hip flexor strength and better balance. These results point to real, measurable benefits from smart, connected therapy.

Smart systems combine sensors, BLE links, and cloud apps to deliver tailored exercise plans and live safety alerts at set %MHR limits. That safety layer helped prevent overexertion while tracking progress with TUG and SPPB scores.

Iottive’s experience building BLE apps, LAMP cloud backbones, Android and responsive web apps shows how to scale these solutions. Multi-site control, role-based access, and EHR-adjacent workflows make deployment across U.S. facilities practical and secure.

AIoT Patient Rehabilitation

The article will unpack system architecture, personalization algorithms, privacy safeguards, and clinical outcomes. Clinicians and rehab directors will find actionable guidance on deploying LED therapy and smart devices to reduce fall risk and improve function.

Key Takeaways

  • Clinical evidence: A 12-week AIFASE trial improved strength and balance in older adults.
  • Safety first: Real-time %MHR alerts and workload monitoring limit overexertion.
  • Scalable stack: LAMP cloud, Android app, Webapp, BLE ergometers, and HR sensors enable multi-site control.
  • Who benefits: Clinicians, rehab directors, and U.S. healthcare operators evaluating secure BLE platforms.
  • Why it matters: Low activity and staffing strains make automation and data-driven plans essential.

Context: Why AIoT and Light-Based Modalities Matter in Rehabilitation

Rising frailty in older adults calls for tech-enabled strategies that preserve strength and mobility. Frailty affects more than 10% of people aged 65+ globally, and rates in long-term care can exceed 19%–85%. Low activity and accelerated muscle loss reduce independence and raise fall risk.

Exercise matters. Resistance and aerobic training improve muscle strength, gait speed, and physical performance. Stronger residents fall less and regain function faster.

Staffing shortages make consistent therapy hard to deliver. BLE-connected ergometers and wearable sensors let teams monitor sessions remotely. Cloud dashboards centralize progress and simplify documentation across sites.

A serene healthcare facility with cutting-edge AIoT and LED therapy technologies. In the foreground, a patient undergoing personalized light therapy, their face bathed in a warm, soothing glow as they focus intently on regaining motor skills and cognitive function. The middle ground features state-of-the-art monitoring equipment and smart sensors, seamlessly integrated to track progress and optimize treatment. The background showcases a calming, nature-inspired interior design, with large windows allowing natural light to flood the space, creating a tranquil, restorative atmosphere. Soft, diffused lighting illuminates the scene, conveying a sense of hope and healing.

Positioning light-based therapy alongside sensor-driven exercise

LED therapy can support circulation and recovery when scheduled with exercise. Protocols can be automated so light delivery aligns with workload progression and perceived exertion.

“Pairing device data with decision rules helps clinicians match sessions to capacity and safety thresholds.”

Iottive delivers IoT & AIoT Solutions, BLE App Development, and Cloud & Mobile Integration that enable smart device and LED therapy ecosystems for healthcare. This integrated approach supports safety, reporting, and scalable programs despite limited rehab manpower.

User Intent and What You’ll Learn

For clinicians and rehab directors: this section outlines practical steps to adopt connected exercise and light therapies while keeping safety, outcomes, and staffing efficiency front and center.

What the trial showed: an automated prescription engine, real-time physiologic monitoring, and graded alerts delivered 3–5 guided sessions per week. Those sessions improved hip flexor strength and balance versus routine activities alone.

The following points map real-world applications and operational gains.

A sleek, modern desktop interface showcases a diverse array of software applications, each representing a different aspect of patient rehabilitation and recovery. In the foreground, intuitive user control panels allow seamless management of AIoT-powered LED light therapy, with vibrant color palettes and intuitive icons. The middle ground features a central dashboard displaying real-time biometric data and progress analytics, all rendered in a clean, minimalist aesthetic. In the background, a serene, subtly-lit environment sets the tone for a calming, therapeutic experience, with muted tones and soft lighting guiding the user's focus to the essential tools at hand.

  • Who benefits: medical directors, PT/OT leads, and administrators evaluating measurable outcomes, safety assurance, and staff utilization.
  • Key takeaways: decision trees tailor doses; %MHR alerts mitigate overexertion; dashboards let supervisors oversee multiple residents.
  • Operational wins: automated capture reduces charting, role-based access standardizes oversight, and multi-site controls keep programs consistent.
  • Clinical relevance: gains in hip flexor strength and balance lower fall risk and support greater independence in daily activities.
  • Setup: BLE ergometers and HR sensors pair with an Android App and responsive Webapp for real-time tracking and course management.

“A gender-stratified randomized approach provided structured evidence that adding guided sessions outperformed routine-only care.”

Extensibility & governance: the same device backbone can orchestrate complementary light protocols, while location-based authorization and one-way privacy preserve confidentiality.

Iottive’s End-to-End IoT/Smart Solutions and cloud & mobile integration can speed pilots to production and align deployments with U.S. compliance expectations.

Case Overview: An AIoT-Enabled Strengthening Program in a Long-Term Care Facility

This 12-week trial examined whether guided, sensor-linked ergometer sessions add measurable strength and balance gains to routine care.

Setting, participants, and program scope

The single-site study enrolled 16 residents (mean age 84.38 ± 6.0 years; 4 males, 12 females) living in a U.S. long-term care facility. The 12-week timeframe targeted detectable functional change in very old adults while fitting facility schedules.

A long-term care facility's rehabilitation center, bathed in a warm, soothing glow of AI-controlled LED lights. In the foreground, a patient diligently works through a series of guided exercises, their movements tracked by a network of integrated sensors. The middle ground showcases advanced monitoring equipment, discreetly gathering data to inform the personalized strengthening program. In the background, a serene, calming environment with natural elements, designed to promote mindfulness and cognitive recovery. The scene exudes a sense of progress and empowerment, as the patient harnesses the power of AIoT technology to regain their independence and improve their overall wellbeing.

Intervention vs. control: maintaining routine activities with added device-guided training

Inclusion required age ≥65 and mental competence; major orthopedic or severe musculoskeletal conditions and inability to follow instructions were excluded. All participants kept 1 hour/week of standard physical training.

The intervention group added AIFASE-guided sessions 3–5 times per week. The control group continued routine activities only. Randomization was gender-stratified (1:1) to balance baseline strength and function.

  • Outcome domains: lower-extremity strength, TUG, SPPB, body composition (InBody S10), and health-related quality-of-life questionnaires.
  • Monitoring: automated logs and dashboards tracked adherence and reduced staff charting burden.
  • Operational note: guided sessions were designed to layer onto existing programs rather than replace them, keeping staff effort feasible.

Iottive builds custom IoT platforms that support pilot-to-scale programs, adapting BLE and cloud capabilities for multi-site clinical implementations.

System Architecture: Cloud, Mobile, and Bluetooth Foundations that Scale

Practical deployments depend on a secure cloud backbone, responsive apps, and reliable Bluetooth device pairing. This architecture lets clinical teams run pilots and expand to enterprise networks without redesigning core systems.

A sleek, futuristic system architecture showcasing the seamless integration of cloud computing, mobile devices, and Bluetooth technology to power AIoT-driven LED light therapy for patient rehabilitation. The image depicts a clean, minimalist design with a central tower server surrounded by interconnected mobile devices and LED light panels, all bathed in a warm, calming glow. The lighting and angles convey a sense of precision and efficiency, reflecting the advanced capabilities of this cutting-edge system. The overall aesthetic evokes a high-tech, yet soothing environment suitable for a healthcare setting focused on aiding patient recovery and improving motor skills and cognitive function.

LAMP stack backbone with secure HTTPS and SSL

The platform uses a LAMP stack: Linux, Apache/2.4.29 (HTTP/HTTPS), MySQL/5.7.37, and PHP/7.2.24, secured with an SSL certificate. Open-source components give transparency and upgrade paths while HTTPS and SSL protect data in transit.

Android App + Webapp: responsive management for clinical workflows

An Android App built in Android Studio pairs with clinical hardware over BLE for session control. The PHP Webapp uses responsive design so supervisors can review progress from desktops, tablets, or phones.

BLE integrations: ergometer and heart rate sensor connectivity

BLE links connect the Ventek RE-X4 ergometer and Scosche Rhythm24 heart rate sensor to capture real-time workload and physiologic data. This removes tethered wiring and speeds station setup in therapy gyms or rooms.

Multi-site support and role-based access for care teams

Hosted on NCKU Cloud with load balancers and Citrix NetScaler 9500 firewalls, the system scales while preserving uptime and security. Location-based authorization isolates sites; role-based controls limit functions to clinical staff.

  • Management modules: user & role controls, site segmentation, device inventory, case records, course management, and evaluation histories.
  • Scalability: central configuration and audit trails support single-site pilots to regional rollouts in U.S. settings.
  • Extensibility: LED therapy devices can be paired via BLE or gateways and orchestrated through the same App/Webapp workflows.

“A hardened LAMP backbone, secure hosting, and BLE device orchestration create a practical path from pilot to production.”

Iottive specializes in BLE App Development and Cloud & Mobile Integration and has built similar stacks for healthcare and other sectors that require robust device orchestration and governance.

Data Pipeline, Privacy, and Cybersecurity for Healthcare-Grade AIoT

Protecting sensitive health signals begins at the device and follows a clear chain to the cloud. Data captured during training flows from BLE devices to the Android App, then to an SSL-encrypted REST endpoint and the cloud database. Frontend checks authenticate users, and every transaction is logged for auditability.

Location-based authorization treats each facility as an independent field. This one-way privacy model limits cross-site access and reduces the blast radius if credentials are compromised.

Algorithms run as post-processing tasks in the cloud, avoiding real-time control of devices. That design reduces cyber-physical risks and keeps safety-critical logic at the edge where staff can intervene.

  • Data exchange is constrained: user merges occur only when the same identity appears at multiple sites.
  • NCKU Cloud hosting adds load balancers and enterprise firewalls to improve uptime and block common attacks.

Governance includes device identity checks, signed firmware, and traceable update logs. These controls support explainability, least-privilege access, and U.S.-grade audit readiness.

“Protected data paths and compartmentalization enable clinical oversight while limiting exposure.”

Intelligent Personalization: Decision Trees that Auto-Tune Exercise Prescriptions

A rules-based decision tree merges timed functional tests and session feedback to create safer, individualized exercise plans.

Combining objective capacity and perceived exertion

The model uses objective capacity metrics like TUG thresholds (20 s = lower) and follows each session with a perceived exertion score.

Together, these inputs align workload with how users actually tolerate sessions, not just theoretical capacity.

Time-first progression for frail users

For lower-capacity profiles, the algorithm increases session time before raising resistance. This builds endurance and confidence without sudden strain.

When time surpasses 20 minutes, the logic shifts: resistance steps up while time reduces, keeping overall load controlled.

Adaptive workload iteration

Each session feeds back into the tree. If exertion stays in target zones and performance improves, the system raises workload one step. If exertion spikes or HR thresholds trigger, the tree holds or backs off.

  • Consistency: automated prescriptions standardize care across shifts and sites.
  • Adherence: tailored challenges keep sessions achievable and motivating.
  • Transparency: decision paths are viewable by clinicians, aiding documentation and oversight.

“Encoding clear rules into cloud services and mobile UX lets therapists trust and review each progression.”

Input Initial Action Follow-up Rule
TUG < 10 s Start moderate resistance, 12–15 min Increase time to 20 min, then raise resistance
TUG 10–20 s Start low resistance, 10–15 min Prioritize time-first increments; raise resistance after 20 min
TUG > 20 s Begin with minimal resistance, 6–10 min Slow time increases; require low perceived exertion before resistance rise
High perceived exertion or HR alert Hold progression; notify clinician Reduce resistance or time and reassess next session

Extension to light protocols: the same tree can set LED session duration, intensity, and placement rules to complement exercise.

Iottive encodes these clinical decision trees into scalable cloud services and mobile workflows so therapists can review, adjust, and trust auto-tuned prescriptions.

Real-Time Safety: Heart-Rate-Based Alerts and Overexertion Prevention

Live physiologic alerts turn raw sensor data into actionable safety cues for clinicians. The system computes %MHR as current heart rate ÷ (208 − 0.7 × age) × 100%, giving an age-adjusted view of intensity that fits older adults.

%MHR thresholds and graded alerting

Two-tier alerts warn staff when intensity rises. An orange alert sounds and flashes at 85% MHR. A red alert and louder alarm trigger at 90% MHR.

Immediate cross-platform notifications

Notifications appear instantly on both the Android App and the Webapp so the participant and supervising staff get the same cue at once.

  • Staff actions: reduce workload, pause the session, or perform a quick clinical check.
  • Scaling benefit: real-time visibility lets supervisors safely monitor multiple stations.
  • Device notes: use validated HR sensors like Scosche Rhythm24 and maintain stable BLE links to prevent gaps.
  • Audit trails record every alert for quality review and incident reporting.

“Standardized alert logic reduces variability and supports team training.”

Iottive’s BLE device integration and cloud/mobile orchestration deliver low-latency alerts and can extend checks to LED sessions (contraindication and timeout rules) for safer, policy-aligned workflows.

Clinical Protocol and Outcome Measures

This section outlines the clinical protocol and the measures used to judge functional change over the 12-week trial.

Gender-stratified randomization and session cadence

The study used a randomized, gender-stratified 1:1 allocation to balance baseline strength and balance differences between men and women.

Why stratify: it reduces imbalance in initial function and improves comparability of outcomes.

The intervention group added 3–5 guided AIFASE sessions per week to the facility’s routine schedule. Both groups kept 1 hour/week of standard training to isolate the device effect.

Assessments: TUG, SPPB, muscle strength, body composition

Baseline (week 0) and post-intervention (week 13) evaluations included Timed Up and Go (TUG), Short Physical Performance Battery (SPPB), and targeted lower-extremity strength tests.

Body composition used InBody S10 bioimpedance to report appendicular skeletal muscle (ASM) and skeletal muscle index (SMI). These metrics help link strength gains to mass and composition changes.

Quality-of-life and safety screening

Health-related quality-of-life questionnaires captured patient-centered outcomes tied to function and independence.

Eligibility required age ≥65 and cognitive ability to follow instructions; exclusions removed severe orthopedic or musculoskeletal limitations to protect safety.

  • Data integrity: automated logs and timestamped records minimized manual errors and supported precise pre/post comparisons.
  • Reproducibility: standardized measures and scheduling templates make replication at U.S. sites straightforward.
  • Operational support: Iottive’s platform enables study-grade data capture and BLE-connected assessments to align with healthcare quality metrics and documentation needs.

“Standardized protocols and automated capture let teams focus on care while preserving rigorous outcome data.”

Results: Functional Gains and Strength Improvements with AIoT Guidance

The 12-week trial produced measurable improvements in hip flexor strength and standing balance for the intervention group.

Improved hip flexor strength and balance (Semi-Tandem, Tandem Stand)

Hip flexor strength increased significantly versus controls, supporting safer sit-to-stand transfers and stair use.

Semi-tandem and tandem stand performance also improved, indicating better static postural control and reduced sway.

Implications for fall risk and independence in long-term care

Stronger hip flexors and steadier tandem stands translate to lower fall risk, higher confidence, and easier daily mobility.

  • Downstream effects: fewer near-falls, potential care-burden reduction, and improved ADL independence.
  • Why it worked: individualized dosing via decision trees and consistent monitoring—not just higher session volume—drove progress.
  • Safety & adherence: real-time heart-rate alerts and session feedback maintained adherence while protecting participants.

Limitations include single-site scale and small sample size, though gender-stratified randomization strengthened internal validity.

“These results suggest device-guided programs can add value without displacing routine therapy.”

Next steps should include multicenter validation, LED adjunct trials, and longitudinal tracking of falls and hospitalizations. Iottive can help U.S. providers measure and benchmark functional outcomes across networks to inform ROI on fall-reduction and throughput initiatives.

AIoT Patient Rehabilitation: Applications for U.S. Healthcare Providers

Health systems can translate device-driven trials into clinic-ready services that cut fall risk and streamline workflows.

Extendable device set-up: the platform connects RE-X4 ergometers and Scosche Rhythm24 sensors via an Android App and a responsive Webapp. LED therapy devices join the same BLE ecosystem with protocol management, dosing logs, and safety interlocks.

Integrations and remote monitoring

EHR-adjacent exports, APIs, and configurable reports keep documentation aligned with clinical records without deep HIS changes. Cloud dashboards and mobile alerts enable remote oversight for step-down or outpatient follow-up.

  • Translate the case into fall-prevention, restorative nursing, and therapy-gym modernization.
  • Onboard: device validation, staff training, protocol setup, and dashboard customization.
  • Governance: location-based authorization, role-based access, and post-processing algorithms preserve privacy and safety.
  • Scale: pilot → unit rollout → network expansion behind load balancers and firewalls.

Iottive offers IoT & AIoT Solutions, BLE App Development, and Cloud & Mobile Integration to connect LED therapy and smart devices for U.S. providers.

Contact: www.iottive.com | Sales@iottive.com

About Iottive: IoT, AIoT, and Mobile Expertise for Healthcare and Beyond

From firmware to dashboards, Iottive crafts end-to-end solutions that make smart devices reliable at scale.

We combine Bluetooth device connectivity, mobile apps, and secure cloud services to deliver custom platforms that align with clinical workflows and enterprise needs.

Our expertise

  • Device connectivity (BLE): validated ergometer and heart-rate sensor pairing.
  • BLE app development: Android apps and responsive Webapps for real-time control.
  • Cloud & mobile integration: LAMP-based hosting, SSL, load balancing, and audit trails.

Industries served

Healthcare, Automotive, Smart Home, Consumer Electronics, and Industrial IoT benefit from our cross-industry experience. That breadth hardens reliability and scalability for medical deployments.

Let’s build your custom platform

We scope requirements, design UX, integrate firmware, and deploy data pipelines and dashboards tailored to goals. Security and privacy-by-design mirror location-based authorization and protected data exchange from the case study.

“We focus on measurable outcomes, decision-tree personalization, and staffing efficiencies through automation and real-time insights.”

Capability Value Use Case
BLE Device Integration Low-latency telemetry and pairing Ergometers, HR sensors, LED orchestration
Cloud & Security SSL, firewalls, multi-site isolation HIPAA-aligned data partitioning and audits
Decision Engines Transparent rules and clinician review Personalized exercise and light protocols

Next steps: start with a discovery workshop, pilot deployment, and technical sprint to align with U.S. regulations.

Contact: www.iottive.com | Sales@iottive.com

Conclusion

Adding guided, sensor-linked sessions to routine activities yielded clear, clinically relevant gains in hip flexor strength and tandem standing.

The 12-week, gender-stratified trial showed measurable improvement in balance and strength while keeping standard care intact. Decision-tree personalization, TUG- and exertion-aligned progressions, and live %MHR alerts enabled safe, data-driven advances.

Operationally, the setup proved feasible: BLE device pairing, dashboards, and alerting reduced charting load and let staff monitor multiple stations. The LAMP-based cloud, SSL, load balancers, and role/location controls support secure scale across sites.

For U.S. providers, extendable LED therapy and broader smart-device ecosystems can reuse the same backbone. Start with a single-site pilot that tracks TUG, SPPB, strength, and falls, and adopt SOPs for alerts and transparent decision-tree logic.

Iottive can help design and deploy end-to-end AIoT solutions that integrate BLE devices, cloud workflows, and LED therapy into scalable programs. Contact: www.iottive.com | Sales@iottive.com

FAQ

What is the role of connected light-based therapy combined with sensor-driven exercise in long-term care?

Combining targeted light therapy with connected exercise devices and wearable sensors helps improve strength and balance for residents with low activity. The approach uses data from Bluetooth-enabled ergometers and heart-rate monitors to tailor sessions and reduce fall risk while tracking progress in a secure cloud platform.

How does the system ensure safety during exercise sessions?

Safety relies on real-time monitoring and alerting. Heart-rate thresholds trigger graded notifications—an orange alert for near-max exertion and a red alert for overexertion—sent to both mobile apps and the web dashboard. Role-based access and localized authorization also limit who can change protocols.

What infrastructure supports multi-site deployment and clinical workflows?

The architecture uses a LAMP-style backend with HTTPS/SSL for secure transport, a responsive Android app plus webapp for staff, and BLE integrations for devices. Multi-site support and role-based permissions let administrators manage locations and staff access centrally.

How are exercise prescriptions personalized for frail residents?

Personalization combines objective tests like the Timed Up and Go (TUG) with subjective exertion ratings. Decision-tree logic prioritizes time-based progression before resistance increases for frail users, then iteratively adapts workloads based on performance and safety signals.

What outcome measures does the program track to demonstrate effectiveness?

Clinicians monitor TUG, Short Physical Performance Battery (SPPB), targeted muscle strength (for example, hip flexors), body composition, and quality-of-life questionnaires. These metrics help quantify balance gains and functional independence over the program.

How does the platform protect patient data and comply with healthcare privacy standards?

Data protection uses encrypted transport, cloud database design with load balancing, firewalling, and location-based authorization. One-way privacy principles and protected data exchange minimize exposure while supporting necessary clinical access.

Can LED therapy devices integrate with existing electronic workflows and EHR-adjacent systems?

Yes. BLE-enabled light therapy units and sensors can feed session summaries and event logs into mobile and webapps. APIs and integration layers support sending structured summaries to EHR-adjacent tools and remote monitoring services.

What staffing efficiencies can facilities expect from a connected strengthening program?

Automation of progression rules, remote monitoring, and centralized dashboards reduce direct supervision time. Staff can manage multiple participants with real-time alerts and role-specific views, improving throughput without sacrificing safety.

How do clinicians handle device connectivity issues in the field?

The app includes device health checks and pairing workflows for BLE ergometers and heart-rate sensors. Connectivity logs surface failures to the web dashboard, and standard operating procedures guide staff through quick re-pairing and fallback options.

What clinical populations benefit most from this combined approach?

Older adults in long-term care and residents with reduced mobility see the largest gains. The model also applies to outpatient rehab where remote monitoring, adaptive prescriptions, and light-based adjuncts support recovery and reduce readmissions.

How does the system handle multi-site data segregation and role-based access?

Authorization by location ensures staff access only their assigned facilities. Role-based access controls differentiate clinicians, therapists, and administrators, while centralized tenancy manages multi-site deployments without data commingling.

What evidence supports improvements in balance and hip flexor strength?

Controlled implementations using randomized allocation and gender-stratified groups show measurable increases in hip flexor strength and improved semi-tandem and tandem stand performance. Those gains correlate with lower fall risk and better independence scores.

How quickly do participants typically show functional improvements?

Early gains often appear within weeks for balance and endurance, with strength improvements evident across several months of consistent, adaptive sessions. Progress depends on baseline capacity and adherence to recommended cadence.

Are there standards for cyber hygiene for devices in this ecosystem?

Yes. Best practices include SSL/TLS transport, regular firmware updates for BLE devices, network segmentation, intrusion detection, and scheduled security audits to maintain healthcare-grade protections.

What support is available for customizing an IoT-enabled rehab platform for a facility?

Development partners with experience in IoT, BLE app development, cloud integration, and clinical workflows can design tailored solutions. They provide needs assessment, pilot deployments, and scaling plans to align technology with care goals.


Let’s Get Started

The Future of Trucking: AI Collision Avoidance in Autonomous Freight

One evening a fleet manager watched a vehicle on the highway swerve to avoid a stalled car. Her phone pinged with live sensor data, and a cloud alert had already flagged the event. She sighed with relief as remote diagnostics confirmed the fleet avoided a serious incident.

This scene shows how perception, fast decision-making, and actuation come together to keep loads moving. Modern systems combine LiDAR, radar, and cameras with onboard control to reduce human-error crashes. That mix builds trust across an industry under cost and time pressures.

AI truck safety, autonomous freight collision prevention, smart AV braking

Readers will see three themes ahead: AI truck safety, autonomous freight collision prevention, and smart AV braking. Data-driven models learn with miles and updates, improving situational awareness in varied traffic and weather.

Iottive connects edge sensors, mobile apps, and cloud platforms to move vehicle data securely so fleet operators get real-time alerts, diagnostics, and blind-spot info. That integration delivers clear benefits for transportation fleets aiming to cut costs and save fuel.

Key Takeaways

  • Perception, decision, and actuation systems reduce human-error incidents on highways.
  • Data and continuous updates make systems smarter with more miles driven.
  • Connected platforms offer real-time alerts and diagnostics to fleet managers.
  • Smart integration can lower operational costs and improve fuel use.
  • Iottive brings IoT, BLE, and cloud-mobile integration to secure fleet data flows.

Why Collision Avoidance Matters Now in U.S. Autonomous Freight

Industry pressures are colliding: fewer people, higher expenses, and tougher expectations for reliable delivery.

Drivers are in short supply—over 80,000 openings today and projections near 160,000 by 2030. That gap raises operating costs and strains dispatch and maintenance management.

Driver shortages, rising costs, and safety pressures

Human error causes about 94% of truck accidents, so reducing mistakes is the top priority. Automated systems help protect drivers and preserve delivery windows.

The present-day shift toward highway autonomy and hybrid fleets

Early deployments focus on predictable highway legs while human drivers handle urban traffic and complex road scenarios. Hybrid models cut downtime and can lower fuel use by up to 10% in continuous operation.

“Data-driven safety programs give fleet managers early warnings that reduce maintenance surprises and time off the road.”

Metric Typical Value Impact
Driver shortfall 80,000 now → 160,000 by 2030 Higher hiring and retention costs
Human-caused incidents 94% of accidents Prioritizes automated mitigation
Tech stack cost > $100,000 per vehicle Offset by uptime, fewer repairs, less fuel

Iottive supports automotive and logistics teams with connected solutions and fleet-ready integrations across IoT/AIoT to reduce incident risks and streamline operations. Contact www.iottive.com | sales@iottive.com.

Inside the Safety Stack: Sensors, Perception, and Control That Prevent Collisions

Layered sensing and rapid decision loops give vehicles the best chance to avoid unexpected road events.

LiDAR, radar, and high-resolution cameras create overlapping fields of view. LiDAR provides depth and range. Radar measures object speed and works in poor visibility. Cameras add visual detail for signs and markings.

sensors radar cameras on the front of a large autonomous semi-truck, mounted on the bumper and grille, with a high-tech array of lidar, cameras, and radar sensors to detect obstacles and hazards in the road ahead. The sensors are highlighted against a bright, sunny sky with fluffy white clouds, the truck is driving on a highway with other vehicles in the background. The sensor array is the focal point, conveying a sense of advanced safety and collision avoidance technology at the core of autonomous trucking.

Sensor fusion and computer vision for lane, sign, and obstacle detection

Sensor fusion merges real-time data into a single scene. Algorithms and models then track lane boundaries and classify obstacles. This reduces false positives and improves lane keeping when road markings fade.

Real-time decision models for speed, lane keeping, and evasive maneuvers

Artificial intelligence and machine learning power perception and decision layers. Models translate inputs into precise control outputs for speed and steering. Edge compute handles millisecond tasks while the cloud delivers continuous learning and updates.

Automated braking and stability control for emergency responses

Predictive models prime automated stability control and emergency stops before events escalate. Robust systems engineering adds redundancy—multiple sensors, fail-operational compute, and health checks—to maximize performance.

  • Redundant sensors ensure coverage across long range and short range detections.
  • Telemetry supports proactive maintenance by surfacing anomalies early.
  • Clear interfaces keep drivers informed about system status and features.

“Waymo’s latest generation pairs long- and mid-range LiDAR with high-resolution cameras and radar to extend perception in low visibility.”

Iottive connects vehicle sensors to edge gateways and cloud platforms to enable low-latency safety signals and over-the-air updates across fleets. www.iottive.com | sales@iottive.com.

AI truck safety: From early warning to proactive risk management

When vehicles stream context-rich data, managers can turn near-misses into teachable moments.

Continuous monitoring links driver state, vehicle dynamics, and road conditions so teams spot risks early. In-cab camera feeds and wearable BLE signals flag distraction, fatigue, and aggressive maneuvers. Telematics surface performance anomalies and hazardous route segments.

Monitoring driver states, vehicle dynamics, and road conditions

Real-time metrics let management act before small issues become big accidents. Machine learning mines patterns in near-misses and recommends targeted coaching and operational adjustments.

Video analytics to reduce risky behaviors and improve training

Algorithms analyze in-cab video to detect tailgating, lane distractions, and signs of fatigue. Alerts prompt timely breaks and coaching that improve driver behavior without adding workload.

  • Prioritization: Models link severity, context, and frequency so teams fix the highest-impact issues first.
  • Closed loop: Vehicles feed unified dashboards to measure training outcomes and track trends over time.
  • Privacy and governance: Configurable controls protect personal data while preserving evidence for investigations.

Iottive builds end-to-end IoT/AIoT stacks that bridge BLE wearables, mobile apps, and cloud analytics to deliver real-time coaching, incident flags, and training loops for fleets. www.iottive.com | sales@iottive.com.

Autonomous freight collision prevention in action

Real-world runs show how long highway stretches favor steady perception and control, while city blocks expose systems to fast-changing risks.

A vast, sun-drenched highway stretches out before an autonomous freight truck, its sleek silver body gliding effortlessly along the smooth asphalt. On the windshield, a vibrant alert system displays a real-time hazard detection overlay, warning the onboard AI of potential obstacles or threats. The truck's advanced sensors scan the environment, their whirring mechanisms attuned to the slightest changes in the road conditions. In the distance, other autonomous vehicles are visible, their synchronized movements a testament to the precision of this futuristic freight network. The scene conveys a sense of order, efficiency, and unwavering safety, a glimpse into the transformative power of AI-driven collision avoidance in the world of autonomous freight.

Highway piloting today versus complex urban driving

Highway routes offer wide lanes, predictable traffic, and steady speed. Cameras, radar, and other sensors keep a clear picture of the road and nearby vehicles.

Urban driving brings pedestrians, cyclists, and frequent signals. Those mixed interactions create the biggest challenges and keep many operations human-led for now.

Human override, fallback strategies, and safe-stop protocols

Human override gives immediate control when systems face unknown situations. Fallback procedures let the vehicle perform a controlled stop if confidence drops.

Real-time data on weather and road conditions helps dispatch reroute runs and reduce accidents. Mid-route maintenance alerts can trigger planned stops to avoid larger failures.

Scenario Typical Response Benefit
Open highway Steady lane keeping and adaptive speed Improved uptime and fuel use
Urban intersection Human-in-loop control or slow hold Reduced risk with complex users
Sensor fault / low confidence Safe-stop to roadside or shoulder Clear, verifiable recovery

“Iottive integrates roadside and in-vehicle IoT sensors with cloud backends to share condition data to vehicles and dispatch, improving route choices and safe-stop decisioning.”

www.iottive.com | sales@iottive.com

Smart AV braking and adaptive control under real-world conditions

Modern control systems tune stopping power to match real-world loads and road surfaces. Adaptive setups keep stopping distances consistent at speed and help preserve components across long runs.

A massive autonomous freight truck navigates a winding highway under bright daylight. The vehicle's advanced adaptive braking system is activated, with a holographic hazard alert displayed prominently on the windshield. The truck's powerful brakes engage smoothly, with the chassis responding with controlled, graceful deceleration as it approaches a potentially dangerous situation. The scene conveys a sense of cutting-edge technology, precision engineering, and unwavering safety, befitting the article's exploration of AI-driven collision avoidance in the future of autonomous trucking.

Performance in adverse weather, traffic patterns, and variable loads

Systems adjust braking and traction when road conditions change, factoring in weather, lane grade, and cargo shifts. This keeps the vehicle stable and reduces abrupt maneuvers in mixed traffic.

Coordinated engine braking, service brakes, and traction control cut skid risk in wet or low-friction conditions. Smoother inputs via predictive control also improve fuel efficiency and extend brake life.

Continuous sensor feedback tracks tire grip, load shifts, and gradients. That data drives low-latency commands and proactive maintenance alerts so teams can address brake fade or sensor degradation early.

  • Efficiency gains: smoother speed control and predictive tuning can reduce fuel use by up to 10%.
  • Operational benefits: over-the-air updates refine calibrations without downtime, keeping performance high across seasons and routes.

“Fielded systems on U.S. corridors show reliable operation despite changing weather and traffic patterns.”

Iottive’s edge-to-cloud integrations support low-latency signals, load-aware tuning, and OTA updates so fleets maintain peak performance and efficiency. www.iottive.com | sales@iottive.com.

Data, Cloud, and Fleet Management: The Backbone of Safe, Efficient Operations

A reliable data backbone makes split-second control and long-term planning possible for operators.

A high-tech autonomous freight truck cruises down a sun-drenched highway, its windshield displaying a dynamic data visualization. Streams of information flow across the display, relaying real-time sensor data and AI-driven hazard detection alerts. In the cabin, a suite of networked devices and interfaces harness the power of cloud-based fleet management, optimizing routing, fuel efficiency, and safety. The truck's sleek, aerodynamic frame and intelligent systems embody the future of sustainable, data-driven transportation.

Edge compute handles millisecond decisions so safety-critical systems react instantly. Cloud platforms then push updated models, maps, and routing intelligence to each vehicle.

Predictive maintenance uses sensor feeds and telemetry to forecast failures and schedule service. That reduces unplanned downtime, lowers costs, and keeps vehicles on the road.

Route, maintenance, and cybersecurity

Route optimization balances delivery windows, traffic, and road constraints to cut empty miles and improve fuel efficiency.

Standardized schemas and APIs connect dispatch, maintenance, and analytics so teams share one source of truth.

  • Real-time data for reroutes during incidents and weather.
  • Dashboards that unify KPIs across maintenance, fuel, and on-time performance.
  • Cybersecurity by design: encrypted OTA updates, strong identity, and continuous monitoring.

“Algorithms learn from fleet-scale patterns, improving planning and intervention timing as journeys feed back into the loop.”

Iottive delivers edge-to-cloud pipelines, BLE app development, cloud & mobile integration, and secure OTA mechanisms to operationalize safer, more efficient fleet management. www.iottive.com | sales@iottive.com.

Who’s Driving the Future: Leading Players, Deployment Paths, and the Road to Full Autonomy

Leading platforms show how varied strategies can converge on safer, more reliable long-range vehicle operation.

Prominent autonomous trucks navigating a sun-dappled highway, their sleek profiles cutting through the crisp air. In the foreground, a detailed display on the windshield highlights advanced hazard detection capabilities, guiding the vehicle with precision. The middle ground features a fleet of leading freight carriers, their distinctive branding and designs showcased against the backdrop of a vibrant, cloud-swept sky. The scene exudes a sense of technological prowess and the steady progress towards a future of fully autonomous freight transportation.

Waymo, Tesla, TuSimple, Embark, and Aurora: different strategies, common goals

Waymo Via runs Class 8 pilots across TX, AZ, NM, and CA with long- and mid-range LiDAR, high-res cameras, radar, and thermal sensing to extend detection distance.

Tesla offers lane keeping, adaptive cruise, and jackknife mitigation in its Semi. TuSimple showcased an 80-mile run without a human onboard. Embark focuses on Level 4 retrofits, and Aurora links vehicle systems with logistics networks.

Levels of automation today and integration with infrastructure tomorrow

Autonomy spans Levels 1–5 today, with most commercial pilots in the Level 2–4 band. Future roads will include connected hubs, automated docks, and route-aware infrastructure that let vehicles make more decisions without human input.

Company Primary focus Deployment note
Waymo Via Long-range perception Class 8 pilots in multiple states; LiDAR to 1 km, radar >500 m
Tesla Production features Semi with lane keeping and adaptive cruise; in-service fleets
TuSimple End-to-end autonomy Completed long-distance driverless trip; highway focus
Embark / Aurora Retrofits & logistics Level 4 kits and logistics integrations for yard and hub workflows

Companies balance speed, reliability, and public trust by validating features and sharing limits. Radar and long-range perception stacks reduce accidents by increasing detection range and confidence.

“Investment in interoperable technology builds momentum toward future autonomy without sacrificing accountability.”

Iottive partners with automotive innovators to connect sensors, mobile apps, and cloud platforms, accelerating pilots and deployments with secure IoT/AIoT foundations. www.iottive.com | sales@iottive.com.

Conclusion

The road ahead blends technology, human judgment, and clear rules, guiding fleets toward lower incidents and better performance.

Safety remains the north star: layered systems cut accidents and collision risk while supporting drivers in real traffic. Measurable efficiency gains follow—better routes, fewer delays, and less fuel use as learning models improve with fleet data.

Teams must pair rigorous maintenance, secure connectivity, and clear governance to handle weather and traffic variability. Success balances technology with people: training, change management, and transparent validation build trust across the industry.

Explore pilot programs and connected operations with Iottive. We help design, integrate, and scale end-to-end IoT/AIoT solutions that make vehicles safer and more efficient from day one. Visit www.iottive.com or write to sales@iottive.com.

FAQ

What is the role of advanced collision‑avoidance systems in the future of long‑haul trucking?

These systems combine sensors, perception software, and control logic to detect hazards early and apply corrective actions. They help fleets cut crashes, lower insurance costs, and boost on‑time deliveries. By processing camera, radar, and LiDAR inputs, vehicles can slow, steer, or warn a human operator in milliseconds to reduce risk.

Why does improved crash prevention matter for U.S. commercial carriers now?

Carriers face driver shortages, rising operating expenses, and stricter regulations. Better preventative tech reduces liability, helps retain drivers, and improves uptime. Highway automation also supports longer, safer runs and complements hybrid operations that still rely on human oversight in complex settings.

How do LiDAR, radar, and high‑resolution cameras work together?

Each sensor has strengths: radar senses speed and distance in poor weather, LiDAR maps precise 3D shapes, and cameras read signs and lane markings. Fusing these views creates a robust understanding of the scene so control systems can make accurate, timely maneuvers under varied conditions.

What is sensor fusion and why is it important for perception?

Sensor fusion merges data from multiple devices to reduce false alarms and fill gaps when one sensor is limited. Combined with computer vision, it improves lane detection, object classification, and the ability to track pedestrians, cyclists, and slow vehicles on mixed highways and urban streets.

How do real‑time decision models manage speed and lane keeping?

Models run on edge processors to evaluate trajectories, predict other road users’ paths, and pick safe actions. They balance route progress with risk, deciding when to slow, change lanes, or signal for human intervention. These millisecond responses are crucial for preventing cascading incidents.

What emergency responses do automated systems provide?

Systems include active deceleration, emergency steering assists, and stability control to keep rigs upright under sudden load shifts. They prioritize occupant protection and minimal roadway disruption while engaging alerts that notify nearby vehicles and fleet operators.

How can onboard monitoring reduce risky driver behavior?

Video analytics and telematics track fatigue signs, distracted steering, and harsh maneuvers. Fleets use this data for coaching, targeted training, and incentive programs. The aim is proactive risk management that improves human performance alongside automated aids.

What’s the difference between highway piloting and urban driving for heavy vehicles?

Highway piloting relies on predictable lanes and steady speeds, making sensor coverage and adaptive cruise easier to apply. Urban environments demand rapid detection of pedestrians, cyclists, and complex intersections, where fallback strategies and human takeover options become more frequent.

How do human override and safe‑stop protocols work?

Systems provide graduated alerts before handing control back to a human. If the operator cannot or will not respond, safe‑stop routines decelerate to a controlled stop in a low‑risk location while notifying fleet managers and emergency services as needed.

How do these systems perform in bad weather or with heavy payloads?

Performance varies: rain, snow, and glare can reduce camera and LiDAR effectiveness, while radar remains more resilient. Control algorithms account for load shifts and braking distances, adjusting following gaps and speed limits to maintain stability and stopping ability.

Why is edge computing critical for fast responses?

Edge compute keeps sensing and decision making on the vehicle, eliminating network latency for urgent events. The cloud still plays a key role for model updates, large‑scale analytics, and fleet coordination, but split processing ensures safety when milliseconds matter.

How do fleets use data to improve routing, maintenance, and fuel use?

Telematics and machine learning analyze driver habits, traffic patterns, and component wear to optimize routes, schedule preventive service, and reduce idling. These gains lower fuel consumption and extend vehicle life while improving predictability for shippers.

What cybersecurity measures protect connected vehicles and over‑the‑air updates?

Modern platforms use encryption, secure boot, and authenticated update channels to prevent tampering. Network segmentation and intrusion detection keep operational systems isolated from infotainment and external links, protecting control modules and fleet data.

Which companies are leading deployment and how do their approaches differ?

Waymo focuses on perception and fully driverless services, Tesla emphasizes camera‑forward systems and fleet learning, TuSimple and Embark prioritize freight corridors and operational scaling, while Aurora integrates sensors with OEM partnerships. Each blends hardware, software, and testing strategies to reach safe, scalable solutions.

What levels of automation are in use today and what comes next?

Most commercial operations use driver‑assist and conditional automation for highway segments, with humans supervising. The next steps expand driverless capability in controlled corridors, tighter integration with intelligent infrastructure, and broader urban validation toward higher automation levels.


Let’s Get Started

Choosing the Right Sports Performance Tracker for Your Team

Two seasons ago, a high school coach brought a single device to practice and watched a quiet shift in how the team prepared. One clear dashboard turned guesswork into coaching decisions, and players began to recover smarter.

Today the market is booming: forecasts point to a multi‑billion dollar wearable market and rapid growth in related technology. Modern devices give real‑time data on HRV, muscle fatigue, VO2 estimates, and recovery. Brands like Oura Ring, Apple Watch Ultra, and Catapult show how varied options can be.

Choosing the right sports performance tracker means matching features to roster needs, from simple heart metrics to advanced GPS and EMG textiles. Integration matters: BLE, cloud sync, and mobile apps must work together without siloing insights.

Iottive builds end‑to‑end IoT and BLE solutions that connect devices, firmware, and apps so teams get usable data fast. Avoid feature overload and ownership gaps. Start with clear goals, secure data flows, and a partner who can scale with your program.

sports performance tracker, AI sports analytics, wearable athlete training

Key Takeaways

  • Select devices that map to coachable goals, not gadget lists.
  • Look for real‑time metrics like HRV and movement workloads to inform recovery.
  • Prioritize BLE, cloud, and mobile integration to keep data flowing.
  • Avoid siloed platforms and choose partners who offer end‑to‑end solutions.
  • Balance budget and adoption: smaller programs can scale affordably.
  • Iottive can help architect custom solutions that grow with your team.

Why Sports Performance Tracking Matters Now

Investment and adoption curves are tipping now; teams that delay risk falling behind. Rapid growth in the market is not just hype. Wearable tech is projected to hit USD 186.14B by 2030 (13.6% CAGR), while sports technology is forecast at USD 86.22B by 2033 (16.62% CAGR).

A professional sports performance tracking dashboard displayed on a laptop screen, surrounded by a team of athletes wearing wearable devices. Bright overhead lighting casts a warm glow, highlighting the detailed analytics and real-time data visualizations. The coach intently examines the screen, making notes and adjusting parameters as the team members glance over their shoulders, engaged in the review process. The atmosphere is one of focused determination, with a sense of collaboration and a shared drive to optimize the team's training and performance.

Market momentum: Wearables to $186.14B by 2030, sports tech to $86.22B by 2033

That influx of capital means more devices, lower costs, and faster integration. In the NFL, roughly 250 trackers can capture 200+ data points per play. Those numbers show how sensors change coaching decisions in real time.

From clipboards to AI: Real-time, predictive, and personalized performance

With AI sports analytics and machine learning, teams move from basic analysis to predictive analytics. Modern devices add HRV, sleep architecture, stress markers, and fatigue models.

  • Faster insights: real-time data shortens feedback loops during practice.
  • Injury prevention: models flag risk and help coaches reduce exposure.
  • Fan engagement: broadcasts gain live heat maps and richer metrics.

Iottive helps teams respond to market growth by building scalable IoT and BLE-connected apps, plus integrated cloud/mobile platforms tailored for U.S. organizations. Contact: www.iottive.com | sales@iottive.com.

sports performance tracker

The right ecosystem blends rugged field sensors with daily wellness devices to create a single source of truth.

Defining the category: A practical system is more than a gadget. It combines field devices like Catapult Vector units, smart textiles (Hexoskin, Sensoria), and consumer rings or watches (Oura, Apple Watch Ultra, Samsung Galaxy Watch 6 Pro) into unified systems that collect, sync, and turn tracking into coach-ready metrics.

Team vs. individual needs: Start with roster-wide standards—GPS load and heart rate zones—then add role-specific metrics for positional demands. Balance rugged hardware for contact sessions with consumer tools that capture recovery and daily health.

High-quality photograph of a sports coach reviewing a team performance dashboard on a laptop computer, with athletes wearing wearable devices in the background. The scene is captured in a well-lit, modern office setting with sleek, minimalist furniture and equipment. The dashboard displays real-time data visualizations and analytics, reflecting the team's training metrics, progress, and overall performance. The coach's expression conveys a sense of focused analysis and decision-making, as they carefully evaluate the data to improve the team's training and strategy.

  • Prioritize platforms that unify data across strength, medical, and tactical staff.
  • Choose sensors that match your sport: EMG, pressure insoles, bio-patches, and GPS.
  • Ensure quick setup, reliable syncing, and clear dashboards for busy coaches.
Component Use Example
GPS & motion Workload and speed Catapult Vector S7/T7
Smart textiles EMG and posture Hexoskin, Sensoria
Consumer recovery Sleep and HRV Oura, Apple Watch Ultra

Partner note: Iottive builds custom IoT solutions—BLE app development, sensor integration, and cloud/mobile platforms—to unite devices, data, and team workflows. Contact: www.iottive.com | sales@iottive.com.

Key Metrics That Move the Needle

Good metrics separate guesswork from action by showing what to change next. Below are the core signal groups coaches and medical staff should monitor to guide sessions, reduce risk, and sharpen results.

A group of athletes wearing performance tracking wearables, their heart rate metrics displayed on a high-resolution laptop screen in the foreground. Warm, indirect lighting casts a soft glow over the scene, highlighting the concentrated expressions of the coach as they review the data. The background is slightly blurred, drawing the viewer's focus to the central display of heart rate, pace, and other key performance indicators that could make the difference between victory and defeat.

Cardio intelligence

Heart rate zones and trends drive conditioning plans. Devices like Polar and Whoop provide heart rate variability and rate variability trends that flag readiness and early overload.

Biomechanics and movement

Smart textiles and pressure footwear (Hexoskin, pressure insoles) reveal gait, jump forces, and asymmetries. Tracking movement patterns helps tune mechanics and lower unnecessary load.

Recovery and readiness

Sleep architecture and fatigue modeling turn nightly data into next-day guidance. Use these metrics to schedule hard sessions when recovery is high and scale back when readiness drops.

Environment and context

Heat, humidity, altitude, and air quality change risk profiles. Contextual sensors let coaches adjust intensity and hydration before problems occur.

  • Iottive can integrate cardio, biomechanical, and environmental sensing into custom dashboards via BLE, cloud, and mobile apps for coaches and medical teams. Contact: www.iottive.com | sales@iottive.com.
Metric Why it matters Example source
Heart rate zones Individualize conditioning Polar
Movement patterns Improve mechanics, reduce load Hexoskin / insoles
Sleep & readiness Schedule intensity Whoop

What’s Inside Today’s Wearables

Modern consumer and pro gear now packs a surprising mix of sensors and form factors into small, rugged housings.

Sensor suites have expanded beyond simple heart and GPS. Today’s systems pair GPS, EMG in smart textiles, pressure insoles, and bio-patches to capture movement, metabolic signals, and biomechanics.

Smart textiles from Hexoskin and Sensoria add EMG and posture cues. Rings like the Oura Ring 4 deliver HR, temperature, sleep, and stress insights in a low‑profile form factor.

Watches such as Apple Watch Ultra and Samsung Galaxy Watch 6 Pro add VO2, ECG, SpO2, and blood pressure trends. Biometric patches track lactate, electrolytes, hydration, and core temperature for on‑the‑spot metabolic feedback.

A high-tech display showcases an array of sleek, cutting-edge wearable sensors and devices. In the foreground, a variety of sports performance trackers and fitness monitors are meticulously rendered, their elegant designs and intelligent interfaces hinting at the wealth of data they collect. In the middle ground, a coach reviews the analytics on a laptop, intently studying the team's performance data. In the background, athletes stride across the scene, their bodies adorned with the latest wearable tech, capturing every movement and vital sign. Dramatic lighting casts dramatic shadows, underscoring the cutting-edge technology at work. The overall atmosphere conveys the future of sports performance analysis and coaching, where data-driven insights empower teams to achieve new levels of excellence.

Real-time coaching and next-gen form factors

Live audio prompts, vibration cues, and automated alerts keep users on pace and in target heart ranges. Smart contact lenses are emerging to overlay AR cues and monitor glucose without bulk.

Iottive develops BLE-connected apps and custom IoT products that integrate GPS, EMG textiles, pressure insoles, and bio-patches into unified mobile and cloud experiences. Contact: www.iottive.com | sales@iottive.com.

Sensor What it measures Common form
GPS & motion Position, speed, work rate Vests, small units
EMG & textiles Muscle activation, posture Smart shirts (Hexoskin, Sensoria)
Pressure insoles Ground contact, force maps Footwear inserts
Bio-patches & rings Metabolic markers, HR, temp Adhesive patches, Oura Ring 4

AI Sports Analytics: From Data to Decisions

Modern pipelines transform hundreds of live signals into decisions coaches can trust.

a detailed, realistic photo of a professional sports coach reviewing team performance analytics on a laptop computer, surrounded by athletes wearing wearable fitness trackers. the coach's expression is focused and serious as they analyze data visualizations on the laptop screen. the athletes are gathered around, looking at the dashboard and discussing the insights. the scene is set in a modern, well-equipped sports training facility, with sleek, high-tech equipment and lighting that highlights the coach and athletes. the image conveys the use of advanced AI-driven analytics to optimize team training and strategy.

Predictive analytics flag injury risks and suggest optimal training loads before problems appear. Supervised models use heart rate, rate variability, workload, and movement patterns to score short‑term risk.

Predictive analytics: Injury risk flags and optimal training load

Predictive analytics combine labeled injury histories with current session data. This helps staff reduce injuries and tailor daily plans.

Personalized training: Athlete-specific plans, role demands, recovery windows

Machine learning and clustering build individual baselines. Models adapt plans by role, recovery, and historical response.

Tactical intelligence: Heat maps, positional analysis, match-up optimization

Real-time data feeds tactical dashboards for lineup, spacing, and matchup choices. These insights support in‑game decisions and fan engagement displays.

Long-term development: Talent ID, performance ceilings, career modeling

Systems learn across seasons to forecast ceilings and career arcs. That long view helps scouts and coaches plan growth and recovery cycles.

Use case Methods Output
Injury prevention Supervised models, workload ratios Risk scores, alert windows
Personal plans Unsupervised clustering, adaptive models Role‑specific sessions, recovery timing
Tactical ops Positional heat maps, pattern detection Sub plans, matchup insights

Iottive builds AIoT pipelines that link devices to cloud models for predictive analytics, personalized programs, and real-time coaching dashboards. Contact: www.iottive.com | sales@iottive.com.

Sport-Specific Considerations for Wearable Athlete Training

Different disciplines demand different sensors and KPIs to turn raw signals into useful coaching cues. Match gear to context so data informs clear decisions without overwhelming staff.

Field sports: load and collision monitoring

Catapult GPS systems offer centimeter-level movement tracking and heat maps for tactical analysis. Use GPS vests to quantify workload across practices and matches.

Collision monitoring helps manage contact and supports injury prevention strategies by flagging high-impact exposures early.

Court sports: jumps, lateral work, substitutions

Basketball setups capture vertical jump force, landing impact, and lateral movement metrics. These signals guide fatigue-based substitutions and drill design.

Endurance disciplines: power and metabolic thresholds

Integrate power meters, pace, and heart rate trends to set metabolic thresholds. That approach balances intensity, efficiency, and recovery across long cycles.

Aquatics: waterproof biometrics and stroke timing

Waterproof sensors record stroke efficiency, breathing patterns, and turn timing without breaking rhythm. Low-drag devices keep data valid in swim conditions.

Precision sports: swing mechanics and impact physics

Tennis and golf motion-capture tools analyze swing mechanics and impact physics. Use those insights to correct mechanics and avoid overuse injuries.

  • Set sport-specific movement patterns and KPIs that align with tactical plans and conditioning blocks.
  • Choose devices that fit the environment—secure vests, low-drag swim modules, or lightweight racquet sensors.
  • Blend health and fitness metrics with on-field data so development stays sustainable.
Discipline Core sensors Key KPI
Field GPS vests, impact sensors Workload, collision counts
Court IMU jump sensors, lateral motion Jump force, landing load
Endurance Power meters, HR monitors FTP, pace efficiency
Aquatics Waterproof bio-patches Stroke rate, turn time
Precision Motion capture, impact sensors Swing speed, impact angle

Iottive can tailor sensor fusion and dashboards to sport-specific KPIs—from GPS collision monitoring in football to jump analysis in basketball and stroke metrics in swimming. Contact: www.iottive.com | sales@iottive.com.

Integration, Platforms, and Data Strategy

When platforms speak the same language, staff spend less time reconciling numbers and more time acting.

Start by centralizing systems so every coach sees one consistent set of metrics. A unified platform prevents silos and standardizes how teams measure load, intensity, and readiness.

Unified data platforms: Breaking down silos and standardizing metrics

Central systems ingest streams from many devices and normalize definitions. That makes analysis comparable across drills, departments, and seasons.

Video + wearables: Biomechanical validation and complete profiles

Combine film and sensor streams to confirm what metrics mean in context. Video adds biomechanical clarity and helps convert raw signals into actionable insights for coaches.

Edge, 5G, and latency: Faster loops for real-time coaching

Edge processing and 5G cut lag so alerts and cues happen on the sideline. Faster loops improve on-field adjustments and help staff act on fresh monitoring data.

Focus Benefit Example
Centralization Consistent metrics for all staff Unified dashboard
Video fusion Biomechanical validation Sync sensor + film
Edge & 5G Low latency alerts On-field feedback

Iottive specializes in BLE app development and cloud & mobile integration to unify wearables, smart devices, and custom IoT products into secure, scalable platforms. Contact: www.iottive.com | sales@iottive.com.

Privacy, Ethics, and Policy for Teams in the United States

Managing personal biometric records requires policies as precise as the sensors that collect them. Teams must balance daily monitoring with clear consent, robust security, and fair use so data becomes a tool for care rather than a source of risk.

Biometric data governance: Define ownership and consent up front. Make it clear what is collected, how long it is retained, and who can access it. Build role-based access so coaches, medical staff, and admins see only what they need.

Encryption, consent, and secure systems

Encryption at rest and in transit protects sensitive health and injury records. Require vendors to support modern standards and document incident response and deletion workflows when people leave a program.

Fairness and explainability

Algorithms can bias outcomes if training sets are narrow. Use explainability tools like LIME and SHAP so recommendations produce clear, testable insights. Vendors should disclose model behavior so coaches can trust and challenge results.

Operational best practices:

  • Document consent and ownership policies for athletes and staff.
  • Apply strong encryption and strict access controls across systems.
  • Audit datasets and models for bias; include diverse reviewers.
  • Limit fan engagement content to avoid exposing health or injury details.
  • Train staff on ethical data use and maintain clear offboarding processes.

Equity matters in the current market. Pursue partnerships, grants, and shared programs to reduce gaps in access to modern technologies. Iottive designs systems with encryption, consent workflows, and role-based access to help U.S. teams operationalize data ownership and compliance. Contact: www.iottive.com | sales@iottive.com.

How Iottive Helps Teams Build the Right System

Iottive turns scattered device signals into a single, usable platform for coaches and staff. We engineer end-to-end solutions that link hardware, firmware, BLE apps, and cloud services so daily work is simpler and faster.

IoT & AIoT end-to-end: BLE app development, cloud/mobile integration

Our BLE app development ensures reliable pairing, low-latency syncing, and robust data capture across complex sessions. Cloud and mobile integration deliver secure pipelines, role-based dashboards, and alerting for timely decisions.

Custom trackers and smart textiles: Sensor fusion for team-specific KPIs

We design custom devices and smart textiles that fuse sensors into clear metrics—jump force, collision counts, or stroke timing—so coaches see actionable summaries, not raw streams.

From prototype to platform: Scalable IoT products with real-time analytics

From prototype to production, we build scalable systems that evolve with your needs. Edge and 5G support low-latency monitoring, while our analytics layer surfaces next steps for staff, not just charts.

  • Data governance: role-based access and encryption built in.
  • Practical deployments: aligned to budget and timeline.

Ready to build? Visit www.iottive.com or email sales@iottive.com to start.

Conclusion

Practical systems emphasize simple, repeatable metrics that staff can act on every day.

Wearables and AI sports analytics deliver real‑time feedback and predictive fatigue models that can improve training efficiency by up to 25%.

Prioritize recovery as much as hard sessions to limit overtraining and protect long‑term health. Use quick feedback loops so coaches adjust loads while players are still in session.

Track patterns in readiness, workload, and technique to guide smarter progressions and fewer setbacks. Keep data practices transparent so athletes trust the system and adoption stays high.

Iottive partners with teams to turn strategy into working IoT/AIoT solutions—BLE apps, cloud and mobile, and custom devices—so you can track what matters and act faster. Contact: www.iottive.com | sales@iottive.com.

FAQ

How do I choose the right tracker for my team’s needs?

Start by defining your goals — injury prevention, load management, or tactical insight. Match those goals to sensors and metrics: heart rate and HRV for recovery, GPS and accelerometers for movement, and force sensors for impact. Consider roster size, budget, and integration with your existing video or athlete-management systems. Prioritize devices that offer secure cloud export and open APIs so coaches and data staff can build custom reports.

Why is tracking athlete health and output more urgent now?

Two forces are driving adoption: expanding market options and better analytics. Wearable and sports-technology investment has surged, unlocking cheaper sensors and faster connectivity. At the same time, predictive models can flag overuse and optimize load, reducing time lost to injury and improving readiness across a season.

What types of devices and platforms make up this category?

The ecosystem includes body-worn sensors (vests, straps, rings), smart textiles with embedded EMG or pressure sensors, insoles, and patch biometrics. Those devices feed platforms that normalize data, apply models, and deliver dashboards or automated alerts. Look for vendors who offer sensor fusion and documented data schemas.

How do I balance team-wide standards with position-specific needs?

Set core metrics everyone tracks (load, HRV, sleep, readiness) to compare across the roster. Layer role-specific measures on top — sprint distance and collisions for backs, jump forces for forwards, power meters for cyclists. That hybrid approach preserves comparability while capturing the nuances of each role.

Which cardio and heart metrics matter most for monitoring readiness?

Track resting heart rate trends, heart rate variability (HRV), training zones, and cardiac drift during sessions. These indicators reveal fatigue, autonomic balance, and adaptation. Use baselines and rolling averages rather than single days to spot meaningful changes.

What movement and biomechanical data should I prioritize?

Key measures include peak and average acceleration, change-of-direction loads, jump height and landing forces, and asymmetry metrics. Combine inertial data with force sensors or video to validate mechanics and identify compensations that raise injury risk.

How can wearables help with recovery and readiness tracking?

Wearables capture sleep duration and architecture, nocturnal HRV, and daily load to inform readiness scores. When paired with wellness surveys and context (travel, match congestion), these metrics support actionable recovery strategies like individualized rest, modified sessions, or targeted interventions.

What environmental factors should teams monitor?

Heat, humidity, altitude, and air quality affect exertion and hydration needs. Integrate local environmental sensors or public APIs so load prescriptions and cooling strategies adapt to conditions and reduce heat-related risk.

What sensors are common in modern devices?

Typical suites include GPS, IMUs (accelerometer/gyroscope), optical heart-rate sensors, EMG-enabled textiles, pressure insoles, and biochemical patches for sweat analysis. Manufacturers are also experimenting with new form factors like rings and smart clothing for less intrusive long-term wear.

Can real-time coaching features improve on-field decisions?

Yes. Low-latency feedback such as pacing cues, automated alerts for unsafe loads, or live audio prompts lets staff intervene during practice and matches. Achieving this requires reliable connectivity (BLE, 5G, edge compute) and workflow integration so coaches trust the alerts.

How do predictive models reduce injury risk?

Predictive analytics combine historical loads, recovery markers, biomechanical patterns, and competition schedules to generate risk flags. When models are transparent and regularly validated, teams can adjust training load or prescribe targeted rehab to reduce avoidable injuries.

How personalized can training plans get with modern tools?

Very granular. Systems can tailor volume, intensity, and recovery windows to each individual using trends in HRV, session-RPE, and performance outputs. This personalization improves adaptation while minimizing overtraining for each roster member.

How do teams use data for tactical and positional insights?

Combining positional tracking with event data creates heat maps, spacing models, and matchup analytics. Coaches use those insights to plan substitutions, optimize formations, and exploit opponent tendencies based on objective movement and workload metrics.

What sport-specific differences should I expect when selecting tools?

Field sports need robust GPS and collision monitoring. Court sports demand high-frequency jump and lateral metrics. Endurance disciplines focus on metabolic power and efficiency, while aquatics require waterproof biometrics and stroke analysis. Choose systems validated for your sport’s movements and environments.

How important is platform integration and data strategy?

Critical. A unified data platform prevents silos, standardizes metrics, and enables longitudinal analysis. Integrate wearables with video systems and athlete-management software so staff get a single source of truth for monitoring health, load, and tactical planning.

What are the privacy and ethical basics U.S. teams must follow?

Treat biometric data as sensitive. Implement encryption at rest and in transit, clear consent processes, role-based access controls, and data-retention policies. Also ensure model explainability to address bias and support fair decisions about selection or medical care.

How can a technology partner help build a custom system?

A capable partner can design BLE mobile apps, integrate cloud analytics, develop custom sensors or smart textiles, and scale prototypes into production. Work with experienced IoT and edge-compute vendors to align hardware, software, and coaching workflows for long-term impact.


Let’s Get Started

RPM Solutions for Chronic Illness Management

Two years ago, Maria nearly missed a warning sign. She felt tired, but a home reading sent to her clinic flagged a rising trend. Her care team adjusted therapy the same day, and a hospital visit was avoided.

chronic illness RPM devices

This story shows how remote patient monitoring connects care beyond clinic walls. Continuous patient monitoring gives providers clear trends so they can act early and improve outcomes.

Iottive and other technology partners make this practical. Their Bluetooth, mobile app, and cloud work tie smart tools to secure platforms. With sensor innovation and stronger reimbursement in the United States, adoption is accelerating.

Later sections will review top products, which tools fit specific conditions, and how to integrate secure data flows so monitoring becomes meaningful care.

Key Takeaways

  • Remote patient monitoring brings continuous visibility for patients and providers.
  • Simple, connected tools at home make care programs more effective.
  • Secure, interoperable data flows turn monitoring into timely action.
  • Technology partners with BLE, mobile, and cloud expertise enable scale.
  • Market growth and reimbursement shifts are making remote care a standard.

Why Remote Patient Monitoring Matters Now for Chronic Conditions

A convergence of policy, market growth, and staffing gaps is pushing connected monitoring into mainstream care.

The U.S. outlook is strong. The market for remote patient monitoring is forecast to jump from $50.39B in 2024 to $203.68B by 2032 at a 19.1% CAGR, with North America holding roughly 48% of share. CMS and state Medicaid moves—plus telehealth flexibility after the pandemic—signal payer support that helps programs scale.

Staff shortages and readmission pressure drive real change. Hospitals and plans use continuous patient monitoring of metrics like blood pressure and weight to spot decline earlier and avoid extra visits or a return to the hospital.

Operational wins come from standardized data flows and smart alerting. Systems that route tasks to the right care teams member cut manual work and protect clinician time.

Prompt A modern, well-lit hospital room with a patient sitting upright in bed, intently focused on a tablet displaying a remote patient monitoring (RPM) app. Beside the bed, a sleek medical device monitors the patient's vital signs, the readings displayed on a digital screen. The room is bathed in a calming, neutral color palette, with soft lighting illuminating the scene. In the background, subtle medical equipment and monitors suggest the setting, while maintaining a sense of tranquility. The composition emphasizes the patient's engagement with the RPM technology, conveying the importance of continuous health monitoring for managing chronic conditions.

“Reimbursement momentum and executive sponsorship are turning pilots into enterprise programs that improve outcomes while easing hospital congestion.”

How organizations turn market signals into programs

  • Match device options—from BYOD to clinical-grade—to risk and budget.
  • Define clinical pathways and escalation playbooks to avoid alert fatigue.
  • Use standardized capture and automated thresholds for earlier intervention.
Driver Impact Action for Providers
Market & Payer Support Long-term funding pathways Design scalable programs that meet documentation rules
Staffing Constraints Need for task routing and prioritized alerts Adopt systems that offload manual follow-up
Readmission Pressure Focus on early detection of decline Monitor trends like blood pressure and weight; tie to escalation

Iottive’s IoT & AIoT expertise and BLE app development help link sensors, apps, and cloud so care teams get reliable data flows during tight staffing. Linking market signals with internal goals lets organizations build programs that improve outcomes without overburdening staff.

What Remote Patient Monitoring Is and How It Helps

Connected home monitoring turns single readings into a continuous health story. Remote patient monitoring uses connected tools to capture vital signs and symptoms at home and send them to clinician dashboards. This steady stream of data helps care teams spot trends fast.

A modern home office with a healthcare professional monitoring a patient's vitals remotely. In the foreground, a person sits at a desk, intently studying a tablet displaying a patient's vital signs and tracking data. Warm, natural lighting fills the room, casting a calming, professional atmosphere. The middle ground features medical devices like a blood pressure cuff and heart rate monitor, seamlessly integrated into the home setup. In the background, large windows offer a glimpse of the outdoors, symbolic of the connected, remote nature of the patient care. The overall scene conveys the efficiency and personalized care enabled by remote patient monitoring technologies.

For patients

Patients gain confidence and convenience. Fewer in-person visits and earlier detection reduce emergency trips. Seeing one’s own trends improves patient engagement and treatment adherence.

For providers

Live data supports medication titration, therapy changes, and quicker triage when thresholds are crossed. Structured updates let clinicians tailor care plans on evidence, not guesswork.

For organizations

Programs cut readmissions and operating costs through centralized alerting and standardized workflows. Scaling monitoring across populations becomes practical with clear protocols.

“Real-time, structured data turns episodic snapshots into actionable narratives for better outcomes.”

  • Definition: Connected tools capture vital signs and send secure feeds to dashboards.
  • Patient wins: Peace of mind, earlier detection, fewer ER visits.
  • Provider wins: Faster triage and tailored management.
  • Org wins: Lower costs, scalable workflows, stronger engagement.
Benefit What It Means How to Measure
Fewer ER visits Early intervention from trend alerts ER visit rate per 1,000 patients
Better adherence Patients follow treatment with visible trends Medication refill and engagement metrics
Operational efficiency Standard alerts route tasks to the right team Staff time per escalated alert

Iottive integrates BLE devices and mobile apps to deliver seamless patient experiences and unified dashboards for clinicians. A well-designed program combines easy-to-use tools, clear instructions, and proactive outreach to keep momentum and prove impact over time.

chronic illness RPM devices: the core categories to know

A clear lineup of monitoring gear helps programs match measurements to specific care goals.

Blood pressure monitors track systolic and diastolic readings at home. They are central for hypertension management and for spotting trends that may signal heart failure decompensation.

Glucometers and CGMs for diabetes care

Fingerstick meters and continuous glucose monitors turn blood glucose into actionable trends. These tools help patients and clinicians adjust diet, insulin, and medications with timely data.

Pulse oximeters

Pulse ox measures SpO2 and heart rate. It is vital for COPD, asthma, and post-COVID recovery to detect drops that need prompt support.

Smart scales

Daily weights reveal fluid retention or loss. For heart and renal patients, small weight shifts can trigger medication or clinic outreach.

Wearables

Activity trackers log steps, sleep, and heart rate variability. That context helps teams understand lifestyle, recovery, and adherence between visits.

ECG/EKG monitors

Portable rhythm monitors capture arrhythmias and AFib episodes. They support post-MI follow-up and stroke-risk reduction programs.

Smart thermometers

Early fever detection aids oncology, post-op, and elderly care by flagging infection before it escalates.

Multi-parameter kits

Bundles that combine BP, pulse ox, scale, and temp simplify logistics and feed unified systems for hospital-at-home care. Studies show such kits cut admissions and mortality in post-acute programs.

A well-lit, high-resolution close-up view of a patient's hand holding a modern, sleek RPM device with a touchscreen display. The device's intuitive interface shows real-time blood pressure and glucose level readings, with a clean, minimalist design. The patient's other hand rests on a smartphone, showcasing a mobile RPM app with an intuitive dashboard tracking vital signs and health data. The scene conveys a sense of ease and control, reflecting the empowering nature of chronic illness RPM technologies.

“Scotland’s home BP program reduced roughly 400,000 GP visits and saved more than £15M.”

Choosing tech that integrates matters. Iottive’s BLE and IoT expertise helps pair clinical-grade and consumer tools to ensure reliable connectivity and unified data streams so monitoring becomes actionable, not siloed.

Best-Fit Devices by Chronic Condition

Picking the right toolset matters most when programs aim for timely intervention and simpler workflows.

Iottive can integrate CGMs, connected blood pressure cuffs, spirometers, and smart scales into a single app. That unified view pairs live measurements with education and adherence nudges. Providers see trends faster and patients get clear guidance.

A serene, well-lit medical office setting. In the foreground, a patient sits comfortably, intently engaged with a sleek, modern mobile device displaying a remote patient monitoring app for diabetes management. The middle ground features a state-of-the-art blood pressure monitoring device, its digital display indicating the patient's vital signs. The background depicts soothing, minimalist decor, with muted tones and clean lines conveying a sense of professionalism and care. Soft, diffused lighting creates a calming atmosphere, while the camera angle suggests an intimate, empathetic perspective. The overall scene exudes a feeling of personalized, high-quality remote healthcare tailored to the patient's specific chronic condition.

Diabetes

Continuous glucose monitors provide real-time blood glucose tracking and alerts. When combined with contextual education loops and messaging, they help reduce dangerous highs and lows.

Hypertension

Connected BP cuffs that capture morning and evening readings support trend-based alerts. Threshold rules and analytics guide medication changes and follow-up.

COPD and respiratory disease

Pulse oximetry plus spirometry tracks oxygen levels and lung function. Pair these with adherence checks for inhalers to spot early exacerbations.

Heart failure

Daily weight, blood pressure, and symptom surveys reveal fluid shifts and rising risk. Correlating weight with BP and symptoms enables rapid outreach before hospitalization.

“Map condition to the simplest stack that answers a clinical question — then add coaching and escalation.”

  • Map stacks: CGMs + education for diabetes; BP cuffs + analytics for hypertension; SpO₂ + spirometry for COPD; scales + BP for heart failure.
  • Close the loop: Combine device data with behavior coaching and medication reminders to boost adherence.
  • Escalation tiers: Align threshold alerts to telehealth check-ins or urgent outreach and document readings for longitudinal care.

Real-World Impact: Outcomes Seen With RPM

Practical implementations of remote monitoring are shrinking the time between symptom onset and clinical action. That faster window drives clear benefits for patients, providers, and organizations.

A patient carefully examining their smartphone, the screen displaying a real-time diabetes monitoring app. In the middle ground, a nurse assists the patient with a blood pressure cuff, their faces warmly lit from a window. The background is a cozy, modern home office space, with minimal clutter and a sense of calm professionalism. The lighting is soft, natural, and directional, creating a sense of intimacy and focus on the patient-caregiver interaction. The overall mood is one of empowerment, personalized care, and the seamless integration of technology into everyday health management.

Fewer ER visits, shorter stays, and lower readmissions

Continuous monitoring closes the gap from first warning sign to clinician response. That translates into fewer ER visits and shorter hospital stays.

Studies show multi-parameter kits in post-acute programs cut admissions by 87% and mortality by 77% in high-risk cohorts. Those results free up beds and reduce family stress.

Early detection enables faster medication titration

When providers get timely home data, they adjust dosages sooner. Faster titration reduces adverse events and speeds recovery.

Iottive’s unified dashboards and alerting let care teams act quickly, turning raw readings into clear, documented steps.

Population health: outbreak tracking and risk stratification

Aggregated temperature and respiratory measures help public health teams spot outbreaks earlier.

Risk stratification focuses limited resources on patients who need attention now while reassuring those with stable readings.

“Faster intervention windows improve experience and outcomes for patients and families.”

  • Continuous monitoring shortens response time and cuts avoidable visits.
  • Real-world signals enable faster medication changes and tailored follow-up.
  • Population-level data aids outbreak detection and targeted outreach.
  • Operational wins—fewer escalations and better use of time—support clinical gains.

Track outcomes and process metrics to tune thresholds and workflows over time. Clear goals and transparent communication keep patients engaged and help programs sustain funding and partnerships.

Integration Essentials: From Device to EHR and Care Team Dashboards

A reliable pipeline from home measurement to the clinician view is the backbone of any successful monitoring program.

Cloud and mobile data pipelines must ingest readings securely, normalize them, and render near real-time insights in clinician dashboards. Architect with edge buffering, retry logic, and encrypted transport so brief outages don’t create gaps.

Cloud and mobile data pipelines for real-time visibility

Use lightweight mobile apps for BLE pairing and secure upload. Send compressed, timestamped payloads to cloud queues that feed analytics and alert engines.

Ensure the pipeline supports offline caching and device health checks so clinicians see accurate, timely views.

BYOD vs. clinical-grade devices: when each approach fits

BYOD (smartwatches, phones) boosts adoption and lowers friction for low-risk monitoring. Clinical-grade tools suit regulated metrics where accuracy and FDA rules matter.

Match choice to the clinical question: convenience for engagement; regulated tools for decisions that affect therapy or billing.

Interoperability standards and unified data views

Push normalized measurements into electronic health records using FHIR and secure APIs. Include metadata—timestamps, device IDs, firmware version, and patient context—to aid traceability.

Build role-based dashboards so clinicians, case managers, and admins see focused views with fewer false alarms.

“Command centers centralize monitoring, triage alerts, and route tasks to the right provider quickly.”

  • Onboarding flows should auto-provision devices, test connectivity, and confirm patient pairing.
  • Alert normalization and suppression reduce fatigue and highlight high-risk signals.
  • Iterative integration testing with live cohorts validates reliability before scale-up.
Layer Key Feature Why it Matters
Edge / Mobile BLE pairing, offline cache Stable uploads from home networks
Cloud Queueing, analytics, retries Near real-time insights and resilience
Integration FHIR APIs, EHR sync Continuity in electronic health records
Ops Command center, role views Rapid triage and workload routing

Iottive delivers BLE app development, smart device integration, and cloud-to-EHR work that creates unified dashboards and reliable data pipelines. That foundation helps providers focus on care, not connectivity.

Security, Privacy, and Compliance for Remote Care Programs

Security must be as seamless as the monitoring itself so care flows without friction or risk. For remote patient monitoring to work, systems must protect patient data while staying usable for providers and patients.

Protecting PHI: HIPAA, access control, and safe harbor

Encryption in transit and at rest, least-privilege access, and immutable audit trails are baseline requirements. Implement role-based permissions, consent tracking, and clear patient notices to build trust.

FDA and clinical-grade wearables

As wearables move toward therapeutic use, follow labeling rules and post-market surveillance. Track firmware, maintain a living risk register, and review regulatory guidance frequently.

“Align security with usability so safeguards do not block timely care.”

  • Adopt patching cadence, SBOM tracking, and incident response plans.
  • Require vendor due diligence for cloud platforms and third-party SDKs that touch PHI or telemetry.
  • Run penetration tests, mobile app hardening, BLE pairing protections, and secure boot at the edge.
  • Keep logs, reports, and FHIR-based exchanges to satisfy audits and preserve interoperable data flows.

Iottive builds HIPAA-aligned solutions with access control, auditability, and regulatory awareness across IoT/AIoT stacks to help organizations scale secure, standards-based care programs.

Reimbursement and Program Design in the U.S.

Recent billing shifts mean more providers can build sustainable remote patient monitoring workflows.

CMS growth and coding basics

CMS reimbursements climbed from $5.5M in 2019 to over $101M in 2021. That surge makes remote patient monitoring a viable revenue stream for many providers and hospitals.

Billing note: patients generally must record measurements at least 16 days per month to meet common billing thresholds. Accurate device attribution and identity matching are essential for claims.

Medicaid variability and state rules

By March 2023, 34 state Medicaid programs covered monitoring, often with limits on conditions, provider type, or eligible systems.

Check state rules early when designing eligibility and enrollment workflows.

Program design to meet documentation and time thresholds

Documentation should show clinical indication, signed consent, device education, and logged interactions that reflect billed time.

  • Automate time tracking and intervention logs so clinicians avoid manual entry.
  • Produce audit-ready reports tying data to outreach and orders.
  • Set realistic panel sizes and manage alert loads for sustainable scale.

“Design payer-ready workflows from day one to reduce rework and protect revenue.”

Challenge What to track Recommended action
Billing thresholds Days with measurements; time spent Automated logs + patient reminders
Audit readiness Consent, device attribution, encounter notes Structured templates and exportable reports
State variability Covered conditions & provider types Configurable eligibility rules per state

Iottive’s platforms support documentation, time tracking, and reporting so healthcare organizations can meet CMS and payer rules while focusing on care and outcomes.

How Care Teams Use RPM Day to Day

Care teams turn routine home readings into fast, actionable steps. Daily uploads help clinicians spot trends and act before a small change becomes a crisis.

Post-discharge cardiac rehab with multi-device kits

Example: Patients use a BP cuff, ECG patch, and smart scale each morning. Readings stream to a central dashboard that flags fluid shifts or rhythm changes.

When a weight rise or arrhythmia appears, the system alerts the right nurse or cardiologist for telehealth or in-person follow-up. This approach reduces readmissions and speeds recovery.

Diabetes management in rural settings

Connected glucose data from home meters lets providers intervene quickly. Outreach triggers when trends destabilize, pairing coaching with medication adjustments.

For rural patients, mobile networks and BLE pairing bridge access gaps so care occurs without extra travel.

Mayo-style command centers and clinician workflows

Centralized hubs route incoming ECG and vitals so the right clinician sees the right signal at the right time. Role-based alerts, batch reviews of stable patients, and threshold automations cut wasted time.

Standardized escalation rules define when to call, schedule a televisit, or send a clinician in person.

Use Case Key Inputs Primary Action Typical Outcome
Cardiac rehab BP, ECG, weight Flag fluid/rhythm; clinician outreach Fewer readmissions; better heart rate control
Diabetes (rural) Connected glucose, logs Trend outreach; education loops Faster intervention; improved self-management
Command center Multi-stream vitals, alerts Route to specialist; triage Quicker response; lower avoidable visits

“Central dashboards and standardized playbooks let teams act fast without chasing raw data.”

Iottive supports multi-device kits, BLE connectivity, and unified dashboards that streamline alerting and escalation for care teams.

Partnering with Iottive to Build Secure, Scalable RPM Solutions

Iottive partners with providers to turn connected hardware into trusted care pathways.

IoT & AIoT expertise: Iottive delivers BLE app development and smart device integration that ensure dependable pairing and steady telemetry. Firmware, pairing logic, and mobile UX are engineered to reduce dropouts and keep patient data flowing.

Cloud & mobile integration: Built patterns normalize and queue incoming data so clinician dashboards render near real-time trends. Integrations push structured feeds into electronic health records and role‑based views so care teams see what matters fast.

Custom product engineering

Iottive designs clinical-grade products from firmware through cloud analytics. That includes secure boot, over‑the‑air updates, and validation to meet healthcare requirements.

End-to-end platform features

  • Device onboarding, identity matching, and provisioning.
  • Data pipelines, alerting, and audit trails for compliance.
  • Role-based access and clinician workflows tied to escalation rules.

“Our focus is aligning technical choices with clinical goals and payer rules so organizations get reliable outcomes, fast.”

Cross‑industry experience brings lessons from consumer electronics and industrial IoT into health implementations. That improves reliability, supply logistics, and usability for patients and providers.

Capability What Iottive Delivers Benefit for Organizations
BLE & App Robust pairing, low-energy telemetry Fewer connection failures; steady patient uploads
Cloud & EHR FHIR-ready APIs, normalized data Continuity in electronic health records; easier claims support
Security Encryption, audit trails, access controls Lower compliance risk; protected PHI
Product Engineering Firmware, UX, validation Clinical-grade outcomes; faster time to value

Testing and rollout: Iottive supports iterative pilots, validation testing, and phased deployments to minimize disruption and accelerate scale. Teams get training, support, and configurable workflows tailored to patient populations and service lines.

Invite collaboration: Work with Iottive to select the right device mix, build secure systems, and deliver monitoring that helps patients and care teams, while meeting payer and regulatory expectations.

How to Choose the Right RPM Devices and Platform

Start by defining the clinical question your monitoring program must answer and map that to measurable metrics. Clear goals make technology choices simpler and keep care focused on outcomes.

Define clinical goals, target metrics, and alert thresholds

Match metrics to condition and care plans. For example, map blood pressure, SpO₂, weight, or glucose to specific thresholds that trigger outreach.

Set escalation tiers so alerts align with staffing and expected response time.

Evaluate interoperability, usability, and patient training needs

Pick systems that integrate with electronic health records and provider workflows to avoid fragmented data. Prioritize simple setup, clear instructions, and upfront training so patients capture accurate readings consistently.

Assess data security, auditability, and regulatory pathways

Require end-to-end encryption, access controls, and immutable logs for auditability. Confirm regulatory status for clinical-grade hardware and track firmware and metadata for traceability of remote patient streams.

Plan for scalability, logistics, and support across care teams

Decide between BYOD for convenience or clinical-grade gear for accuracy, or use a hybrid approach. Plan kitting, shipping, replacements, and a support workflow so monitoring devices stay in service.

  • Validate with pilots, refine thresholds, and measure outcomes.
  • Align alerting with staffing to avoid fatigue and meet SLAs.
  • Partner with experienced builders—like Iottive—to integrate with EHRs, secure data, and scale logistics.
Decision Key Question Action
Metric selection What answers the clinical question? Map to target thresholds and schedules
Integration Will this feed electronic health records? Test FHIR APIs and workflow handoffs
Support How will patients get help? Design training, helpdesk, and swap logistics

“Start with the clinical question, not the gadget, and build policies that keep care timely and measurable.”

Conclusion

Modern patient monitoring links everyday measurements to faster, smarter clinical choices. When remote patient monitoring and a clear workflow join, routine readings become timely care signals that help providers and patients avoid needless visits.

Map the right patient monitoring devices to each condition, build interoperable systems, and lock in security and privacy. Iottive supports BLE pairing, cloud & mobile integration, and custom IoT platforms so data flows reliably into clinician views.

Measure impact—readmissions, visits avoided, engagement—and train teams to keep adherence high. Design documentation, time thresholds, and smart alerting to protect reimbursement and scale operations.

With multidisciplinary teams and command‑center workflows, organizations can expand precision, personalization, and access in chronic disease care. Translate these insights into a practical roadmap and move care forward with confidence.

FAQ

What is remote patient monitoring and how does it help people with long-term conditions?

Remote patient monitoring uses connected health tools — such as blood pressure cuffs, glucometers, pulse oximeters, and wearable heart-rate trackers — to collect vital signs and transmit them to care teams. This gives patients more confidence, reduces in-person visits, and supports better self-management. Providers gain near real-time data for faster triage and personalized care plans, while health systems see improved outcomes and lower readmission risk.

Which types of monitoring tools are most commonly used for managing hypertension and heart disease?

Connected blood pressure monitors, smart scales, and ECG/EKG patches are primary tools for hypertension and heart failure management. These tools track trends in blood pressure, weight (for fluid retention), and rhythm abnormalities to guide medication titration and timely interventions by clinicians and care teams.

How does continuous glucose monitoring compare to traditional glucometers for diabetes care?

Continuous glucose monitoring (CGM) provides ongoing glucose trends and alerts for highs and lows, enabling proactive dosing and lifestyle adjustments. Traditional glucometers give point-in-time readings. CGMs paired with education loops and clinician review often yield better glycemic control and higher patient engagement, especially in remote or rural settings.

Are pulse oximeters and spirometers useful for respiratory conditions and post-COVID care?

Yes. Pulse oximeters provide SpO₂ and heart rate readings for COPD, asthma, and post-COVID monitoring. Spirometry and adherence-tracking inhaler sensors help assess lung function and medication use. Together, they support early detection of deterioration and reduce emergency visits.

How do wearable devices contribute to remote monitoring programs?

Wearables track activity, sleep, and heart rate variability, offering continuous physiological context that complements spot measurements. They help clinicians identify trends, adjust care plans, and motivate patients through engagement features. For clinical-grade needs, validated wearables or multi-parameter kits are preferred.

What does integration with electronic health records (EHR) involve?

Integration requires secure cloud and mobile data pipelines that feed device readings into EHRs and care dashboards. Interoperability standards and APIs enable unified views so clinicians can see device trends alongside clinical notes, supporting faster decisions and coordinated care across teams and organizations.

How do providers balance BYOD (bring your own device) versus clinical-grade equipment?

BYOD can increase access and lower costs for routine monitoring, but clinical-grade devices offer validated accuracy and regulatory oversight for higher-risk patients. Choose BYOD for engagement and low-acuity cases; choose regulated devices for medication changes, hospital-at-home, or billing requirements.

What security and privacy safeguards are required for remote monitoring data?

Protecting patient health information means HIPAA-compliant platforms, strong access controls, encryption in transit and at rest, and audit logs. For regulated devices, manufacturers and providers must also follow FDA guidance and maintain clear data governance across cloud services and mobile apps.

How does reimbursement work for remote monitoring in the United States?

Medicare and many private payers reimburse monitoring under specific CPT codes that reflect time and engagement thresholds. Medicaid coverage varies by state. Successful programs design workflows that document clinical time, device data review, and patient contacts to meet billing requirements.

What outcomes can health systems expect after deploying remote monitoring programs?

Programs commonly report fewer ER visits, shorter hospital stays, and reduced readmissions. Early detection from continuous data enables quicker medication titration and targeted interventions, improving population health metrics and lowering total cost of care.

How do care teams use monitoring data day to day?

Clinicians and nurses review dashboards for alerts and trends, prioritize outreach for at-risk patients, and adjust care plans. Examples include post-discharge cardiac rehab with multi-parameter kits, diabetes management using connected glucose data, and centralized command centers that route escalations to clinicians.

What should organizations evaluate when choosing a monitoring platform?

Define clinical goals, target metrics, and alert thresholds first. Then assess interoperability with EHRs, usability for patients, patient engagement tools, logistics for device distribution, data security, and scalability. Consider vendor experience with cloud integration, BLE app development, and regulatory pathways.

Can remote monitoring be scaled across large patient populations?

Yes. Scalable programs combine automated data ingestion, configurable alert rules, centralized dashboards, and standardized protocols for escalation. Cloud platforms and unified views help population health teams stratify risk and deploy resources efficiently across providers and care settings.

What role do IoT and AI technologies play in modern remote care?

IoT connects medical hardware to apps and cloud services; AI and analytics surface patterns, predict deterioration, and reduce alert fatigue. These technologies power smart device integration, improve triage accuracy, and support personalized interventions across healthcare organizations.


Let’s Get Started

How LiDAR is Revolutionizing Autonomous Navigation – Smart Automation

One evening, a fleet operator watched a vehicle adjust its path while sipping coffee. The update came through a mobile app that tied edge sensors, cloud analytics, and an over-the-air firmware patch together. Within seconds the team could make informed decisions and keep passengers safe.

This guide shows how LiDAR-driven 3D sensing and modern algorithms let autonomous vehicles process vast amounts of data from cameras, RADAR, and ultrasonics. These inputs help the vehicle perceive the road, predict movement, and plan safe driving around changing traffic and conditions.

Iottive builds end-to-end IoT platforms that bridge BLE-enabled edge devices, mobile apps, and cloud dashboards. Operators can monitor map accuracy, push OTA updates, and fine-tune systems from any connected device. That blend of edge compute and cloud models is why transportation is moving toward smarter, scalable automation.

LiDAR mapping for AVs, AI route optimization, self-driving navigation

Key Takeaways

  • LiDAR-powered 3D sensing helps vehicles process large streams of data for safer decisions.
  • HD maps, GPS/INS, and SLAM enable precise positioning for complex road layouts.
  • Complementary sensors—RADAR, cameras, ultrasonics—boost resilience in varied conditions.
  • Iottive’s IoT and mobile solutions connect vehicles to cloud analytics and OTA updates.
  • Advances in edge compute and learning algorithms make fleet-wide improvements possible.

Why LiDAR-led autonomy matters now: user intent, scope, and what this Ultimate Guide covers

Product leaders, engineers, and operations teams need clear answers about how autonomous vehicles gather and use data to improve overall safety and efficiency.

This guide explains the full scope: perception, localization, planning, and resilient systems that handle changing road conditions and traffic patterns.

A bustling urban landscape filled with sleek, autonomous vehicles navigating the streets with precision. In the foreground, a state-of-the-art self-driving car equipped with advanced LiDAR sensors, its carefully-calibrated array of laser beams sweeping the environment to map the surroundings in striking 3D detail. The middle ground features a variety of other autonomous models, their smooth, aerodynamic designs seamlessly blending with the cityscape of towering skyscrapers and bustling pedestrian traffic. Overhead, the warm glow of the midday sun casts a natural, ambient light, illuminating the scene with a sense of technological progress and efficient mobility. This harmonious symphony of man and machine showcases the transformative power of LiDAR-driven autonomy, paving the way for a future of smart, connected transportation.

We show practical steps to evaluate systems, reduce risk, and map investments to measurable safety gains.

  • How sensor families work together to supply detailed information for lane-level decisions.
  • How machine learning and algorithms consume vast amounts of multimodal data to make informed decisions quickly.
  • Priorities for prototyping, testing, and governance so teams can act with confidence.

“Iottive helps teams validate assumptions fast with BLE telemetry, rapid sensor prototypes, and cloud dashboards.”

Focus Why it matters Key deliverable
Perception Detailed, lane-level scene understanding in low visibility Reliable sensor fusion and object lists
Decision systems Real-time planning under variable traffic Predictive models and control policies
Operations Rapid validation with fleet data BLE telemetry, cloud dashboards, OTA updates

The perception backbone: LiDAR, radar, cameras, ultrasonics, and sensor fusion working together

Modern perception systems fuse diverse sensor streams to build a clear, real-time picture of the surroundings. This layered approach turns raw signals into the actionable data a vehicle needs to detect objects, estimate speed, and plan safe maneuvers.

LiDAR for high-resolution 3D environmental mapping and obstacle detection

LiDAR emits laser pulses to produce dense point clouds that reconstruct nearby surroundings. These clouds enable accurate object detection and lane-relative positioning, which helps early recognition of obstacles in complex environments.

RADAR for long-range speed and distance in adverse weather

RADAR tracks distance and speed reliably through fog, rain, and snow. Its long-range capability complements higher-resolution sensors by giving consistent motion estimates for distant objects and vehicles.

A bustling city street bathed in warm, natural daylight. In the foreground, a self-driving car equipped with an array of state-of-the-art sensors - a high-resolution LiDAR system sweeping the scene, complemented by radar modules and a suite of cameras capturing a comprehensive 360-degree view. The LiDAR's precise 3D mapping blends seamlessly with the radar's long-range object detection and the cameras' detailed color and texture information, creating a multifaceted perception backbone for autonomous navigation. The car's sleek, aerodynamic design emphasizes its cutting-edge technology, ready to safely navigate the urban environment.

Camera vision, ultrasonics, and fusion

Cameras read lanes, traffic signs, and semantic scene cues. They offer rich color and texture that help classify pedestrians and objects, though lighting can affect performance.

Ultrasonic sensors fill short-range gaps during parking and low-speed maneuvers. Together, sensor fusion aligns detections across modalities so algorithms and learning models keep consistent tracks and improve safety on busy roads.

“Iottive streams synchronized sensor data so teams can visualize point clouds, camera frames, and RADAR tracks in real time.”

  • Trade-offs: LiDAR resolution vs. cost; RADAR reliability vs. lower spatial detail; cameras’ richness vs. lighting sensitivity.
  • Iottive’s BLE and IoT gateways help teams profile noise, validate calibration, and iterate faster on fusion pipelines.

Localization and maps: HD maps, GPS, and SLAM powering precise vehicle positioning

A reliable position estimate blends HD map layers, GNSS telemetry with inertial backups, and SLAM that adapts to changing streets.

HD maps supply centimeter-level road geometry, lane markings, and traffic assets. That detailed information helps planners make lane-precise decisions and supports safer maneuvers in dense urban canyons.

GPS plus INS gives redundancy when satellite signals bounce or drop in tunnels. Combining GNSS and inertial systems stabilizes pose estimates so vehicles keep trustworthy position data while driving.

A city street scene with a self-driving car navigating the roads, its LiDAR sensors scanning the surroundings in vivid detail. The car is centered in the frame, its sleek, aerodynamic design conveying a sense of advanced technology. In the foreground, high-definition maps and GPS data are overlaid, providing precise localization and navigation information. In the middle ground, buildings, trees, and other urban elements create a realistic backdrop, bathed in natural daylight. The camera angle is a wide, panoramic view, capturing the seamless integration of the vehicle's autonomous systems with the real-world environment. The overall atmosphere is one of cutting-edge innovation, efficiency, and the future of transportation.

SLAM in dynamic environments

SLAM builds maps on the fly when prebuilt coverage is missing. It helps with immediate perception and detection of new obstacles.

But SLAM can drift and needs compute resources. Algorithms constrain error growth by fusing sensor data and anchoring to map primitives.

  • Cameras, radar, and LiDAR align to map layers to refine vehicle pose and improve perception.
  • Accurate object association between sensors and map features avoids misdetections that could harm safety margins.
  • Iottive’s telemetry visualizes alignment, audits drift, and enables OTA map updates so fleets stay synchronized.

“Iottive streams GPS/INS and SLAM outputs to help teams compare localization streams and detect anomalies.”

From perception to decisions: AI, deep learning, and behavioral prediction inside AV brains

Deep learning and forecasting let a vehicle predict nearby movement and choose safer, smoother maneuvers.

Deep learning for object detection, tracking, and scene understanding

Convolutional networks translate images and point data into labeled objects and semantic context. CNNs handle object detection and recognition, while trackers keep persistent IDs as objects move.

Scene understanding adds lanes, crosswalks, and occlusion cues so planners have richer information when making decisions.

Behavioral prediction to anticipate pedestrians, cyclists, and vehicle trajectories

Prediction models fuse past motion, scene context, and intent signals to forecast paths. This includes trajectory forecasting, intent detection, and real-time risk assessment.

Accurate forecasts let the control system select speed and gap acceptance that balance comfort, speed, and safety in traffic.

Reinforcement learning and model predictive control for path planning

Reinforcement learning uncovers high-level strategies by trial and error in simulation. Model predictive control refines short-horizon plans to meet safety envelopes while smoothing motion.

Runtime constraints demand low-latency inference on edge hardware so decisions stay timely when conditions change quickly.

Iottive’s AIoT solutions help teams curate labeled datasets, instrument edge sensors and BLE devices, and stream synchronized data to cloud dashboards. That workflow speeds model iteration for detection, tracking, and prediction.

“Curated data and robust labeling reduce bias and make decisions reflect real-world conditions across varied weather and scenes.”

Component Function Benefit
Deep learning Detects and classifies objects, builds scene context Improved perception accuracy and richer inputs for planning
Behavioral prediction Forecasts trajectories and intent Better anticipation of pedestrians and vehicles, lower risk
Reinforcement learning + MPC Strategy discovery and short-horizon control Smoother, safer path planning under constraints
AIoT data pipelines Collects synchronized sensor and BLE data, labels datasets Faster model iteration and validated performance on real roads

A hyper-detailed, photorealistic self-driving car navigates a bustling city street, its LiDAR sensors sweeping the environment with precision. The vehicle's complex neural networks analyze the intricate dance of pedestrians, cyclists, and other cars, predicting their behaviors in real-time to ensure safe, efficient navigation. The scene is bathed in warm, natural daylight, casting subtle shadows and highlights that enhance the technical details of the autonomous system. The composition is a wide, panoramic shot that captures the full scope of the vehicle's sensory awareness and decision-making capabilities, perfectly illustrating the "From perception to decisions" section of the article.

LiDAR mapping for AVs, AI route optimization, self-driving navigation: putting it all together

Predictive models turn streams of sensor information into timely decisions that avoid hazards and keep schedules.

Trajectory forecasting and intent detection feed planners with short-horizon predictions about pedestrians, cyclists, and nearby vehicles. Those forecasts shape candidate paths that respect traffic rules and passenger comfort.

Control systems then apply model predictive control to turn forecasts into smooth, feasible steering and speed commands. This keeps maneuvers both safe and efficient in dense traffic.

A bustling city street scene at midday, with a sleek, autonomous vehicle maneuvering through traffic, its LiDAR sensors scanning the environment in real-time. The car's advanced navigation system maps out the optimal route, anticipating the movements of pedestrians and other vehicles. The sunlight casts long shadows, highlighting the intricate details of the car's sensors and the surrounding architecture. In the background, high-rise buildings and bustling sidewalks create a dynamic, technologically-advanced urban landscape, showcasing the integration of LiDAR-powered self-driving technology into the modern cityscape.

Trajectory forecasting, intent detection, and risk assessment in real time

Fast classifiers and regressors use camera semantics, radar speed cues, and lidar point structure to guess intent. Risk scores rise when uncertainty spikes or objects cross predicted paths.

When scores cross thresholds, planners choose conservative actions and the control loop tightens to reduce collision risk.

Adaptive speed, lane selection, and proactive braking for overall safety

Adaptive loops coordinate speed, lane choice, and braking so the vehicle keeps flow while avoiding obstacles. MPC balances comfort, legal limits, and emergency handling.

Runtime guardrails provide fallback maneuvers when models disagree or sensors degrade. These guardrails enforce simple safe behaviors so edge cases do not cascade.

“Iottive connects telematics, BLE edge streams, and OTA model updates so operators can validate changes rapidly in the field.”

  • Forecasts inform planners that pick safe, efficient maneuvers through dense traffic.
  • Sensors—lidar, radar, cameras, ultrasonics—combine to detect objects early and keep trajectories smooth as road conditions change.
  • Deep learning models and systems logic convert sensor information into decisions that respect comfort, regulations, and right-of-way.
  • Iottive closes the loop with telematics, logging, and OTA updates to operationalize improvements across vehicles.

Resilience in the real world: weather conditions, edge cases, and redundancy strategies

Real-world roads force autonomous systems to cope with sudden weather shifts and rare events without losing safety.

Multimodal sensing keeps a vehicle aware when conditions change. In rain, fog, or snow, radar still measures speed and range while cameras and lidar may lose detail.

Operating through rain, fog, and snow with complementary sensors

Designs use radar as the weather-hardened backbone, ultrasonics for near-field checks, and cameras when visibility is good. Fusion preserves perception of objects across mixed environments.

Control logic then selects conservative maneuvers if confidence drops. Reducing speed and widening gaps keeps pedestrians and traffic safer during uncertain moments.

Handling rare events: emergency vehicles, road obstructions, and detours

Edge cases like emergency responders or unexpected obstructions need fast detection, classification, and a clear response policy. Systems flag unusual data streams and switch to fail-safe behaviors.

Iottive supplies redundant BLE and IoT pathways plus cloud alerts so operators see sensor health and intervene or schedule fixes before risks grow.

“Redundancy and test-driven detour scenarios are essential to keep vehicles operational and safe in messy, real roads.”

Connected mobility: V2X, 5G, and smart city integration that boost efficiency

When vehicles and infrastructure exchange live signals, traffic becomes a cooperative system rather than isolated agents. Low-latency 5G and V2X links deliver timely data that helps vehicles coordinate merges, crossings, and platoons. This reduces stop-and-go behavior and raises overall efficiency on the road.

Cooperative driving, platooning, and traffic signal coordination

V2X and 5G let vehicles share position, speed, and signal-phase information so they can form tight, safe platoons. Platooning improves fuel use and throughput while lowering congestion.

Signal phase and timing (SPaT) messages give vehicles a forecast of upcoming light phases. Navigation timing that uses SPaT reduces stops, saves energy, and keeps schedules on track.

Fleet planning and AI-driven efficiency

Fleet operators use machine learning and advanced algorithms to balance demand, schedule preventive maintenance, and make quick decisions during peak traffic. Models analyze streaming data to reroute vehicles around jams and shift capacity where riders need it most.

Edge and cloud streams synchronize dispatch, vehicle health, and handoffs so control remains reliable. These systems lower downtime and improve on-time performance for ride-hailing and delivery services.

“Iottive builds V2X-ready IoT stacks and mobile apps that tie vehicles to traffic signals, curbside systems, and dispatch tools.”

  • 5G and V2X share traffic and signal information to coordinate merges, crossings, and platoons.
  • Machine learning helps fleets balance demand and make timely decisions in peak traffic.
  • SPaT timing cuts stops and boosts energy efficiency and schedule adherence.
  • Edge-to-cloud data flows sync dispatch, maintenance, and driverless handoffs for safe control.
  • Iottive integrates sensors and system telemetry with city infrastructure to operationalize connected mobility plans.

Beyond passenger cars: transit, logistics, and agriculture use cases

Autonomous systems are proving their value in transit networks, urban delivery, and precision farming operations. These sectors rely on synchronized data, robust sensors, and practical planning to deliver real benefits in real environments.

Autonomous shuttles and buses improve transportation access and lower emissions. Transit agencies deploy on‑demand shuttles that keep schedules punctual and assist riders with limited mobility. Coordinated with traffic systems, these vehicles cut wait times and shrink local carbon footprints.

Autonomous shuttles and buses for accessible, low-emission public transport

Shuttles use sensor fusion, predictive models, and fleet data to stay reliable in mixed traffic. Operators tune performance with OTA updates and BLE telemetry so services adapt without long downtime.

Autonomous delivery vehicles for reliable, 24/7 last-mile logistics

Delivery vehicles run around the clock using planning and continuous data to avoid congestion and maintain SLAs. Predictive maintenance reduces surprises and keeps fleets moving in dense urban settings.

Autonomous farming equipment for precision agriculture and sustainability

Field vehicles pair GPS, sensors, and models to guide planting and harvesting. Precision workflows raise yields, save water, and lower input waste across varied environments.

Iottive helps transit agencies, logistics operators, and ag‑tech firms deploy BLE beacons, smart gateways, and cloud/mobile integrations. These products enable fleet monitoring, OTA updates, and real‑time dashboards that keep multi‑vehicle operations coordinated.

Use case Primary benefit Operational need
Transit shuttles Improved accessibility and lower emissions Traffic coordination, passenger apps, OTA updates
Delivery vehicles 24/7 service with higher SLA adherence Predictive maintenance, congestion data, fleet orchestration
Farming equipment Precision planting and resource efficiency Field connectivity, sensor telemetry, model updates
  • Practical challenges include rural connectivity, uneven road conditions, and unexpected obstacles that planning systems must handle gracefully.
  • Fleet monitoring and cloud integrations ensure operators react fast to sensor faults or changing traffic and weather conditions.

Challenges to solve on the road to scale: safety, regulation, and ethics

Scaling autonomous systems demands more than smart models and fast processors; it needs verified evidence that vehicles behave safely under real conditions.

Testing and validation must blend long-running simulation with staged public road trials. Simulators speed iteration, while on-road data supplies the detailed information regulators expect.

Testing, validation, and fail-safes for reliability

Teams should run exhaustive scenario tests, then confirm results with monitored road trials. Redundancy in sensors and control paths preserves operation when components fail.

Fail-safes must hand control to conservative behaviors when confidence falls. Auditable logs and synchronized data streams help engineers reproduce and fix faults fast.

Regulatory frameworks, liability, and data privacy in the United States

U.S. rules require clarity on who is liable after an incident and strict protections for personal data. Transparent logs and device identity make it easier to make informed assessments.

Iottive supports safety cases with auditable data pipelines and privacy-by-design architectures to help teams meet regulatory expectations.

Transparent AI and ethical decision-making in complex scenarios

Ethical frameworks must guide algorithms when trade-offs arise, especially around pedestrians and vulnerable road users. Explainable models build public trust.

“Openness in testing and clear logs are essential to show how decisions are made and why safe outcomes follow.”

Challenge Key action Outcome
Validation Simulate, then test on public roads with monitored trials Verified performance and detailed information for safety cases
Redundancy Dual sensors, backup control, health monitoring Continued control under faults and higher reliability
Regulation & privacy Auditable logs, device identity, privacy-by-design Clear liability paths and compliant data practices
Ethics & transparency Explainable models and public demonstrations Increased trust and accountable decisions

Summary: Rigorous testing, layered fail-safes, clear logs, and ethical transparency let teams scale with confidence. Secure device management and strong data practices turn compliance into an ongoing capability.

Conclusion

When data streams link to learning pipelines, each trip improves future vehicle performance.

Autonomous vehicles rely on a layered stack: perception, localization, planning, and control. That stack helps vehicles handle road and traffic challenges with growing confidence.

High-quality data and continuous learning keep models and algorithms improving as fleets scale. The payoff is clear: better safety, smoother navigation, and improved operational efficiency across transportation networks.

Plan pilots that tie sensors, cameras, and telemetry to cloud dashboards so you can turn insights into measurable gains. Partner with Iottive for BLE devices, mobile apps, and cloud platforms that accelerate deployment and de-risk innovation.

FAQ

What role does LiDAR play in modern autonomous vehicle perception?

LiDAR provides high-resolution 3D scans of the environment, enabling vehicles to detect shapes, distances, and obstacles in real time. When combined with radar, cameras, and ultrasonic sensors, it improves object detection and helps control systems make safer driving decisions.

How do different sensors work together to improve safety?

Sensor fusion merges data from 3D scanners, radar, cameras, and ultrasonics to cover each technology’s blind spots. Cameras handle signs and lane markings, radar measures speed at long range, ultrasonics manage close obstacles, and fusion algorithms create a consistent view for perception and planning.

Can autonomous systems localize accurately in urban environments?

Yes. High-definition maps, GPS aided by inertial measurement units, and SLAM methods work together to give centimeter-level vehicle positioning. Redundant localization reduces drift and helps vehicles navigate complex streets reliably.

How do AI and machine learning enable decision-making in autonomous vehicles?

Deep learning models detect and classify objects, while behavioral prediction forecasts trajectories of pedestrians, cyclists, and other vehicles. Reinforcement learning and model predictive control convert those predictions into safe trajectories, speed adjustments, and lane choices.

What systems manage route planning and adaptive driving behavior?

Planning stacks use trajectory forecasting, intent detection, and risk assessment to choose safe paths. They adjust speed, lane selection, and braking proactively to avoid collisions and improve traffic flow while balancing comfort and efficiency.

How do autonomous vehicles handle adverse weather and visibility issues?

Vehicles rely on complementary sensors—radar for penetrating rain and fog, cameras for visual cues when conditions allow, and 3D scanning for geometry. Redundancy and sensor calibration, plus conservative behavior under low confidence, keep operations resilient.

What happens during rare or unexpected events on the road?

Systems detect anomalies like emergency vehicles, sudden obstructions, or detours and switch to safe fallback strategies. These include reduced speed, increased following distance, or requesting remote operator support when needed.

How does connected infrastructure improve autonomous driving performance?

V2X communications and low-latency networks such as 5G let vehicles share traffic signals, hazard alerts, and cooperative maneuvers. This boosts route efficiency, enables platooning, and helps fleet operators optimize dispatch and routing.

Are autonomous technologies useful beyond private cars?

Absolutely. Autonomous shuttles, delivery vehicles, and farm equipment use the same perception and planning building blocks to provide accessible transit, reliable last-mile logistics, and precision agriculture that reduces waste and boosts productivity.

What are the main safety and regulatory challenges for wide deployment?

Scaling up requires rigorous testing, validation frameworks, and fail-safe mechanisms. Clear U.S. regulations on liability, data privacy, and certification are essential, along with transparent decision-making in edge cases to earn public trust.

How is privacy protected when vehicles collect vast amounts of sensor data?

Developers anonymize or aggregate sensor streams, apply strict data governance, and follow regional privacy laws. Limiting retention, encrypting transmissions, and providing transparency about data use help protect users.

How do companies validate autonomous systems before public use?

Validation combines simulation, closed-track testing, and staged on-road trials. Companies use scenario libraries, edge-case catalogs, and performance metrics to measure perception accuracy, planning robustness, and safe fallback behavior.


Let’s Get Started

Starting November 1, 2025, all Android apps will need to support 16 KB memory pages.

Google Play enforces a new binary requirement for submissions that target Android 15+. This change affects both new releases and updates and aims at measurable gains in app performance across devices.


Teams that use only Kotlin and Java often face little work. Projects with native C/C++ code or third‑party SDKs usually need rebuilds or config tweaks. Expected benefits include faster launches, better battery life, quicker camera starts, and faster system boot times.

Act early: evaluate toolchains, run APK Analyzer and Lint checks, and test on emulator targets. Noncompliant binaries risk blocked releases and reduced visibility on the Play Console.

Need help?

Contact Us

www.iottive.com or email sales@iottive.com for audits, code updates, and packaging support. Many migrations are straightforward thanks to modern tool defaults.

Key Takeaways

  • Enforcement begins November 1, 2025 for Google Play submissions targeting Android 15+.
  • Switching page size yields faster launches, better battery, and quicker camera and boot times.
  • Pure Kotlin/Java projects often require no changes; native builds likely need updates.
  • Use Android Studio tools and Play Console checks to validate compliance.
  • Contact www.iottive.com or sales@iottive.com for upgrade help and compliance packaging.

Why this change matters now: performance gains, compliance, and the Android 15 shift

Shifting to a larger page layout unlocks real performance wins across boot, launch, and camera workflows.

From 4 KB to 16 KB: what page size means for your app

Android 15 is page-size-agnostic: devices can run with either 4 KB or larger pages while correctly built binaries run across both.

A larger page reduces bookkeeping in the MMU, lowers TLB misses, and trims CPU time spent on mapping management. That improves overall system responsiveness and shortens common critical paths.

Documented gains: faster launches, better battery, quicker camera, speedier boot

Measured outcomes from Google tests show device performance boosts of roughly 5–10% on larger page configs. Teams can cite up to 30% faster app launches in some cases, ~3% average faster launches, ~4.56% reduced power draw, quicker camera starts (~4.5–6.6%), and about 0.8s faster system boot.

Compliance is opportunity: enabling larger page support unlocks these gains on modern devices while remaining compatible with 4 KB installations. If you need help quantifying wins or preparing a rollout, contact www.iottive.com or email sales@iottive.com.

Android apps will need to support 16 KB memory pages: what the Google Play deadline requires

From the November cutoff, any new release or update targeting android 15+ must meet Play Console binary checks before publication.

Scope of enforcement:

  • Effective November 1, 2025, Google Play rejects uploads for new submissions and updates that do not meet the page sizes requirement when targeting android 15+.
  • Use the Play Console app bundle explorer to spot non-compliant artifacts early and avoid blocked updates.
  • Projects with native code and prebuilt libraries face the highest risk and often require rebuilds or updated binaries.
  • Third-party sdks that include native libraries must confirm timelines for compatibility; React Native, Flutter, and Unity already provide aligned builds, while Unreal Engine is still finishing support.

Action now: verify dependencies, add a compliance gate to release criteria after October 2025, and engage vendors if their binaries are not aligned.

Need help? Contact us for triage and vendor coordination at www.iottive.com or sales@iottive.com.

Plan your upgrade: a how‑to roadmap for developers and teams

Create a cross-functional plan that ties testing targets and release gates to firm deadlines. Set a migration owner and form a squad with engineering, QA, release, and vendor leads. This keeps responsibility clear and timelines realistic.

Key scheduling actions

  1. Set milestones that finish weeks before the November 1, 2025 cutoff.
  2. Upgrade toolchains early: AGP 8.5.1+ and NDK r28+ are recommended.
  3. Audit code for page-size assumptions and list required changes.

Create a dual-environment test matrix

Build tests that cover both 4 KB and 16 KB environments across smoke, regression, and performance suites. Include on-device checks and emulator targets so you catch platform differences early.

Vendor coordination and release gates

Inventory native libraries and rank their risk. Ask vendors for 16 KB-ready builds and log fallbacks if timelines slip.

Milestone Owner Deliverable Validation
Dependency audit Engineering lead List of native libs and risk ratings APK Analyzer report
Toolchain upgrade Build engineer AGP 8.5.1+ & NDK r28+ builds CI build and alignment check
Compliance gate Release manager Blocked deploys for flagged libs Play Console preflight checks

Reserve time for baseline performance runs so you can show launch and battery improvements after migration. Since compatible binaries run on mixed devices, staged rollouts reduce risk.

Need expert help? Contact iottive for planning and execution at www.iottive.com or sales@iottive.com. We can accelerate testing, environment setup, and vendor coordination.

Assess your app today: find native code, page size assumptions, and risks

Start by scanning your release artifact for native binaries that might break under larger page configs. Open the bundle in APK Analyzer and note each .so file at the module level. This gives a quick view of compatibility markers and risky libraries.

Use APK Analyzer and Lint

APK Analyzer shows embedded modules and marks 16 KB readiness. Run Android Studio Lint to catch non‑aligned libraries early. Catalog third‑party binaries and map vendor compatibility notes.

Spot hardcoded assumptions

Search repositories for PAGE_SIZE, 4096, and alignment directives. Replace fixed values with runtime queries like getpagesize() or sysconf. Audit mmap, ashmem, and file mappings for implicit boundaries that affect page tables and reclaim paths.

Check Action Outcome
Embedded .so list APK Analyzer export Catalog of libraries and ABIs
Hardcoded sizes Repo grep and replace Dynamic runtime queries
Alignment & logs Lint + linker map review Early failure detection

Next steps: build a risk register, prototype a small harness for native allocation paths, and plan targeted testing runs. If internal expertise is limited, contact us for a rapid assessment and remediation plan at www.iottive.com or sales@iottive.com.

Upgrade your toolchain: build and package with 16 KB alignment

A consistent build pipeline is the fastest path to compliant, aligned binaries. Start by making packaging defaults part of your release checklist so every artifact meets Play Console checks before an upload.

Adopt Android Studio + AGP 8.5.1+

Android Studio with AGP 8.5.1+ applies 16 KB alignment for uncompressed shared libraries by default. That reduces manual steps and keeps packaging predictable across builds.

Move to NDK r28+ or set linker flags

NDK r28+ compiles with 16 KB alignment across ABIs. If older toolchains persist, add linker flags such as -Wl,-z,max-page-size=16384 and, where required, -Wl,-z,common-page-size=16384. Check build logs for the applied size and page markers.

Rebuild native modules and verify artifacts

Rebuild every native code module, JNI bridge, and prebuilt library. Audit third‑party sdks and ask vendors for updated builds if their libraries lag.

  • Confirm alignment with APK Analyzer and command-line checks.
  • Document evidence per release for compliance audits.
  • Integrate reproducible steps in CI so alignment is enforced for all branches.

Need help? Contact us for turnkey toolchain upgrades, build script updates, and binary verification across your modules and SDK dependencies at www.iottive.com or sales@iottive.com.

Fix your code for page‑size agnosticism

Make your low-level code agnostic: query the system for the actual page value at startup and use that everywhere. Replace fixed literals and document the changes so future edits do not reintroduce assumptions.

Replace hardcoded 4096 with runtime queries

Remove constants like 4096 and PAGE_SIZE in native modules. Use getpagesize() or sysconf(_SC_PAGESIZE) and cache the result.

Audit mmap, allocators, and IPC

Review mmap and file mapping offsets so they use the runtime value for alignment. Check custom allocators and arenas for alignment logic that assumes a fixed boundary.

  • Validate ashmem, shared memory, guard pages, and signal handler alignment.
  • Add unit and integration tests that run with both 4096 and 16384 values.
  • Consider static analysis rules that flag hardcoded page literals in native code.

Need help? Engage iottive for a focused audit and patch plan to reach page‑size agnosticism quickly and safely. Contact www.iottive.com or sales@iottive.com.

Test in a 16 KB environment: emulator, real devices, and remote labs

Validate early and often. Set up a controlled test environment that covers emulators, local devices, and remote labs before any release. This catches alignment errors and performance regressions early.

Use Android Emulator targets (arm64 and x86_64)

In android studio, create emulator images configured for the larger page alignment on both arm64 and x86_64. Run smoke and performance checks there first.

On‑device validation

On supported Pixel 8/8 Pro and newer devices (Android 15 QPR1+), toggle the developer option between 4 KB and 16 KB and confirm with adb shell getconf PAGE_SIZE.

Leverage remote labs

Use Samsung Remote Test Lab to broaden coverage across OEM builds and regional variants. Remote devices help replicate real‑world conditions you may not have locally.

  • Build a test plan: list expected outcomes for login, camera, media, storage, and cold/warm launches.
  • Capture evidence: logs, performance metrics, and alignment errors for each run.
  • Automate: environment setup scripts and data seeding so runs are repeatable and fast.
  • Include negative tests: check buffers and alignment‑sensitive operations for hardcoded assumptions.
  • If needed, engage iottive to provision environments, author plans, and triage issues at www.iottive.com or sales@iottive.com.

Verify dependencies: third‑party SDKs, engines, and libraries

Start by mapping every third‑party library and engine inside your build so nothing slips through a release gate.

Inventory analytics, A/V, ML, networking, and game engines. Note versions, ABIs, and whether vendors supply prebuilt binaries.

Update to 16 KB‑ready SDKs

React Native and Flutter offer compatible releases today. Unity also provides aligned builds, and Vivox reports readiness for voice features.

Monitor Unreal for its official timeline and plan fallbacks if a vendor misses delivery dates.

Coordinate with vendors for compliant binaries

Ask each vendor for a statement of compliance and artifact details: ABI targets, alignment flags, build toolchain, and minimum OS level.

“Request vendor statements and verify artifacts with APK Analyzer and Lint before gating a release.”

  • Validate updated libraries with APK Analyzer and Lint for alignment and packaging regressions.
  • Create a vendor tracker with delivery dates, test results, and fallback options.
  • Run targeted tests for voice, streaming, and camera pipelines that are sensitive to mapping behavior.
  • Check transitive dependencies inside SDK bundles; nested libraries must be verified too.
  • Gate releases: add a dependency sign‑off step so non‑compliant artifacts cannot ship.
Item Owner Validation Fallback
SDK inventory Engineering lead APK Analyzer export Replace or vendor patch
Vendor compliance Vendor manager Vendor statement + ABI check Temporary shim or alternate lib
Feature tests QA lead Performance and stability runs Feature toggle / staged rollout

Need help? Contact us to upgrade your app and ensure full compatibility with the latest Google Play requirements. Visit www.iottive.com or email sales@iottive.com.

Automate checks in CI: lint, alignment, and compliance gates

Automating artifact checks prevents last‑minute release blocks and saves engineering hours.

Start by integrating tools that flag misaligned binaries and hardcoded page values early. Add Android Studio lint as a CI step so native libraries and suspicious code patterns surface in pull requests.

Integrate Android Studio Lint and command‑line scripts

Run lint with a strict ruleset and fail on alignment warnings. Combine that with command‑line scripts that validate packaging flags and parse artifact headers for correct page alignment.

Fail builds on non‑aligned libraries and PAGE_SIZE violations

Create a compliance gate that fails builds when any binary, library, or code heuristic triggers. Automate APK Analyzer or equivalent tooling to emit machine‑readable alignment reports.

Check Action CI Outcome
Lint scan Android Studio rules PR fails with details
Binary alignment Command‑line validator Build blocked if non‑aligned
Artifact audit APK Analyzer export Machine report for dashboards

Best practice: ensure agents build with AGP 8.5.1+ and NDK r28+ so defaults reduce manual work. Add smoke test runs for cold and warm launches as part of the gate.

Contact us to upgrade your application and ensure full compatibility with the latest Play requirements: www.iottive.com or sales@iottive.com.

Measure the wins: launches, battery, camera, and system performance

Quantify end‑user impact by tracking launch times, battery draw, and camera latency across a set of representative devices.

Establish pre‑migration baselines for cold and warm app launches, typical battery usage during normal sessions, camera startup latency, and boot‑adjacent flows. After enabling larger page size support, rerun the same tests and compare results.

Observed outcomes: faster app launches up to 30% (about 3% average), battery savings near 4.56%, quicker camera starts between 4.48% and 6.60%, and boot improvements around 0.8 seconds.

  • Attribute gains to lower MMU overhead and fewer TLB misses, which improve system responsiveness on many devices.
  • Use consistent device sets (both 4 KB and larger page configs) so results isolate the page size effect from other variables.
  • Track memory usage alongside performance so net user benefit is clear for product teams.
Metric Baseline Observed gain
Cold app launches 1000 ms ~3% faster (avg)
Battery usage (session) 100% baseline ~4.56% reduction
Camera startup 200 ms 4.48–6.60% quicker

Share results with stakeholders and use documented gains as justification for continued low‑level optimization. For help building measurement frameworks or interpreting outcomes, contact us at www.iottive.com or sales@iottive.com.

Conclusion

A timely migration protects releases and turns an optimization into a compliance win for developers.

Google Play enforces that updates targeting Android must support the 16 KB page size from November 1, 2025, so teams must act now to avoid blocked uploads and lost visibility.

Practical steps: upgrade Android Studio and AGP, move to NDK r28+, remove fixed page assumptions, rebuild native modules, and validate artifacts across both page size configurations with APK Analyzer and Lint.

Benefit: properly aligned artifacts run on both 4 KB and larger page installs, improving page tables efficiency and lowering runtime overhead for a smoother user experience.

For planning, audits, build changes, and vendor coordination, contact www.iottive.com or sales@iottive.com. This migration is a strategic investment in compliance, performance, and long‑term resilience.

FAQ

What changes on November 1, 2025?

Google Play requires that new submissions and updates targeting Android 15 or higher package native binaries with 16 KB page alignment. This affects apps that include native C/C++ libraries, game engines, or third‑party SDKs. The goal is better runtime performance, faster cold starts, improved camera responsiveness, and lower battery drain.

Why move from 4 KB pages to 16 KB pages?

Larger page granularity reduces page table entries, cuts TLB pressure, and improves I/O and memory mapping behavior. That translates into quicker launches, faster boot paths, and smoother camera handoffs on modern silicon. It also aligns with the system’s default runtime optimizations in Android 15.

Which binaries are in scope for the deadline?

Any native library (.so) packaged inside an APK or AAB must be aligned for 16 KB pages when the app targets Android 15+. This includes third‑party SDK modules, game engines, custom native code, and bundled runtimes such as those used by React Native, Flutter, Unity, or Unreal.

How do I find native modules that need changes?

Use APK Analyzer or unzip the package and inspect lib/ for .so files. Search source trees for PAGE_SIZE or hardcoded 4096 values. Static analysis and simple scripts can flag mismatches, and Android Studio tools list packaged native artifacts for review.

How should I handle hardcoded page‑size constants?

Replace literal 4096 values with runtime queries such as getpagesize() or sysconf(_SC_PAGESIZE). Audit code paths that assume alignment for mmap, custom allocators, or shared memory and refactor them to be page‑size agnostic.

What toolchain versions enable 16 KB packaging?

Use Android Studio with AGP 8.5.1 or later and Android NDK r28 or newer. Older NDKs can sometimes be made compatible by adding linker flags, but rebuilding all native modules with the supported toolchain is the safest approach.

Do I need to rebuild third‑party SDKs I don’t control?

Yes. If a vendor supplies prebuilt .so files that assume 4 KB, those artifacts must be updated. Coordinate with SDK providers and check their release notes for 16 KB‑ready binaries. For engines like Unity or Flutter, monitor official channels for compliant builds.

How can I test compatibility locally?

Run emulators configured for 16 KB page targets, test on real devices (Pixel devices expose getconf PAGE_SIZE via adb shell), and use remote device labs like Samsung Remote Test Lab for broader coverage. Validate cold starts, camera launch, and mmap behaviors under both 4 KB and 16 KB environments.

What CI checks should I add?

Add lint rules and scripts that detect non‑aligned libraries, hardcoded 4096 constants, and PAGE_SIZE misuse. Fail builds that include offending binaries. Integrate APK Analyzer steps and automated on‑device smoke tests to catch regressions early.

How do I verify binary alignment?

Use build outputs and readelf/objdump to inspect segment offsets and alignment. Packaging tools in AGP will report alignment status; you can also write small scripts that check file offsets within the AAB/APK for divisibility by 16 KB.

Will supporting larger page sizes improve battery life?

In many cases, yes. Reduced page table activity and fewer TLB misses lower CPU overhead, which can cut power usage during heavy memory operations. Gains vary by workload, device, and whether the app uses native code heavily.

Are there known runtime risks after switching page sizes?

Risk areas include allocators that assume page granularity, misaligned mmap offsets, and hand‑rolled memory pools. Unchecked assumptions can cause crashes or subtle corruption. Thorough testing and replacing fixed constants with runtime queries mitigate these risks.

What’s the recommended rollout plan?

Assign owners and deadlines now, inventory native code and SDKs, upgrade toolchains, rebuild native modules, run device and emulator tests, and gate CI to block non‑compliant builds. Coordinate vendor updates for third‑party libraries and communicate timelines internally.

Where can I get expert help or enterprise support?

At Iottive, we bring proven expertise in native build optimization, compatibility upgrades, and end-to-end app modernization. Our team helps accelerate compliance, minimize risks, and ensure your Android applications meet the latest standards without disruptions.

Visit us: www.iottive.com

FAQ

What changes on November 1, 2025?

Google Play requires that new submissions and updates targeting Android 15 or higher package native binaries with 16 KB page alignment. This affects apps that include native C/C++ libraries, game engines, or third‑party SDKs. The goal is better runtime performance, faster cold starts, improved camera responsiveness, and lower battery drain.

Why move from 4 KB pages to 16 KB pages?

Larger page granularity reduces page table entries, cuts TLB pressure, and improves I/O and memory mapping behavior. That translates into quicker launches, faster boot paths, and smoother camera handoffs on modern silicon. It also aligns with the system’s default runtime optimizations in Android 15.

Which binaries are in scope for the deadline?

Any native library (.so) packaged inside an APK or AAB must be aligned for 16 KB pages when the app targets Android 15+. This includes third‑party SDK modules, game engines, custom native code, and bundled runtimes such as those used by React Native, Flutter, Unity, or Unreal.

How do I find native modules that need changes?

Use APK Analyzer or unzip the package and inspect lib/ for .so files. Search source trees for PAGE_SIZE or hardcoded 4096 values. Static analysis and simple scripts can flag mismatches, and Android Studio tools list packaged native artifacts for review.

How should I handle hardcoded page‑size constants?

Replace literal 4096 values with runtime queries such as getpagesize() or sysconf(_SC_PAGESIZE). Audit code paths that assume alignment for mmap, custom allocators, or shared memory and refactor them to be page‑size agnostic.

What toolchain versions enable 16 KB packaging?

Use Android Studio with AGP 8.5.1 or later and Android NDK r28 or newer. Older NDKs can sometimes be made compatible by adding linker flags, but rebuilding all native modules with the supported toolchain is the safest approach.

Do I need to rebuild third‑party SDKs I don’t control?

Yes. If a vendor supplies prebuilt .so files that assume 4 KB, those artifacts must be updated. Coordinate with SDK providers and check their release notes for 16 KB‑ready binaries. For engines like Unity or Flutter, monitor official channels for compliant builds.

How can I test compatibility locally?

Run emulators configured for 16 KB page targets, test on real devices (Pixel devices expose getconf PAGE_SIZE via adb shell), and use remote device labs like Samsung Remote Test Lab for broader coverage. Validate cold starts, camera launch, and mmap behaviors under both 4 KB and 16 KB environments.

What CI checks should I add?

Add lint rules and scripts that detect non‑aligned libraries, hardcoded 4096 constants, and PAGE_SIZE misuse. Fail builds that include offending binaries. Integrate APK Analyzer steps and automated on‑device smoke tests to catch regressions early.

How do I verify binary alignment?

Use build outputs and readelf/objdump to inspect segment offsets and alignment. Packaging tools in AGP will report alignment status; you can also write small scripts that check file offsets within the AAB/APK for divisibility by 16 KB.

Will supporting larger page sizes improve battery life?

In many cases, yes. Reduced page table activity and fewer TLB misses lower CPU overhead, which can cut power usage during heavy memory operations. Gains vary by workload, device, and whether the app uses native code heavily.

Are there known runtime risks after switching page sizes?

Risk areas include allocators that assume page granularity, misaligned mmap offsets, and hand‑rolled memory pools. Unchecked assumptions can cause crashes or subtle corruption. Thorough testing and replacing fixed constants with runtime queries mitigate these risks.

What’s the recommended rollout plan?

Assign owners and deadlines now, inventory native code and SDKs, upgrade toolchains, rebuild native modules, run device and emulator tests, and gate CI to block non‑compliant builds. Coordinate vendor updates for third‑party libraries and communicate timelines internally.


Let’s Get Started

From Field to Data: How IoT is Powering Player Performance Insights

One afternoon, a coach paused mid-drill. An athlete seemed off—slower reactions, shallow breath. The coach sent the player to the sidelines and checked a live dashboard.

That quick check changed the practice. Connected sensors had flagged rising temperature and a dip in cadence. Cloud and edge systems combined to turn those signals into clear, timely insights.

IoT sports analytics, real-time player tracking, AI sports strategy tools

This guide shows how wearable sensors, BLE and Bluetooth gateways, 5G and LPWANs, plus cloud-edge computing form a seamless pipeline. Iottive’s end-to-end capabilities in BLE app development, firmware, and cloud integration help teams move from concept to reliable solutions.

Expect clear examples—from instrumented apparel to smart eyewear—plus practical templates for KPIs, governance, and integration with coaching workflows. The result: faster decisions, safer athletes, and better game performance across the industry.

Key Takeaways

  • Connected devices translate on-field actions into usable data and insights.
  • Cloud-edge systems reduce latency where milliseconds matter.
  • Interoperability prevents costly data silos and keeps systems future-ready.
  • Iottive offers BLE, mobile, and cloud expertise to deliver end-to-end solutions.
  • Deployments unlock faster decisions, safer athletes, and enhanced fan experiences.

Why IoT Sports Analytics Matter Right Now

Decision-makers in U.S. sports seek systems that convert large data flows into clear coaching actions. Teams and leagues want practical, market-ready approaches that tie device signals to health, training, and game outcomes.

User intent in the United States market

In the U.S., organizations look for fast validation and measurable ROI. Executives view projections for analytics and AI adoption as a signal: pilots must move to scale. Investment drivers include monitoring, forecasting, and mobile apps that assess skill and workload.

From stats to strategy: turning vast amounts data into decisions

Sensors and apps broaden access to usable insights for coaches and athletes. Unified systems beat siloed stats by delivering curated dashboards, alerts, and role-based access that guide training and in-game choices.

  • KPIs matter: availability, latency, and accuracy ensure data improves performance.
  • Map use cases to ROI: reduce injury risk and grow revenue via engagement and sponsorship.
  • Start small, validate fast, then scale with coach involvement to secure adoption.

Iottive understands U.S. team and league needs and can help align programs with compliance and mobile expectations. Contact: www.iottive.com | sales@iottive.com.

Core Technologies Behind Connected Sports Performance

A layered tech stack — from on-body sensors to cloud services — makes precise performance monitoring possible in busy venues.

Sensors and wearables capture heart rate, temperature, hydration, and motion. IMUs record biomechanics. Optical and electrical sensors read pulse and hydration markers. Temperature sensors enforce safety thresholds during intense training.

A high-resolution, detailed close-up image of various sensors and electronic components used in IoT and connected sports performance tracking. The foreground features a collection of small, low-profile sensors including accelerometers, gyroscopes, GPS modules, and heart rate monitors, neatly arranged on a matte black surface. The middle ground shows a wearable GPS tracker device with sleek, minimalist design. In the background, a coach's tablet displays live data visualizations and analytics from the connected sensors. The image has a technical, industrial aesthetic with carefully balanced lighting that highlights the intricate details of the sensors and electronic parts.

Connectivity stack

Bluetooth Low Energy suits low-power wearables. 5G handles high-throughput uplinks with low latency. LPWANs cover wide venue ranges when many devices are present.

Cloud and edge computing

Process urgent alerts at the edge to cut delay. Use cloud storage for historical analytics and coach dashboards. Balance both to protect battery life and scale systems.

Interoperability and resilience

Standard schemas and APIs prevent vendor lock-in. Secure device identity, OTA updates, and telemetry pipelines keep systems reliable as sensors multiply.

“Modular architectures let teams add new sensors without rebuilding core integrations.”

Layer Function Example
Wearable Capture heart rate, motion, temp BLE earbuds, chest straps, IMU patches
Connectivity Transport and range BLE, Wi‑Fi, 5G, LPWAN
Processing Edge alerts; cloud analytics Edge nodes; cloud time-series DBs

Iottive builds BLE firmware, mobile apps, and cloud integration to keep data flowing. Contact: www.iottive.com | sales@iottive.com.

IoT Data Pipeline: From Field Devices to Actionable Insights

A reliable pipeline turns raw sensor signals on the field into clear, actionable dashboards for coaches. A good design balances latency, cost, and privacy while moving data from devices to visualization.

A futuristic data pipeline visualization depicting the flow of IoT sensor data from a live tennis match. In the foreground, a coach reviews insights on a tablet, monitoring player performance metrics captured by GPS trackers. The middle ground shows an abstract data stream flowing through interconnected nodes, visualizing the real-time processing and analysis of the sensor data. In the background, a sleek, minimalist data center with glowing server racks and cooling systems provides the infrastructure powering this intelligent sports analytics platform. The scene is illuminated by soft, directional lighting, creating a sense of technological sophistication and seamless integration between the physical and digital realms.

Gateway choices and WAN considerations

Choose gateways based on range and power needs. BLE fits short-range, low-power wearables. Zigbee supports resilient mesh networks. LoRaWAN covers long-range, low-throughput stadium zones.

Cloud platforms and storage patterns

Use managed platforms—AWS IoT Core, Azure IoT Hub, or GCP Cloud IoT Core—for secure onboarding and certificate management.

Storage tiers: hot (S3/Blob/GCS) for recent streams, warm for aggregated sets, cold for archival. DynamoDB or other NoSQL stores hold metadata and fast lookups.

Streaming, processing, and machine learning

Ingest with Kinesis or Pub/Sub, transform with Glue or equivalent, and feed ML services like Azure ML or GCP AutoML for anomaly detection and injury prediction.

Edge preprocessing and batching cut latency. Schema validation and calibration logs keep the datasets trustworthy.

Dashboards and coach-facing design

Design for roles: coaches, medical staff, and athletes need views with thresholds, alerts, and drill-downs. Power BI, Tableau, and Google Data Studio map well to these workflows.

  • Compare gateways: BLE, Zigbee, LoRaWAN for range and power trade-offs.
  • Secure message routing via AWS IoT Core / Azure IoT Hub / GCP Core.
  • Hot/warm/cold storage with S3/Blob/GCS and DynamoDB for metadata.
  • Streaming with Kinesis + Glue to deliver clean, coach-ready datasets.
  • Privacy-by-design: minimal collection, encryption, and granular access control.

“Iottive builds end-to-end pipelines—from BLE gateway integration to AWS/Azure/GCP ingestion and mobile visualization—so teams can act on insights fast.”

Contact: www.iottive.com | sales@iottive.com

IoT sports analytics, real-time player tracking, AI sports strategy tools

Combining wearable telemetry with vision feeds turns raw signals into coach-ready insights. Iottive links GPS/IMU devices and edge video to cloud ML so staff get positional and workload views during sessions and games.

Live stacks to optimize training and tactics

Define stacks that pair GPS, IMU wearables, and on-field video for instant positional maps and load metrics. Edge inference trims latency so coaches see readiness scores and zone maps fast.

Predictive models for injuries and workload

Machine learning models use cumulative load, sleep surrogates, and intensity spikes to forecast soft-tissue risks. Heart rate variability and acceleration load indexes guide training programs, substitutions, and recovery days.

Feature Input Output
Live position GPS + vision Heatmaps, zone maps
Workload load IMU + heart rate Readiness score, sub suggestions
Injury forecast History + sleep + load Risk % and recovery plan

Role-based dashboards share tailored views with medical staff, strength coaches, and head coaches. Alerts flag threshold breaches like hydration or core temperature to protect athletes. Iottive blends device telemetry, video, and app UX into a single solution for better decisions and player availability. Contact: www.iottive.com | sales@iottive.com.

On-Body and On-Field: Smart Apparel, Footwear, and Equipment

Footwear insoles, EMG shirts, and instrumented bats bring lab-grade metrics onto the field. These devices capture movement, muscle load, and impact details so coaches and athletes get clear, useful data during training and games.

A high-tech smart sneaker with embedded sensors, designed to track athletic performance. The sleek, modern design features a translucent, futuristic upper with glowing accents, capturing the essence of cutting-edge sports technology. The midsole houses an array of advanced sensors, meticulously capturing every movement and data point, from stride length to impact force. Bathed in a cool, futuristic lighting, the scene conveys a sense of precision, innovation, and the seamless integration of technology into athletic apparel.

Smart footwear metrics

Modern insoles house gyroscopes, accelerometers, magnetometers, pedometers, barometric sensors, physiologic sensors, and GPS.

Outputs: speed, distance, acceleration, gait symmetry, and foot strike. Coaches use these to refine technique and lower injury risk.

EMG-enabled apparel

EMG shirts detect muscle activation patterns and early fatigue. That data feeds recovery plans and session intensity adjustments.

Instrumented equipment

Smart balls, bats, rackets, and clubs log swing speed, impact location, and spin. Examples include StanceBeam-style sensors and OpenCV ball detection, plus Microsoft’s bat work for swing angle and shot quality.

Device Key Sensors Coaching Outcome
Footwear insole Accel, gyro, barometer, GPS Gait symmetry, stride cues
EMG apparel Surface EMG arrays Fatigue detection, load balancing
Instrumented bat/ball Impact sensors, vision Swing feedback, drill personalization

Combine heart rate and workload with motion metrics to produce a readiness score. Calibration, fit, durability, and battery life matter most in high-contact and wet environments. Iottive builds Bluetooth-connected firmware, apps, and cloud dashboards so athletes focus on drills, not devices. Contact: www.iottive.com | sales@iottive.com.

In-Game Strategy and Coaching Enhanced by AI

Coaches need fast, clear surfaces that turn video and sensor feeds into actionable guidance during a game. Iottive combines computer vision with wearable telemetry to deliver concise visuals and live suggestions that fit a coach’s workflow.

Real Image of A professional tennis match captured in a dynamic, data-driven moment. In the foreground, two players engage in an intense rally, their movements tracked by GPS sensors embedded in their uniforms. The coach, standing on the sideline, intently studies a tablet displaying live analytics - a tapestry of lines, charts, and insights that inform their strategic decisions. The court is bathed in warm, golden light, creating a sense of energy and focus. The background blurs, drawing the viewer's attention to the fusion of physical performance and digital intelligence that powers modern sports coaching.

Computer vision and video breakdown

Vision systems tag formations, pressing triggers, and spacing to reveal patterns that are hard to see live.

These clips highlight recurring runs, weak zones, and set-piece tendencies. Coaches get high-signal snippets for quick review.

Real-time decision support and opponent analysis

Decision engines recommend tactical shifts, matchups, and substitutions based on evolving context and pregame scouting data.

Blended telemetry—video plus sensor data—increases confidence in calls on tempo control, transitions, and set plays.

  • Delivery: simplified tablet screens on the bench for fast comprehension.
  • Governance: replayability and audit logs let teams review and improve choices after the match.
  • Operational notes: latency budgets and staff change management are critical so recommendations arrive in time and earn trust.

“Iottive tailors AI surfaces to each team’s terms and coaching philosophy, balancing privacy and competitive integrity.”

Stadium and Operations: The Smart Venue Advantage

A smart venue layers connectivity and apps to turn every seat into a personalized experience.

A packed stadium buzzes with energy as fans cheer passionately, their faces illuminated by the warm glow of stadium lighting. In the foreground, a player wearing a GPS tracker deftly moves across the court, their every movement captured by a high-resolution camera. On the sidelines, a coach intently studies a tablet displaying live analytics, using the data to guide the team's strategy. The atmosphere is electric, the sense of anticipation palpable, as the stadium comes alive with the thrill of the game.

Fan engagement grows when personalized content and AR overlays surface stats, 360 replays, and offers on a fan’s device.

Exclusive apps guide parking, restrooms, and seat upgrades. They also enable in-seat ordering and contextual coupons to lift revenue and satisfaction.

Facility management and crowd flow

Crowd flow analytics cut wait times by optimizing entry, concessions, and egress. Dashboards unify security, maintenance, and guest services for faster decisions.

Energy and facility optimization tune HVAC and schedule cleaning based on real occupancy. This reduces costs and improves comfort.

Use Case What it Delivers Iottive Role
Personalized content & AR Live overlays, replays, offers BLE beacons, mobile apps, cloud
Crowd & safety Flow maps, incident alerts Edge sensors, operations dashboards
Facility efficiency HVAC tuning, smart cleaning Occupancy sensing, analytics backend

Accessibility features include wayfinding and assistive content for fans with different needs. AR-capable eyewear extends premium experiences in suites and clubs.

Privacy matters: explicit consent flows and clear data choices keep fan trust high while enabling personalized journeys.

“Iottive delivers mobile apps, BLE beacons, and cloud backends to power personalized fan experiences and efficient venue operations.”

Contact: www.iottive.com | sales@iottive.com

Market Signals: Adoption, Growth, and Competitive Edge

Market growth is reshaping how teams invest in data-driven performance and fan experience. Forecasts show the global sports analytics market reaching about $22B by 2030 and sports-focused AI near $19.9B the same year. These figures justify timing for measured investment.

Early adopters turn insights into on-field wins and off-field revenue by linking device signals to ticketing, sponsorship, and training programs. Consolidation and platform standards are reducing integration risk, making scale more feasible.

Where growth is fastest

  • Player monitoring and wearable-driven performance.
  • Video analytics and personalization for fan experience.
  • Venue operations and automated workflows.
Metric 2030 Projection Why it matters
Global market $22B Capital availability and vendor maturity
AI segment $19.9B Predictive models and automation
Fastest growth Monitoring, video, personalization Direct impact on performance & revenue

Iottive advises on platform choices, hiring, and a 12–24 month roadmap to translate market signals into measurable ROI. Plan budgets that tie spend to outcomes like fewer injuries, higher attendance, and sponsor activation to protect upside potential.

Privacy, Security, and Compliance in Athlete Data

Protecting biometric streams starts with design choices that span device firmware, gateways, and cloud platforms. Secure defaults reduce risk and keep coaches focused on training and performance rather than breaches.

Protecting biometric data across devices, networks, and cloud

Encrypt data in transit and at rest. Use TLS, certificate pinning, and device attestation so sensor-to-gateway channels stay private.

Edge processing keeps identifiers local when possible. That lowers exposure and preserves latency budgets for game monitoring.

Role-based access and policy frameworks for teams and leagues

Implement least-privilege access for coaches, medical staff, and operations. Token scopes, secure key management, and audit logs meet league and regulatory needs.

  • Minimize collection, set retention limits, and anonymize for research.
  • Segment athlete and venue networks to isolate risks and protect uptime.
  • Run vendor due diligence and contract controls for third-party data handling.
  • Practice incident runbooks and tabletop drills tailored to game-day scenarios.

Iottive embeds encryption, secure device identity, OTA updates, and role-based mobile/cloud access into architectures from day one.

Contact: www.iottive.com | sales@iottive.com.

From Pilot to Scale: A Practical Roadmap for Teams and Leagues

A clear roadmap helps teams move from small tests to full-season rollout without disrupting training routines.

Start by defining objectives and KPIs. Set measurable goals for wins, availability, and fan satisfaction. Add data governance rules for privacy and retention.

Define objectives, KPIs, and data governance

Keep goals simple and linked to outcomes. Track availability, performance, and recovery metrics. Use role-based access and retention policies from day one.

Select sensors, connectivity, and platforms aligned to use cases

Pick sensors and gateways that match venue limits, battery life, and accuracy needs. Choose cloud services that fit team skills and integration pace.

Pilot, validate, and integrate into coaching workflows

Run a quick pilot with a subset of athletes. Validate accuracy in real sessions and get coach feedback fast.

Phase Focus Outcome
Discovery Objectives, KPIs, governance Clear success criteria
Pilot Sensors, sample athletes, sessions Validated metrics & coach buy-in
Scale Device lifecycle, OTA, SLAs Full integration into game and training

Plan for scale: budget by phases, staff data ops, and document ROI. Lean on Iottive for discovery, prototyping, and full-stack rollout to speed integration into coaching and ops. Contact: www.iottive.com | sales@iottive.com.

Real-World Inspiration: Notable Use Cases and Tools

Practical deployments show how wearable apparel and eyewear turn lab measures into on-field guidance. These examples make clear how teams and coaches move from signals to smart decisions.

EMG-enabled apparel for muscle load insights

Athos uses EMG arrays in garments to reveal muscle activation and fatigue patterns.

Coaching value: clearer load management, form feedback, and faster, data-backed choices that protect athletes and boost performance.

Advanced trackers and smart eyewear for live stats

GlassUp smart glasses overlay live and historical metrics when a coach focuses on an athlete. 3L Labs builds rehab trackers that spot early movement issues and support recovery.

  • Precise muscle load distribution and fatigue detection.
  • Context-aware overlays to deepen coach and fan understanding.
  • Rehab-focused monitoring that links performance with medical insights.
  • BLE apps that simplify setup, syncing, and alerts for staff and athletes.

Iottive partners with brands to bring EMG apparel, smart eyewear, and advanced trackers to market with BLE apps and enterprise cloud dashboards.

These examples span court, field, track, and pool. Teams can monetize via deployments, consumer subscriptions, and sponsor integrations. Contact: www.iottive.com | sales@iottive.com.

Partnering for Success: How Iottive Builds End-to-End Sports IoT

Iottive delivers turn-key programs that tie hardware, firmware, mobile apps, and cloud services into one dependable platform. We focus on clear goals, rapid prototyping, and standards-based interfaces so teams and venues get usable data fast.

Our expertise: IoT & AIoT Solutions, BLE App Development, Cloud & Mobile Integration

We build BLE apps and firmware, then connect them to secure cloud pipelines and dashboards. That integration reduces silos and shortens time-to-value for performance and fan engagement programs.

Custom products and platforms for athlete monitoring and fan experiences

  • End-to-end delivery: hardware integration, BLE app development, cloud pipelines, and visualization.
  • Athlete monitoring: coach-friendly dashboards with secure, low-latency data and OTA firmware updates.
  • Fan experiences: personalized mobile apps, AR features, and loyalty components to boost engagement.

Industries served and Bluetooth-connected solutions

We work across healthcare, automotive, smart home, consumer electronics, and industrial sectors. Cross-industry lessons speed delivery and improve robustness.

“Standards and interoperability are central to future-proofing investments.”

Ready to scope a project? Contact Iottive for discovery sessions and custom applications—from smart footwear to stadium apps. www.iottive.com | sales@iottive.com

Conclusion

Conclusion

When technology and coaching align, data becomes a dependable guide for daily practice and long-term planning.

Connected systems transform training, recovery, and match preparation by turning sensor feeds into timely, trustworthy analytics that support smarter decisions and better athlete care.

Secure, interoperable technologies ensure signals become action without vendor lock-in or privacy risk. Smart venues also lift fan experience while optimizing operations and revenue.

Take a measured roadmap: set objectives, pilot quickly, integrate with workflows, then scale. This approach protects athlete safety and yields durable performance gains.

Iottive is ready to help design, build, and scale these programs. Contact a discovery session: www.iottive.com | sales@iottive.com. Assess your stack, spot quick wins, and build a 12–24 month plan to seize the next era of competitive impact.

FAQ

What is the value of connected field devices for improving athlete performance?

Connected field devices capture metrics like heart rate, biomechanics, and workload to give coaches clear, actionable insights. These devices help tailor training programs, reduce injury risk, and improve decision-making during practices and games. Integration with cloud platforms and machine learning provides quick feedback so staff can adjust sessions the same day.

How do wearables and smart apparel differ in the data they provide?

Wearables typically focus on heart rate, GPS-derived speed and distance, and simple motion metrics. Smart apparel and EMG-enabled garments go deeper, measuring muscle activation, fatigue indicators, and recovery needs. Combining both types of data gives a richer view of performance and helps refine conditioning and load management.

Which connectivity options work best inside stadiums and training facilities?

Bluetooth Low Energy works well close to athletes for device pairing, while Wi‑Fi and 5G provide higher bandwidth for video and streaming. LPWANs and LoRaWAN suit long-range telemetry and lower-power sensors. The right mix depends on latency needs, device density, and infrastructure budget.

What role do cloud and edge compute play in in-game decision support?

Edge compute handles low-latency tasks—like live motion analysis and immediate alerts—while cloud platforms such as AWS, Azure, or Google Cloud scale storage, batch processing, and model training. Together they power dashboards that support coaching decisions and post-game analysis.

How can teams prevent data silos and ensure interoperability between systems?

Adopting common standards, open APIs, and middleware that translates formats helps systems share information. Choosing vendors who support exportable formats and integrating through cloud platforms reduces vendor lock-in and keeps athlete and match data unified for analysis.

What machine learning models are most useful for predicting injuries?

Models that combine workload metrics, biometric signals, and historical injury records—such as gradient boosting and time-series deep learning—work well. They flag elevated risk by detecting deviations in workload, sleep, or recovery, enabling targeted intervention and load adjustments.

How do teams use live tracking to optimize tactics and training sessions?

Real-time location and biometric data reveal spacing, effort patterns, and substitution effects. Coaches adjust tactics, simulate opponent scenarios, and tailor drills to close tactical gaps. Live dashboards let staff compare players’ current outputs to baseline fitness and match plan demands.

What are common gateway and streaming choices for moving sensor data to analytics platforms?

Gateways often bridge BLE or Zigbee sensors to local networks, then forward to cloud services using secure MQTT or HTTPS. For streaming and processing, teams rely on managed services for ingestion, low-latency processing, and model inference to feed live dashboards and alerts.

Which visualization approaches help coaches and athletes act on complex data?

Simple, role-specific dashboards win: heat maps for positioning, trend lines for load, and event-linked video clips for situational learning. Visual cues and automated summaries reduce cognitive load so coaches focus on decisions rather than raw numbers.

How can teams balance fan engagement features with athlete privacy and security?

Teams should anonymize biometric streams, implement role-based access, and obtain clear consent for any fan-facing content. Strong encryption, regular audits, and compliance with privacy standards protect athlete data while allowing personalized fan experiences like AR overlays and live stats.

What pilot steps should organizations follow before scaling a connected performance program?

Start by defining objectives and KPIs, choose a focused use case, select compatible sensors and platforms, and run a controlled pilot. Validate data quality, integrate with coaching workflows, and iterate before broader rollouts to ensure operational fit and ROI.

What commercial platforms support end-to-end telemetry, storage, and analytics?

Major cloud providers—Amazon Web Services, Microsoft Azure, and Google Cloud—offer IoT and machine learning services tailored for telemetry, storage, and real-time processing. Specialized vendors provide sport-specific integrations for athlete monitoring, video tagging, and fan engagement.

How do smart equipment innovations—like instrumented balls or rackets—add value?

Instrumented gear captures impact forces, spin, and strike location that wearable sensors can’t. That data enhances skill coaching, technique correction, and product development for manufacturers. When fused with wearable metrics, teams get a fuller picture of performance drivers.

What operational benefits do smart venues deliver beyond fan features?

Smart venues improve safety with crowd-flow analytics, optimize energy use with sensor-driven controls, and streamline facility operations via predictive maintenance. These efficiencies reduce costs and enhance the overall event experience for teams and attendees.

Which metrics matter most for workload management and recovery planning?

Key metrics include acute and chronic workload ratios, heart-rate variability, sleep quality, and muscle activation patterns. Tracking these over time helps staff schedule rest, adjust intensity, and lower injury risk while maximizing performance readiness.

How should organizations secure biometric data across devices, networks, and cloud?

Use end-to-end encryption, enforce least-privilege access, and implement centralized identity and access management. Regular security testing and clear retention policies ensure compliance with league and regional privacy requirements.

What examples exist of successful EMG apparel or advanced eyewear in pro settings?

Professional teams and training centers now use EMG-enabled garments to monitor muscle load during rehab and high-performance cycles. Smart eyewear and heads-up displays support situational awareness for coaches and broadcasters by overlaying live stats and tactical cues.

How can vendors and teams collaborate to build custom monitoring and fan experience solutions?

Begin with shared goals, co-design pilots, and define integration points for sensors, mobile apps, and cloud services. Agile development, joint testing, and phased deployments help align technical capabilities with coaching needs and fan engagement strategies.


Let’s Get Started

IoT and AI-Based Safety Systems for Autonomous Vehicles in 2025

On a wet Thursday morning, a fleet manager in Phoenix watched an alert flash on a tablet.

The message came from a connected system that had seen a sudden lane obstruction and pushed a route update to nearby cars. The manager routed two trucks away from the hazard, and a small pileup was avoided.

This scene shows how artificial intelligence and connected sensors work together to make fast decisions on U.S. roads. Real-time perception, radar and camera fusion, edge GPUs, HD maps, and 5G/V2X links let systems detect obstacles, plan paths, and update software over the air.

Leaders such as Waymo, Tesla, NVIDIA, and Cruise use simulation and synthetic data to test rare events off public streets. This article will explain how the autonomy stack, telematics, and continuous diagnostics aim to reduce crashes and keep traffic moving toward a safer future.

AI autonomous driving safety, IoT vehicle monitoring, self-driving prevention.

Key Takeaways

  • How artificial intelligence and telematics converge to boost road safety in 2025.
  • Main components: perception, prediction, planning, and control for autonomous vehicles.
  • Edge GPUs, HD maps, and 5G/V2X deliver millisecond decisions for critical moves.
  • Simulation and synthetic data help validate behavior without public-road risk.
  • Fleet tools and OTA updates speed diagnostics and repair to lower downtime.

The 2025 Landscape: How AI and IoT Are Shaping Autonomous Vehicles in the United States

By 2025, networks of sensors and powerful on-board processors have reshaped how cars sense and react.

Artificial intelligence now functions as the on-road brain. Onboard GPUs handle streams from cameras, LiDAR, and radar to spot obstacles and plan routes in milliseconds.

High-definition maps add centimeter-level context. Cloud services push map updates and large model training, while edge compute runs real-time inference inside each vehicle.

Sleek autonomous vehicles navigating a bustling highway in the year 2025, their advanced AI systems scanning the environment for potential hazards. A high-tech overlay displays real-time data, highlighting road conditions, obstacles, and hazards detected by an intricate network of IoT sensors. The scene exudes a sense of futuristic efficiency and safety, with the cars seamlessly merging and maneuvering through traffic, guided by the intelligent integration of AI and IoT technologies. Crisp, high-definition rendering, with a cinematic depth of field and dramatic lighting, captures the dynamic and cutting-edge nature of this vision for the future of transportation.

  • 5G and V2X enable fast updates, cooperative awareness, and remote diagnostics that improve traffic flow and reduce delays.
  • Consortia collect petabytes of driving data and use simulation to cover rare situations and complex intersections.
  • Automakers, mapping providers, and software companies partner to scale reliable systems across U.S. roads.
Component Role Impact on Roads
Edge Compute Real-time inference on-board Lower latency for split-second maneuvers
HD Maps Centimeter localization Better lane and sign recognition
5G / V2X OTA updates & cooperative alerts Faster traffic coordination
Simulation Generative scenarios for rare events Accelerated development and testing

Despite rapid progress, dynamic construction zones and unpredictable human behavior remain key situations for ongoing development. The goal is clear: reduce crashes, widen mobility access, and smooth traffic across cities and interstates.

Inside the Autonomous Driving Stack: From Perception to Control

The stack organizes raw sensor inputs into timely, reliable outputs that guide every maneuver on the road.

Perception fuses data from cameras, LiDAR, radar, and ultrasonics to produce object lists and lane geometry. CNN-based computer vision powers semantic segmentation, traffic signs recognition, and robust object detection under varied lighting. Redundancy and calibration preserve accuracy when sensors face occlusion or noise.

Prediction uses sequence models and probabilistic learners to forecast pedestrian and vehicle motions. These forecasts let planners reduce conflict points and choose safer paths before hazards appear.

A serene highway at dusk, an autonomous vehicle navigates the lanes, its sensors and AI processors working in harmony. In the foreground, a vivid augmented reality overlay depicts a detailed perception of the environment - recognized objects, hazards, and potential threats, all highlighted in a sleek, futuristic interface. The middle ground features the car's elegant silhouette, its exterior gleaming under warm, directional lighting. In the distance, a sprawling cityscape fades into the horizon, hinting at the car's advanced integration with the IoT ecosystem. The scene conveys a sense of technological sophistication, safety, and the seamless fusion of human and machine intelligence in the autonomous driving experience.

Path Planning and Decision Making

Path planning combines rule-compliant optimization, reinforcement learning, and MDPs to balance comfort, efficiency, and legal compliance. Algorithms weigh options, score trajectories, and make split-second decisions to handle merges, turns, and lane changes.

Control and Actuation

Control layers translate planned trajectories into steering, throttle, and braking commands. Model predictive control anticipates future states, while neural controllers and feedback loops refine actuation for smooth response and precise control.

Layer Main Methods Key Output
Perception CNNs, sensor fusion Objects, lanes, traffic signs
Prediction Sequence models, probabilistic forecasts Trajectories of pedestrians and vehicles
Planning RL, MDPs, optimization Trajectories and maneuvers
Control MPC, neural controllers Actuation commands

Across layers, low decision latency and synchronized subsystems keep cars responsive. Sensor fusion anchored to HD maps secures lane-level localization and improves detection of vulnerable road users. Together, these systems raise accuracy and help fleets operate more reliably in complex traffic.

Technological Enablers for Safe Autonomy in 2025

Local inference on powerful hardware prevents cloud latency from affecting critical control cycles.

Onboard compute and GPUs sustain real-time perception, planning, and control. Multicore CPUs and GPU accelerators run neural networks for sensor fusion and computer vision with deterministic schedules. Companies such as NVIDIA and Intel optimize frameworks so inference meets strict time budgets and redundancy demands.

High-definition maps built from LiDAR and camera sweeps give centimeter-level localization. These maps add lane geometry, speed limits, and traffic control context that improve positioning and reduce margin-of-error on the road.

High-definition, hyper-realistic maps of a futuristic highway, showcasing AI-driven hazard detection and real-time analytics overlaid on the road network. The scene depicts a self-driving car navigating the complex urban landscape, with detailed 3D terrain, photorealistic building facades, and dynamic traffic patterns. The maps are rendered in vibrant colors, with crisp details and a seamless integration of digital information, creating a visually stunning and technologically advanced representation of autonomous vehicle infrastructure. Soft, diffused lighting casts a warm glow, conveying a sense of sophistication and progress. The overall atmosphere evokes a glimpse into the near-future of safe, AI-powered transportation.

5G, V2X and data at scale

High-speed networks support OTA updates, cooperative messages, and real-time diagnostics. 5G and V2X let cars share alerts and receive map patches with low latency.

Massive driving datasets from fleets and simulation fuel model development. Large, diverse data sets help models generalize across U.S. regions and weather. Improved sensor resolution and dynamic range boost detection in low light and adverse conditions.

Enabler Role Benefit
Edge GPUs Real-time inference Deterministic control loops
HD Maps Lane-level context Improved localization
5G / V2X Connectivity Faster updates & cooperative alerts
Large Datasets Model training Robust generalization

AI autonomous driving safety, IoT vehicle monitoring, self-driving prevention

A mix of real-time detection, emergency braking and lane-keeping now forms the first line of collision avoidance.

From ADAS to Autonomy: Preventing collisions with real-time detection and AEB

Real-time detection fuses feeds from cameras and short-range sensors to flag hazards. When algorithms judge risk, automatic emergency braking (AEB) and lane assist act within milliseconds.

These baseline systems scale into higher levels of autonomy by sharing decisions with planners and actuators. Sign and signal recognition helps cars behave lawfully and predictably at intersections.

A sleek, autonomous electric vehicle navigates a serene highway, its exterior dotted with an array of sensors. Overlaying the vehicle's windshield, a real-time AI-powered hazard detection system displays data-rich visuals, alerting the driver to potential road obstacles, weather conditions, and traffic patterns. The car's interior features a sophisticated IoT dashboard, providing the driver with comprehensive vehicle diagnostics, route optimization, and remote monitoring capabilities. Bathed in a warm, golden light, the scene conveys a sense of technological sophistication and seamless integration between autonomous driving and intelligent IoT systems, ensuring maximum safety and efficiency on the roads of 2025.

Driver and Occupant Monitoring for safe handoffs and attention assurance

Driver-facing cameras and behavior models verify readiness for smooth handoffs. Clear HMI prompts and tactile alerts guide drivers to take control when systems request it.

Fleet-Scale IoT Vehicle Monitoring: Telemetry, diagnostics, and maintenance alerts

Telematics streams health data and diagnostics to fleet operators. Over-the-air updates patch software, tune models, and push bug fixes that improve overall performance.

Explainable AI to increase trust, transparency, and regulatory readiness

Interpretable outputs show why a decision fired, aiding engineers and regulators during post-incident reviews. Traceable logic supports compliance with standards such as ISO 26262 and builds user trust.

  • Connected ADAS: AEB, lane-keeping, and detection form a prevention-first stack.
  • Maintenance: Predictive alerts reduce downtime and hidden faults.
  • User experience: Timely alerts, clear prompts, and transparent reasoning improve driver confidence on every road.

Connectivity That Protects: IoT Systems Powering Safer Self-Driving Cars

Connected networks now act as a safety backbone, moving updates and alerts where they belong fast.

A sleek, futuristic autonomous vehicle glides smoothly down a winding highway, its sensors and connectivity systems constantly monitoring the surroundings. In the foreground, a holographic overlay displays real-time AI-powered hazard detection, highlighting potential risks and obstacles with precision. The middle ground features interconnected IoT devices and networks, weaving a protective web of data that shields the car and its passengers. The background is a serene, futuristic cityscape, bathed in a warm, comforting glow that conveys a sense of technological harmony and safety. The overall scene evokes a future where connectivity and AI-driven safety work in tandem to empower the next generation of autonomous vehicles.

Telematics gathers health metrics and performance data from fleets. This stream shows sensor status, actuator response times, and error logs. Engineers use the data to spot trends and tune systems before problems surface.

Over-the-air updates roll out bug fixes, perception upgrades, and calibration patches on a controlled cycle. Rapid OTA distribution reduces downtime and keeps cars running the latest code without service visits.

V2X Communications

V2X messages broadcast hazards, weather alerts, and work-zone notices. Cooperative merging and signal phase timing help smooth traffic and cut conflict points. These messages improve situational awareness for nearby vehicles and infrastructure.

Edge vs. Cloud

Time-critical perception and control remain on-vehicle so decisions stay deterministic when links drop. The cloud aggregates telemetry, trains models, and recommends fleet policies. Together they balance low latency with large-scale learning.

Localized events—weather cells or incidents—are shared fleet-wide to enable proactive rerouting and reduced congestion. Major companies now offer end-to-end connectivity stacks that prioritize secure, reliable links and clear decision authority at the car level.

Capability Where It Runs Benefit
Telemetry & Health Edge capture, cloud aggregation Faster diagnostics and predictive maintenance
OTA Updates Cloud distribution, edge install Rapid fixes and feature rollout
V2X Alerts Edge broadcast & receive Shared hazard awareness, smoother traffic
Model Training Cloud Fleet-wide improvements and analytics

Testing What Matters: Generative AI, Simulation, and Synthetic Data

Digital twins and physics engines let developers stress-test planning and control under millions of scenarios.

Synthetic environments recreate rare, high-risk situations—jaywalking, aggressive merges, and sudden obstructions—without endangering the public. These labs let teams measure how perception and path planning behave when conditions are extreme.

Data augmentation adds weather, lighting, and asset variability so models generalize. Techniques include glare simulation, wet-road textures, occlusion modeling, and varied object appearance for more robust object detection.

Validation at Scale

Millions of simulated miles stress-test algorithms before real-road rollout. Teams use scenario coverage metrics, accuracy thresholds, and failure-mode analysis to judge readiness.

“Waymo runs tens of millions of virtual miles per day to probe edge cases.”

  • Industry examples: Waymo’s virtual miles, Tesla’s FSD simulation, NVIDIA Drive Sim, Cruise’s digital cities.
  • Precise sensor and texture modeling boosts perception fidelity and better trains driver models for varied behavior.
  • Simulation shortens development time and speeds safer releases to cars and fleets.

Benefits and Impact in 2025: Safety, Mobility, and Efficiency

Predictive sensing and consistent rule adherence aim to reduce crashes that stem from human delay.

Enhanced safety results from systems that react faster than people and follow traffic rules reliably. Studies show lane departure warnings and automatic interventions cut certain crash types by measurable percentages. This lowers injuries and emergency response time on U.S. roads.

Mobility gains expand access. Autonomous shuttles and ride-hailing services extend trips for seniors and people with limited mobility. More shared options shrink first- and last-mile gaps and improve transit reach.

Operational and environmental efficiency

Fleet coordination, optimized routing, and platooning reduce fuel use and congestion. Predictive maintenance uses data to cut downtime and lower operating costs for logistics and public transit.

As fleets electrify, smoother traffic flow and fewer idle cycles translate to smaller emissions per mile.

“Computer-controlled systems promise more consistent compliance with signs and rules, improving accuracy in complex scenarios.”

User trust and productivity

Predictable behavior, clear feedback, and transparent explanations build acceptance. Passengers reclaim time for work or rest while cars handle routine travel.

Benefit Quantified Impact Who Wins
Crash reduction Lowered human-error incidents by an estimated 20–40% in tested scenarios Drivers, pedestrians, first responders
Operational cost Up to 15% savings via route optimization and predictive maintenance Logistics operators, transit agencies
Accessibility Expanded service coverage for seniors and disabled riders Communities and public transit users
Emissions Reduced idle time and smoother flow cuts emissions as fleets electrify Cities and regulators

Challenges and Risk Management on the Road to Full Autonomy

Protecting communication channels and ensuring reliable failover are central to risk management for modern vehicles.

Cybersecurity, software reliability, and redundancy

Hardening communications is essential: encrypted links, secure OTA pipelines, and intrusion detection guard fleets from remote compromise.

Engineers pair that with redundancy and failover. Multiple compute lanes, watchdogs, and cold-start recovery reduce the chance of a control or perception outage.

Weather, perception limits, and sensor fusion complexity

Precipitation, fog, and low light degrade sensors and complicate sensor fusion. Robust calibration, adaptive filters, and model retraining help maintain object and sign recognition under harsh conditions.

Testing across varied conditions and synthesizing rare situations improves algorithms and prepares systems for edge scenarios on the road.

Ethics, liability, and U.S. regulatory compliance (ISO 26262)

Clear decision frameworks and audit trails make it easier to assign liability and meet U.S. standards. ISO 26262 practices guide systematic development, traceability, and functional validation.

Human factors matter: driver monitoring, explicit handoff prompts, and limits on system capabilities prevent misuse and overreliance by drivers.

“Comprehensive logging and explainable outputs support root-cause analysis and regulatory review.”

  • Map and signage variability require runtime checks and fallback behaviors for temporary work zones.
  • Incident response needs traceable logs, explainability, and fast update cycles to fix faults in the field.

Conclusion

Bringing together sensor intelligence, fleet connectivity, and realistic simulation shortens the time from lab to lane.

Artificial intelligence supplies core perception, prediction, planning, and control that make cars responsive. Connected systems deliver OTA updates, diagnostics, and V2X cooperation so fleets learn and adapt faster.

Generative simulation and rich data let teams test rare events at scale without risk. Functional safety practices and explainable outputs help meet U.S. standards and build public trust on every road.

Balanced innovation—focused on robust testing, cybersecurity, and clear explainability—will speed wider adoption. Over time, better models, denser data, and stronger edge hardware will cut the time to safer, more reliable vehicles on American streets.

FAQ

What are the core layers of the autonomy stack and how do they work together?

The stack has five main layers: perception (computer vision, traffic sign recognition, object detection using convolutional neural networks), prediction (behavior forecasting for pedestrians, cyclists, and other vehicles), planning (path planning and decision making using reinforcement learning, Markov decision processes, and rule compliance), control (model predictive control and neural controllers with feedback loops), and localization (sensor fusion of cameras, LiDAR, radar, ultrasonics, and high-definition maps). Each layer feeds the next: perception detects, prediction forecasts intent, planning chooses safe trajectories, control executes maneuvers, and localization keeps the system positioned in the world.

How do onboard compute and edge inference affect real-time performance?

Modern systems rely on powerful GPUs and specialized accelerators mounted on the vehicle to run neural networks at low latency. Edge inference reduces round-trip time compared with cloud processing, enabling timely emergency braking, obstacle avoidance, and lane-keeping. High-throughput compute paired with optimized models ensures decisions occur within the tight time budgets required for safety.

What role do HD maps and sensor fusion play in accurate localization?

High-definition maps supply centimeter-level landmarks and road geometry that complement on-board sensors. Sensor fusion merges data from cameras, LiDAR, radar, and GPS to reduce individual sensor weaknesses. Together they improve positional accuracy, keep the system robust in tunnels or urban canyons, and support precise path planning and control.

How can telematics and over-the-air updates improve safety after deployment?

Telematics collect telemetry, diagnostics, and driving metrics from fleets. Engineers use that data to spot failure modes and tune models. Over-the-air updates let manufacturers deploy software patches, perception model improvements, or configuration changes without physical recalls. This continuous delivery loop tightens safety and reliability over time.

What testing methods address rare edge cases and adverse weather?

Developers combine real-world data with synthetic environments and simulation. Generative approaches and data augmentation introduce varied weather, lighting, and scene variability so models see rare conditions during training. Closed-loop simulators, such as NVIDIA Drive Sim or Waymo’s virtual miles, reproduce edge cases repeatedly for validation before road deployment.

How does fleet-scale telemetry help with maintenance and operational efficiency?

Fleet telemetry streams diagnostics and sensor health metrics to central systems. Predictive maintenance algorithms flag components at risk, schedule service, and reduce downtime. For logistics and ride-hailing, this improves uptime, fuel efficiency, and operator routing decisions while lowering total cost of ownership.

What are the main cybersecurity and software reliability concerns?

Risks include remote compromise of telematics, corrupted model updates, and denial-of-service attacks on connectivity links. Mitigations use secure boot, signed updates, redundancy across sensors and compute, intrusion detection, and rigorous software verification. Functional safety standards like ISO 26262 guide reliability and failure-mode planning.

How do V2X and 5G enhance coordination and hazard awareness?

Vehicle-to-everything communications and 5G enable low-latency sharing of road conditions, traffic signals, and hazard warnings between vehicles and infrastructure. That shared context augments sensors for occluded hazards, cooperative maneuvers, and smoother traffic flow, particularly in dense urban corridors.

What is explainable model design and why does it matter for regulation?

Explainable design produces models and decision logs that humans and regulators can inspect. Transparent reasoning, causal attribution, and interpretable behavior traces build trust and make it easier to demonstrate compliance with safety standards and liability frameworks during investigations.

Which industry examples show current progress in simulation and testing?

Leading programs include Waymo’s large-scale virtual miles, Tesla’s FSD simulation fleet, NVIDIA Drive Sim for hardware-in-the-loop validation, and Cruise’s digital city environments. Each combines real-world telemetry with synthetic testing to accelerate corner-case discovery and model hardening.

How do perception limits and weather affect system performance?

Adverse weather and low visibility degrade camera and LiDAR returns and increase false negatives. Sensor fusion helps, but systems must detect degraded conditions and adjust behavior—slowing, rejecting automation, or handing control to a human. Robust models, redundant sensors, and conservative planning mitigate risk.

What measures ensure safe handoffs between automated systems and human drivers?

Driver and occupant monitoring systems track gaze, head pose, and engagement. When the system detects inattention or an inability to take control, it issues graded alerts, attempts gentle interventions, and, if necessary, performs a safe stop. Clear human-machine interfaces and defined handoff procedures reduce confusion.


Let’s Get Started

Top 7 Player Performance Tracking Systems in Upcoming Years

Imagine a coach walking onto the field with a single question: “How do we make every practice count?” A cracked bat, a smart ball ping, and a coach peering at a live readout changed one afternoon into a plan. That split-second data helped the team fix a swing and avoid an injury the next week.

This guide maps how connected equipment, sensors, and devices will reshape player performance. We cover the full stack — from wearables and instrumented gear to venue sensors and cloud platforms. Expect clear examples, like sensor-equipped bats and smart balls, and practical ways organizations use data to improve health and fitness.

Over the next few years, teams and leagues will lean on technology to turn raw metrics into immediate insights for coaches and players. This section previews seven system categories, the value they deliver, and what development teams must consider to build reliable solutions.

AI sports tracking, IoT athlete monitoring, mobile sports analytics

Key Takeaways

  • Connected equipment and sensors will change how coaches make decisions in real time.
  • Player systems include wearables, smart equipment, optical platforms, and integrated solutions.
  • Data and device interoperability matter for safe, actionable performance insights.
  • Industry momentum is driven by performance gains, health benefits, and new revenue models.
  • Evaluating systems requires attention to sensors, development, reliability, and real-world workflows.

Why performance tracking matters now: present-day benchmarks, future payoffs

Coaches now rely on live metrics to shape daily training and reduce injury risk. Clear, objective data helps teams move from guesswork to repeatable gains. Sensors in gear, clothing, and venues capture movement, ball speed, and environment to inform smarter sessions.

A high-tech athlete monitoring system, captured in a vibrant, dynamic scene. In the foreground, a sportsman dons a smart vest with a live, holographic overlay of real-time performance metrics - heart rate, oxygen levels, speed, and more. The athlete stands in a well-lit, modern training facility, the background blurred yet hinting at state-of-the-art equipment and facilities. Beams of light cast dramatic shadows, emphasizing the technological integration. The overall atmosphere conveys a sense of precision, progression, and the future of athletic performance tracking.

User intent and outcomes center on three goals: enhance performance, prevent injuries, and optimize recovery. Good programs let coaches tailor load and drills to each player’s readiness.

User intent and outcomes

  • Enhance performance: use heart rate, speed, and movement metrics to refine plans.
  • Prevent injuries: watch fatigue, workload, and movement quality to reduce injury risk.
  • Optimize recovery: track sleep and activity balance to support readiness.

KPI snapshot

Key metrics include heart rate, movement patterns, speed, fatigue markers, load distribution, and technical accuracy. These measures give coaches actionable insights to adjust intensity, volume, or focus.

Data quality, consent, and role-based access are essential. Simple, useful dashboards win adoption and produce the incremental wins that compound across seasons.

Top 7 player performance tracking systems shaping the next few years

A new class of devices captures precise movement and recovery data every day. These categories map where teams get useful signals, from readiness scores to impact alerts. Below are the seven system types coaches and staff should evaluate.

A sleek and futuristic sports performance tracking system, featuring a high-tech athlete donning a smart vest displaying real-time biometric data overlays. The scene is bathed in a cool, futuristic lighting, with a smooth, minimalist background that emphasizes the advanced technology. The athlete's movements are captured from an dynamic, three-quarter angle, highlighting the seamless integration of the wearable sensors and the data visualizations. The overall atmosphere conveys a sense of cutting-edge innovation shaping the future of player performance monitoring.

Wearable biometrics and smart wearables

What they measure: heart rate, sleep quality, and muscle activity. Baseline levels and daily deltas reveal fatigue and recovery trends.

Coaches use those deltas to set session intensity and rest windows that help athletes avoid injuries.

Smart sports equipment with embedded systems

Rackets, shoes, and clubs now include processors and sensors to measure swing mechanics, gait, and impact at the moment of action.

Examples like NBA smart basketballs and instrumented bats validate on‑field use and feed technique adjustments.

Optical and sensor-based player & ball tracking

RFID tags, IMUs, and computer vision fuse to map movement, speed, and spatial positioning with high fidelity during drills and games.

Edge video analytics and coaching tools

Low‑latency video processing lets coaches tag clips, review form, and share insights quickly. Mobile dashboards speed decisions in practice.

Safety and injury‑prevention devices

Smart helmets and knee braces detect risky loads and impact forces. Early alerts change drill plans and reduce injury risk.

Environmental and venue monitoring

Temperature, humidity, and air quality sensors help staff adjust workloads and hydration protocols in real time — Wimbledon offers a successful example.

Integrated recovery and health ecosystems

Central platforms combine wearable and equipment data into one readiness profile. That unified view helps coaches plan workloads across levels and the season.

  • Interoperability matters: open data lets teams move information across devices and platforms without vendor lock‑in.
  • Decisions enabled: load adjustments, technique fixes, altered drills, and targeted recovery plans that help athletes maintain performance.

Best practices to evaluate systems: accuracy, latency, and reliability

Evaluate systems by focusing first on measurement fidelity and how that fidelity holds up under real practice loads.

A high-tech sports laboratory with state-of-the-art motion capture systems and data visualization displays. In the foreground, a professional athlete wearing a smart vest with an augmented reality overlay showcasing real-time performance metrics like speed, power, accuracy, and stamina. The middle ground features various sensors, cameras, and diagnostic equipment monitoring the athlete's movements and biometrics. The background is a sleek, minimalist space with clean lines, neutral tones, and soft, diffused lighting, creating a serene, scientific atmosphere.

Ground-truthing matters. Demand validation that benchmarks accuracy against gold-standard measurements. Ensure sampling rate and rate stability match the motion speed you need to capture.

Ground-truthing performance metrics

Use synchronized references—high-speed cameras or lab sensors—to verify incoming data streams.

Sensor fusion (IMUs, RFID, and video) improves signal quality, but verify alignment across streams to avoid misleading insights.

Edge vs. cloud trade-offs

Decide what must run at the edge for low-latency feedback and what can run in the cloud for deep modeling and historical analysis.

Concrete targets help set expectations: well-architected systems can reach 93.45% accuracy with 12.34 ms time-to-feedback and 98.37% data reliability when edge and cloud are balanced.

“Validate sampling rates, monitor drift, and pilot at increasing complexity so staff trust the numbers in real sessions.”

  • Calibration & reliability: periodic calibration, drift detection, and environmental compensation.
  • Coach guidance: interpret confidence intervals and error bounds before changing drills.
  • Operational checks: battery life, sensor placement, and uptime must match training demands.
  • Documentation: record validation methods and outcomes for transparent procurement decisions.

Run pilots before scale. Start small, collect data, and iterate so the system delivers consistent insights without adding staff friction.

AI sports tracking, IoT athlete monitoring, mobile sports analytics

Well-architected systems bridge on-device sensing and team dashboards so decisions happen in seconds. Design starts with clear layers that move raw signals into useful guidance for coaches and athletes.

Designing a unified stack: sensors, data pipelines, models, and apps

Sensors capture reliable motion and bio signals. Data pipelines clean, align, and timestamp inputs for consistent use.

Machine learning models then turn that stream into cues, readiness scores, and event tags. Role-based apps expose simple actions for coaches, compact cues for athletes, and detailed trends for performance staff.

From insights to action: coach and athlete feedback loops in real time

Place low-latency models at the edge for instant corrections and keep deeper models in the cloud for season-long patterns.

“Small, timely feedback—rep by rep—changes technique more than weekly reports.”

A professional athlete wearing a sleek, high-tech smart vest stands on a dimly lit sports field, surrounded by a holographic display of real-time biometric data and IoT performance metrics. Soft, dramatic lighting casts dynamic shadows, highlighting the athlete's muscular form and intense focus. The background fades into an ethereal, futuristic landscape, blending seamlessly with the cutting-edge technology. The scene conveys the intersection of human athleticism and advanced IoT monitoring, capturing the essence of cutting-edge sports analytics.

Layer Role Example
Sensors Capture IMU in connected shoes
Pipeline Clean & Sync Gateway timestamping
Models & Apps Translate & Act Edge rep cue; coach dashboard

Integration uses standard APIs and data formats, plus governance for model versioning, A/B tests, and drift checks. Prioritize privacy-by-design and secure provisioning so staff trust every alert during practice and games.

Embedded intelligence in sports equipment: from processors to practical gains

Embedded processors now let gear make sense of motion in real time, right on the device. Low-power chips and optimized firmware capture high-fidelity signals while keeping batteries alive across long sessions.

A athlete wearing a Tshirt, and on tshirt form-fitting sports vest with an embedded digital display showcasing real-time performance metrics. The vest's intelligent design seamlessly integrates sensors and processors, tracking the wearer's vital signs, speed, and movement data. Surrounded by a minimalist, high-tech environment, the scene exudes a sense of cutting-edge innovation in sports technology. Subtle lighting highlights the athlete's determined expression, while a blurred background emphasizes the focus on the advanced sportswear. The overall composition conveys the fusion of human physicality and embedded intelligence, reflecting the future of player performance tracking systems.

Precision tracking and energy-efficient wearables

Precision matters. On-device signal conditioning and sensor fusion record swing plane, ground contact timing, and muscle activation with minimal latency.

That precision helps coaches link technique changes to performance and recovery outcomes. Wearable sensors for heart rate, temperature, and motion feed session logs and readiness scores in team platforms.

  • Energy-efficient design: low-power MCUs and duty-cycled sensors extend runtime and reduce charging tasks.
  • Hybrid processing: rep-level cues run on-device; deeper models run in the cloud for season trends.
  • Accuracy practices: calibration, consistent placement, and robust filtering sustain reliable measurements in real play.

Durability and ergonomics ensure devices survive impacts, weather, and cleaning without losing function. Integrated apps visualize progress, flag anomalies, and help staff act faster.

Feature Practical Gain Design Consideration
On-device processing Instant rep feedback Low-latency firmware, power budget
Precision sensors Quantified technique metrics Calibration, placement consistency
Wearable biometrics Better load & recovery planning Comfort, skin contact quality
Durable enclosures Reliable field use Materials, sealing, sanitation

Iterative field development proves value: validate that embedded solutions change movement, reduce errors under fatigue, and improve readiness across busy schedules.

Connectivity choices that make or break accuracy and battery life

Connectivity choices shape how reliably devices deliver real‑time cues during practice and competition.

Short-range: Bluetooth Low Energy (BLE) is best for on‑body sensors and wearables. BLE keeps pairing stable and conserves battery so session flow stays smooth.

High-throughput: Wi‑Fi fits smart gym equipment and stations where video or bulk uploads support immediate review by coaches and staff.

Long-range options and low power

NB‑IoT works well for city‑wide coverage and reliable long‑distance telemetry from equipment in the field. LoRaWAN extends to 10–15 km and suits endurance events with infrequent packets and long battery life.

5G and edge computing for time-sensitive feedback

Use 5G and edge gateways when rep‑level feedback must happen in milliseconds. Edge processing reduces lag so cues arrive within a rep, enabling actionable corrections.

  • Security & interference: plan encryption and channel management for crowded arenas to protect data integrity.
  • Battery vs bandwidth: right‑size each system—high bandwidth for video, low power for remote sensors.
  • Fail-safe tips: local buffering and deferred sync prevent data loss during outages.

“Match connectivity to the device role: the right network lowers cost, extends uptime, and helps prevent injuries by delivering timely alerts.”

From lab to field: proven use cases and measurable results

Field trials prove that well‑integrated systems deliver clear, repeatable gains for teams and staff. Real deployments show how reliable data and fast feedback change coaching plans and reduce risk.

Pro teams and events

NBA smart basketballs embed sensors that quantify touch, rotation, and speed to speed player development and refine technique.

NFL shoulder pads with Zebra RFID capture position, movements, and collision profiles to support tactics and help prevent injuries.

Wimbledon uses environmental devices to guide scheduling, hydration, and heat rules so players and fans stay safer during extreme conditions.

Academic benchmark and field translation

A hybrid TCN + BiLSTM + Attention model proved 93.45% accuracy with 12.34 ms latency across 147 athletes in track, basketball, soccer, and swimming. The study balanced edge responsiveness with cloud analytics and reached 98.37% reliability.

Validated machine learning models move from lab prototypes to field systems when pipelines, synchronization, and robust data handling are included. That process preserves accuracy and shortens time-to-action for coaches.

  • Heart rate and workload metrics map to player levels and fatigue so staff can tune session intensity.
  • Movement metrics from devices and wearables identify skill gaps and prescribe targeted drills.
  • Reliability and sync across streams are essential so staff trust live numbers during games and practice.

“Start with proven applications, then iterate development to match your competitive context and staffing model.”

Implementation playbook for U.S. programs: integration, compliance, and scaling

A clear rollout plan turns promising prototypes into reliable tools that coaches and staff actually use. Build a stepwise development path that ties market research to pilot outcomes and a staged rollout. Start small, learn fast, and expand only after staff trust the system.

Data privacy, consent, and role-based access

Protect sensitive health and performance records. Implement consent flows and role-based apps so coaches, physicians, and trainers see only what they need.

Document retention, audit logs, and institutional policy alignment must be baked into contracts and training plans.

Systems integration with existing devices, apps, and workflows

Plan for APIs, unified data models, and vendor-neutral formats to reduce friction. Map current workflows and meet staff where they operate.

  • Development checklist: needs assessment, hardware selection, software build, pilot testing, refinement, and rollout.
  • Operational expectations: uptime SLAs, support hours, and scheduled updates during off‑season.
  • Procurement & governance: success metrics, data ownership terms, exit clauses, and clinical review of injury thresholds.
  • Scale & observability: network planning, device provisioning, secure updates, and dashboards for system health.
  • Change management: training for coaches and athletes, clear docs, and feedback channels tied to iterative improvements.

“Partner with experienced vendors and industry experts to speed development and meet compliance while protecting player welfare.”

Conclusion

Today’s platforms turn raw signals into short, actionable instructions coaches can use rep to rep.

Connected equipment, embedded sensors, and real-time models deliver clear insights that improve consistency and on-field performance. These advances create faster feedback loops and support smarter training choices.

Teams benefit most when solutions fit daily workflows. Integration with staff routines turns data into planned drills, targeted recovery, and better load management for athletes.

Start with high-impact use cases, validate accuracy and latency, then scale. Well-validated systems with clear benchmarks protect decision quality and help athletes perform while lowering risk.

Invest in interoperable design and coach-centric tools to extract lasting value. Ongoing evaluation ensures each upgrade measurably enhances performance and recovery across a season.

FAQ

What metrics should coaches prioritize when choosing a player performance tracking system?

Coaches should focus on heart rate, movement patterns, speed, fatigue, external load, readiness, and accuracy. Also consider sleep and recovery metrics, muscle activity, and contextual data like environmental conditions. These KPIs help detect fatigue, guide training load, and reduce injury risk while improving conditioning and technique.

How do wearable biometrics compare to optical and sensor-based tracking?

Wearable biometrics provide direct physiological signals such as heart rate and muscle activity and excel at monitoring recovery and internal load. Optical and sensor-based systems — including IMUs, RFID tags, and computer vision — offer precise positional data and ball tracking. Combining both via sensor fusion yields richer insights and better validation of movement and exertion metrics.

What accuracy and latency targets are realistic for real-time feedback?

Aim for sampling rates and fusion methods that keep latency under a few tens of milliseconds for timely coaching cues. Accuracy depends on the metric — positional tracking often targets sub-meter precision, while heart-rate variability requires consistent sampling. Validate systems against ground-truth lab measures and field tests to confirm reliability.

Should teams prioritize edge processing or cloud analytics?

Use edge processing for low-latency coach feedback, safety alerts, and battery savings. Cloud analytics suits long-term modeling, heavy machine learning, and cross-player comparisons. Many programs adopt a hybrid stack: immediate inference at the edge, deeper analysis and model training in the cloud.

How can smart equipment like connected shoes or racket sensors improve performance?

Embedded sensors capture force, orientation, and stroke mechanics directly from the tool, enabling precise technique analysis and actionable coaching cues. These devices can detect asymmetries, load spikes, and technique drift to prevent overuse injuries and optimize equipment choices and fit.

What role do environmental and venue sensors play in training programs?

Environmental monitoring tracks temperature, humidity, air quality, and surface conditions to adjust load, hydration, and recovery plans. These inputs help coaches tailor sessions, reduce heat-related risks, and ensure consistent training conditions for reliable metrics.

How do safety systems like smart helmets and braces reduce injury risk?

Smart safety devices measure impact forces, joint loads, and abnormal movement patterns to trigger alerts or modify practice intensity. When combined with load and fatigue metrics, they enable proactive interventions, targeted rehab, and data-informed return-to-play decisions.

What are best practices for validating a new monitoring system?

Ground-truth bench tests, cross-validate with laboratory tools, and run field trials across different playing surfaces and intensities. Check sensor fusion stability, sampling consistency, and repeatability. Document validation protocols to meet compliance and stakeholder confidence.

How do teams address data privacy and consent when deploying tracking systems?

Implement role-based access, encrypted data storage, and clear consent procedures. Limit personal data sharing, anonymize datasets for research, and follow HIPAA or state privacy laws where applicable. Transparent policies build trust among players and staff.

What connectivity options best balance battery life and data needs?

Choose BLE for short-range, low-power telemetry; Wi‑Fi for high-throughput sessions; NB‑IoT or LoRaWAN for sparse telemetry over long ranges; and 5G when ultra-low latency and large data transfers are required. Match the protocol to session goals and power constraints.

Can small programs scale these systems affordably?

Yes. Begin with modular stacks: low-cost wearables, mobile apps for local analysis, and selective cloud services. Prioritize metrics that drive the biggest outcomes, integrate with existing devices, and phase investments as ROI becomes clear.

How do recovery ecosystems integrate with daily coaching workflows?

Recovery platforms synthesize sleep, HRV, muscle soreness, and load to produce readiness scores and action plans. Deliver concise, coach-friendly insights via mobile apps and automated alerts to guide session adjustments and personalized rehab plans.


Let’s Get Started

Top 5 Hospital Asset Tracking Systems In Upcoming Years

Once, a late-night procedure stalled because a needed ventilator could not be found. A nurse ran between units while the surgical team waited. That delay cost time, stress, and a tense moment for the patient.

Modern care should not hinge on where equipment sits. U.S. clinical teams move beyond spreadsheets to real-time visibility that turns raw data into action. Real-time location and usage insights help teams run preventive maintenance, cut rental spend, and reduce delays.

hospital asset tracking system, BLE and IoT-powered hospital inventory hub

This guide previews the 2025 landscape, from BLE and IoT-powered hospital inventory hub choices to RFID and RTLS options. You’ll learn how connected CMMS workflows sync work orders to location data. Expect clear ROI drivers: faster audits, better utilization, higher uptime, and measurable cost savings.

For inquiries, reach out: sales@iottiv.com | www.iottive.com

Key Takeaways

  • Real-time visibility moves teams from chasing equipment to delivering care.
  • BLE often wins for cost and battery life; RFID and UWB fit niche needs.
  • Connected CMMS closes the loop from location data to maintenance work orders.
  • ROI shows in faster audits, fewer rentals, and improved staff productivity.
  • Prioritize HIPAA-first security, role-based access, and phased rollouts.

The state of hospital asset tracking in 2025 and why it matters

By 2025, hospitals are leaving manual ledgers behind and adopting live location tools that change daily operations.

From spreadsheets to smart RTLS: eliminating downtime, loss, and hoarding

Legacy spreadsheets act as static ledgers. They don’t link location to maintenance or usage. That gap causes missed inspections, hoarded infusion pumps, and longer hunts before procedures.

Smart RTLS flips the script. It creates work orders automatically, sends tasks to technicians’ mobile apps, and uses geofencing to protect high-value items.

A modern hospital corridor, dimly lit with warm tones. In the foreground, a nurse approaches a medical cart, her movements highlighted by subtle shadows. The cart's surface is adorned with sleek, compact tracking devices, blinking with BLE signals. In the middle ground, doctors and staff navigate the space, their movements tracked seamlessly by the intelligent asset management system. The background reveals rows of equipment cabinets, their contents monitored in real-time, ensuring efficient inventory and preventing shortages. The atmosphere conveys a sense of calm efficiency, where technology seamlessly integrates with the hospital's operations, streamlining workflows and enhancing patient care.

Market momentum: why hospitals are investing to boost efficiency and compliance

Health systems are investing fast. The market is set to grow at over 15% CAGR through 2030. Benefits are clear: 20–25% fewer critical equipment issues, up to 90% less time locating gear, 15–30% lower rental spend, and ~40% faster audit prep.

Legacy tools Smart RTLS Impact
Manual lists, siloed data Real-time location and mobile workflows Faster retrieval, fewer delays
No maintenance orchestration Auto work orders by criticality Reduced equipment downtime
Hoarding and hidden demand Utilization analytics and alerts Equitable redistribution, lower rental costs

Operational efficiency ties directly to patient care and compliance readiness. Let’s connect for inquiry: sales@iottiv.com | www.iottive.com

What a modern hospital asset tracking system must deliver

Visibility must be practical, mobile-first, and tied to rules that reduce downtime and waste.

A bustling hospital ward, equipment and supplies tracked in real-time by a network of smart Bluetooth beacons. A doctor's tablet displays the live location of a critical care bed, its status updated seamlessly. Nurses navigate the corridors, their movements traced by the asset tracking system, ensuring every item is where it needs to be. Warm, diffused lighting casts a soothing glow, while high-resolution cameras capture the scene from multiple angles, providing a comprehensive view of the hospital's digital nervous system in action.

Real-time location and geofencing across multi-site facilities

Indoor GPS using rfid, BLE, or Wi‑Fi triangulation gives instant discovery across wings and campuses. Zone-based alerts flag when equipment moves outside permitted areas to prevent loss and hoarding.

Usage-driven preventive maintenance and AEM-ready workflows

Prioritize fixes by actual use, not just calendars. Systems capture run-time, cycles, and wear to trigger AEM-based PMs. That cuts unnecessary service and focuses techs where utilization and risk intersect.

Compliance and audit trails aligned to Joint Commission readiness

Automatic logs record inspections, calibrations, and PM. Single-click exports produce audit-ready documentation so managers meet compliance with less paperwork.

Mobile-first access, QR/NFC tagging, and work order execution

Technicians scan QR/NFC tags to pull histories, close work orders, and sync updates offline. Smart triage reorders queues so critical medical equipment gets priority service, lowering equipment downtime.

  • Lifecycle intelligence: combine usage and repair logs to guide replace-vs-repair choices with depreciation data.
  • Inventory controls: PAR levels and role-based access reduce silos and keep supplies balanced.
  • CMMS integration: alerts become action items to eliminate gaps between detection and remediation.

Let’s connect for inquiry: sales@iottiv.com | www.iottive.com

BLE vs RFID vs UWB vs barcodes: choosing the right RTLS stack

Selecting the right locating tech starts with clear goals: count accuracy, real-time updates, or sub-meter precision. Define whether you need fast storeroom counts, routine mobile device finds, or surgical-grade location before choosing a stack.

An expansive hospital ward, bathed in cool blue tones and crisp white lighting. In the foreground, a variety of medical equipment - IV stands, wheelchairs, and hospital beds - each equipped with sleek, modern BLE tracking tags, their signals pulsing in real-time. The middle ground reveals a complex network of overlapping RFID and UWB signals, visualized as a shimmering grid of data. In the background, a bank of large display screens showcases a live map of the facility, color-coded zones, and the precise locations of every trackable asset. The atmosphere is one of efficiency, control, and the seamless integration of cutting-edge RTLS technologies.

Barcodes for basics vs dynamic equipment realities

Barcodes are cheap and great for receiving and periodic audits.

They fail for items moved many times per shift. Use them for storerooms and controlled stock where scans are practical.

RFID trade-offs

Passive rfid tags cut tag cost but do not deliver live location. Active RFID improves visibility but raises reader and infrastructure costs, affecting total cost of ownership.

Why Bluetooth Low Energy often leads

BLE tags are affordable, work with smartphones, and scale via beacon networks. Proper tuning yields long battery life—often up to eight years—and lets teams tune accuracy where needed.

When UWB is worth the premium

UWB delivers sub-meter precision for high-criticality zones. Choose it when surgical or procedural workflows demand tight location tolerances despite higher deployment expense.

  • Decision criteria: accuracy needs, building materials, IT limits, battery cycles, and integration with Wi‑Fi.
  • Maintenance: reader density for rfid/uwb; beacon placement for BLE; and scheduled battery swaps.
  • Security and interference: pick encrypted channels and hospital-compliant policies.

Pragmatic hybrid: barcodes for storerooms, BLE for mobile equipment, and selective UWB where precision matters. Anchor any choice in ROI to cut search time, reduce equipment downtime, and boost operational efficiency.

Let’s connect for inquiry: sales@iottiv.com | www.iottive.com

Top hospital asset tracking systems to watch in the upcoming years

Leading vendors now bundle location, maintenance, and analytics into turnkey platforms. These platforms aim to cut search time, lower rental spend, and improve patient care by making device visibility actionable.

A modern hospital corridor bathed in bright, clinical lighting. In the foreground, a technician examines a medical device, its status displayed on a tablet interface. In the middle ground, nurses push gurneys down the hallway, each equipped with smart BLE tags for real-time asset tracking. In the background, a large dashboard displays the locations and status of critical hospital equipment, enabling efficient resource management. The atmosphere conveys a sense of technological prowess, seamless workflow, and patient-centric care.

BLE-centric RTLS platforms for rapid, scalable deployments

BLE-first solutions such as Kontakt.io enable quick rollouts using smartphones and beacon grids. They support PAR-level automation, alerts, and fleet analytics while keeping tag costs low.

Connected CMMS ecosystems that close the loop

Integrated CMMS transforms alerts into work orders. This syncs preventive maintenance, AEM routines, and audit-ready logs so teams spend less time on paperwork and more on uptime.

Enterprise suites for large campuses

Enterprise offerings from CenTrak, Stanley, and AeroScout-class vendors suit complex sites. They link to EHR, ERP, and cloud services to unify data across clinical and facilities teams.

IoT analytics and hybrid RFID/BLE approaches

IoT analytics provide utilization heatmaps and predictive insights to right-size fleets like pumps and defibrillators. Hybrid deployments use rfid for storerooms and BLE for mobile equipment, merged into a single dashboard for clear comparisons.

Platform Type Strength Best Use
BLE-centric Fast deploy, low tag cost Mobile equipment, rapid scale
Enterprise RTLS Deep integrations, high scalability Complex campuses, EHR/CMMS sync
Hybrid RFID/BLE Storeroom accuracy + mobile visibility Mixed environments, surgical tools
IoT analytics Utilization and compliance reports Fleet right-sizing, audit prep

Compare vendors by battery life, accuracy modes, mobile apps, API openness, SSO, and total cost of ownership. Align selection to clinical goals to gain measurable improvements in operational outcomes and patient care.

Let’s connect for inquiry: sales@iottiv.com | www.iottive.com

hospital asset tracking system, BLE and IoT-powered hospital inventory hub

One interoperable layer can turn scattered records into a live operations center for clinical and facilities teams.

A state-of-the-art hospital inventory hub, illuminated by soft, diffused lighting. In the foreground, an array of BLE-enabled smart tags track the real-time location of critical medical equipment, visualized as a glowing, interconnected network. The mid-ground reveals a sleek, minimalist user interface, showcasing detailed asset information and intuitive controls. In the background, a vast, modern hospital facility fades into the distance, conveying the scale and integration of this comprehensive asset tracking system. The overall atmosphere is one of efficiency, precision, and technological sophistication, perfectly suited to illustrate the "BLE and IoT-powered hospital inventory hub" section of the article.

Centralizing assets, data, and decisions in one interoperable hub

Unify records, PM schedules, and utilization so engineers and clinicians share the same source of truth. A connected CMMS merges work orders with device histories and gives single-click exports for compliance.

Integrations with EHR, ERP, CMMS, and RTLS to streamline workflows

Open APIs sync location feeds from rfid, Wi‑Fi, and beacon layers into one dashboard. This reduces duplicate entry and keeps status current across EHR and ERP views.

From visibility to action: alerts, triage, and automated tasking

Alerts become work orders automatically, then assign by skill and proximity. Mobile QR/NFC access pulls manuals and closes tasks at the bedside.

  • Usage-driven PM improves availability and extends equipment life.
  • Utilization heatmaps and PAR automation right-size inventory and curb hoarding.
  • Role-based access protects sensitive operational data while keeping teams informed.

Let’s connect for inquiry: sales@iottiv.com | www.iottive.com

Proven benefits and ROI drivers for U.S. hospitals

Concrete ROI figures show why visibility technology moves from pilot projects to enterprise rollouts. Modern deployments link location feeds with maintenance so teams measure real savings fast.

Higher uptime, lower rental and CapEx, and faster audits

Uptime improves: preventive maintenance and faster fault response cut cancellations. Facilities report 20–25% fewer critical equipment issues and meaningful drops in equipment downtime.

Costs fall: utilization analytics reduce rentals by 15–30% and help avoid unnecessary purchases. Many sites see up to a 4:1 ROI from reclaimed time and fewer failure events.

Audit readiness: automated logs and digital trails shrink prep time by ~40%, easing compliance work for engineering teams.

Better patient flow and staff productivity, less burnout

Visibility reduces search time—sometimes up to 90% less time locating gear—returning hours to nurses and biomeds. That extra time improves patient care and lowers staff stress.

Other gains include less hoarding via geofencing, clearer lifecycle decisions using depreciation data, and consistent benefits for both community centers and large academic campuses.

Baseline metrics to track: uptime, retrieval time, rentals, and audit hours. Measure these to validate program success.

Let’s connect for inquiry: sales@iottiv.com | www.iottive.com

Implementation roadmap: security, compliance, and scale

Start implementation by locking down data flows and access rules before any hardware goes live.

HIPAA-first design, encryption, and role-based access

Encrypt data in transit and at rest. Use SSO, MFA, and detailed audit logs to protect operational information. Role-based permissions limit views to what each team needs.

A phased rollout plan: pilots, PAR levels, and change management

Begin with a high-impact pilot to validate RTLS accuracy and mobile workflows. Tune PAR levels early to free up equipment and cut search time.

Train super-users, map stakeholders, and use short job aids. Collect feedback, then scale with measured waves.

Future-proofing with open APIs and sensor interoperability

Design integrations for EHR, ERP, and CMMS using open APIs. Plan for IoT sensor data to expand monitoring to temperature and vibration over time.

Phase Focus Key Outcome
Security Encryption, SSO/MFA, audit logs Compliance and protected data
Pilot RTLS validation, PAR tuning Quick wins in utilization
Scale Open APIs, lifecycle policies Interoperable, future-ready platform

Define AEM governance, tag lifecycles, and data-quality rules up front. Align reports to leadership goals: uptime, retrieval time, rentals, and audit hours for continuous improvement.

Let’s connect for inquiry:

sales@iottiv.com

www.iottive.com

Conclusion

When location, usage, and maintenance data converge, engineers and clinicians can stop searching and start fixing.

Replace static logs with a real-time platform that links location to automated work orders. A BLE-led RTLS often gives the best mix of cost and scale, while rfid and UWB fill precision or storeroom roles.

Must-have features include geofencing, usage-driven PM and AEM, digital audit trails, mobile QR/NFC workflows, and automatic work order creation. The payoff: higher uptime, fewer rentals, faster audits, lower costs, and better patient care.

Begin with a secure, phased rollout, open APIs, and strong change management to ensure adoption. For a discovery call to map requirements and pilot options, contact sales@iottiv.com | www.iottive.com.

FAQ

What are the key benefits of implementing a modern asset tracking solution in healthcare?

A modern solution reduces equipment downtime, cuts rental and capital costs, speeds audits, and improves staff productivity. It delivers real-time location, utilization metrics, and maintenance alerts so caregivers spend less time searching for pumps, monitors, and other devices and more time with patients.

How do BLE, RFID, UWB, and barcodes compare for equipment location?

Barcodes work well for inventory basics and low-cost tagging. RFID offers passive, low-cost tagging but can need complex readers. UWB gives centimeter-level precision for high-value workflows but costs more. Bluetooth Low Energy strikes a balance with good range, battery life, and scalability for many clinical use cases.

Can these platforms integrate with existing clinical systems like EHR and CMMS?

Yes. Leading platforms provide open APIs and native connectors for EHR, ERP, and CMMS so location events become actionable work orders, maintenance schedules, and clinical alerts. Integration reduces manual entry and improves compliance and audit trails.

How does real-time location improve preventive maintenance and uptime?

Location plus usage data enables condition-based or usage-driven maintenance. Systems can trigger preventive tasks when runtime thresholds are hit, lowering unexpected failures and extending equipment life while ensuring devices are available when needed.

What privacy and security controls should a hospital require?

Require HIPAA-first design, encrypted communications, role-based access, and regular vulnerability testing. Ensure data segregation, audit logging, and compliance documentation to satisfy IT and regulatory teams during evaluations.

How do I choose the right RTLS stack for a multi-site health system?

Assess accuracy needs, asset mobility, facility layout, and budget. Choose BLE for scalable deployments, UWB for high-precision zones, and RFID for tag-density problems. Prioritize open APIs, vendor interoperability, and a phased pilot before enterprise rollout.

What ROI timeline can hospitals expect after deployment?

Many systems show measurable benefits within 6–12 months through reduced rentals, fewer lost devices, faster audits, and improved staff efficiency. ROI depends on baseline inefficiencies, scope, and adoption of workflow automation.

How do hybrid solutions help in mixed clinical environments?

Hybrid solutions combine BLE, RFID, and barcodes to match technology to use case—BLE for mobile devices, RFID for sterile supply carts, and barcodes for consumables. This approach optimizes cost while covering diverse asset types.

What deployment approach minimizes disruption to clinical workflows?

Use a phased rollout: start with a pilot unit, validate PAR levels and workflows, refine tagging and alerts, then expand. Include clinical champions, training, and clear SOPs so staff adopt the new tools without workflow friction.

How do analytics and utilization reports drive better decision-making?

Analytics reveal hidden usage patterns, underused capital, and bottlenecks. Reports support staffing decisions, capital planning, and preventive maintenance prioritization, improving operational efficiency and patient throughput.

Are there off-the-shelf platforms recommended for rapid deployments?

Several BLE-centric vendors offer rapid, scalable deployments with cloud management and mobile apps for frontline staff. Evaluate vendors on pilot success, integration capabilities, and support for device lifecycle management.

What should be included in service-level agreements for these solutions?

SLAs should cover uptime guarantees, support response times, software updates, data retention policies, and performance metrics for location accuracy and battery life. Clear escalation paths help maintain operational continuity.

How do tracking solutions support compliance and audits?

They maintain tamper-evident logs, automated audit trails, and location history for each tagged device. This documentation simplifies inspections and helps demonstrate readiness for regulatory requirements.

What are common pitfalls to avoid during implementation?

Avoid inadequate change management, poor tagging strategies, skipping pilot testing, and ignoring integrations. These lead to low adoption, inaccurate data, and unmet ROI expectations.

How do systems handle battery life and tag maintenance?

Modern tags have extended battery life and remote monitoring for low-battery alerts. Workflow automation can schedule battery replacements during low-usage windows to avoid service gaps.


Let’s Get Started